Temporal dynamics within a contemporary latitudinal diversity gradient
Abstract
Poleward declines in species diversity [latitudinal diversity gradients (LDG)] remain among the oldest and most widespread of macroecological patterns. However, their contemporary dynamics remain largely unexplored even though changing ecological conditions, including global change, may modify LDG and their respective ecosystems. Here, we examine temporal variation within a temperate Northwest Atlantic LDG using 31 years of annual fisheries-independent surveys and explore its dynamics in relation to a dominant climate signal [the wintertime North Atlantic Oscillation (NAO)] that varies interannually and alters the latitudinal gradient of Northwest Atlantic continental shelf bottom water temperatures. We found that the slopes of the annual LDG vary dramatically due to changes in geographic distributions of 100+ species, variations that are concealed within the cumulative, static LDG. These changes are strongly associated with changes in NAO sign and strength. This is the first illustration of temporal dynamics in a contemporary LDG and the first demonstration of the speed at which local environmental variations can alter an LDG. Our findings underscore the need to investigate factors that modify LDG separately from those that contribute to their origins.
Introduction
Decreases in the numerical diversity of species and higher taxa from the tropics to the poles [latitudinal diversity gradients (LDG)] remain among the oldest (Hawkins 2001), and most prevalent of biogeographic patterns. These latitudinal gradients occur across disparate habitats (Fischer 1960; Rosenzweig 1995; Willig et al. 2003; Hillebrand 2004a), time periods (Stehli et al. 1969; Silvertown 1985; Crane & Lidgard 1989; Crame 2001; Mittelbach et al. 2007; Powell 2007) and have inspired many hypotheses to explain their origins (e.g. Dobzhansky 1950; Fischer 1960; Pianka 1966; Rohde 1992; Rosenzweig 1995; Gaston & Blackburn 2000; Mittelbach et al. 2007).
Despite their extensive occurrence and the potential influence of many contributing factors, analyses that go beyond support for the qualitative prediction that species diversity should decrease with increasing latitude have been rare (Currie et al. 1999; Willig et al. 2003). There is currently much interest in understanding the combined influence of ecological and evolutionary factors on species diversity gradients (Ricklefs 2004; Jablonski et al. 2006; Harrison & Cornell 2007; Roy & Goldberg 2007). However, notwithstanding these recent syntheses, the contributions of short term and small spatial scale processes to the establishment and perpetuation of such diversity gradients – specifically immigration and local extirpation – remain largely unknown (Harrison & Cornell 2007). Despite this shortfall in understanding, these local and regional influences may be critical to the dynamics of current and future LDG, and their respective ecosystems as climate change and direct anthropogenic disturbances have differential effects on species and assemblages at different latitudes (Frank et al. 2006, 2007; Harley et al. 2006).
Most studies of LDG to date have focused on their origins (e.g. Dobzhansky 1950; Fischer 1960; Rohde 1992; Rosenzweig 1995; Mittelbach et al. 2007) presumably in the belief that knowledge of LDG origins alone would be sufficient to explain their existence. However, mere knowledge of the origins of LDG is likely to be sufficient to explain contemporary patterns only if these patterns and the factors responsible for their establishment and perpetuation remain near some equilibrium through time. In his review of potential mechanisms underlying LDG, Pianka (1966) recognized that the assumption of a fixed upper limit to the number of species within a habitat is implicit within analyses of static LDG patterns based on cumulative species diversity and without this assumption, analyses of LDG must consider the unique histories of each area. Subsequent analyses of terrestrial and marine diversity gradients, generated using the fossil record, have demonstrated that over long time intervals (103–108 years) species diversity does not remain constant. Indeed, at these temporal scales, LDG often display temporally dynamic slopes [e.g. Silvertown 1985; Crane & Lidgard 1989; Crame 2001; Powell 2007; but see Haskell (2001)].
What remains unknown is whether contemporary LDG display similar temporal dynamics or, alternatively, whether they satisfy the assumption of unchanging species diversity on short time scales (100–102 years). Recent evaluations of species diversity patterns have both explicitly recognized the role of history and found little general support for stable limits to local species diversity (Ricklefs 2004). However, there are multiple instances of unchanging patterns of species richness within sites despite changing environmental conditions, leading to the alternative interpretation that species richness is often regulated within narrow bounds (Brown et al. 2001). As noted by Rex et al. (2000), however, most LDG studies are based on observations averaged over many years and large areas due to cumulative data rather than time series. This averaging inevitably leads to oversimplified depictions of reality and may contribute to the apparent difficulty in identifying and quantifying factors that contribute to the establishment and maintenance of LDG (Pianka 1989; Rex et al. 2000). An associated consequence of these simplifications is that patterns of monotonic increases in species number through time across latitudes cannot, on their own, resolve the temporal dynamics of the species diversity patterns underlying them.
If, indeed, species diversity varies within habitats over short time intervals, then the assumption of fixed limits to species numbers will not be satisfied. Under such circumstances, contemporary LDG would be expected to display temporal variation (change in slope, intercept, shape, etc.). In short, history matters. Therefore, a full understanding of the origins and dynamics of LDG will require that the factors contributing to their modification be identified and quantified independently of those that lead to their establishment. Evaluation of the temporal variability within LDG requires both: (i) a large data series having sufficient resolution to detect patterns (Rex et al. 2000) and (ii) a macroecological perspective that incorporates temporal variation in environmental conditions, in order to test whether large-scale properties of assemblages respond as expected (Brown 1995; Kerr et al. 2007).
In this paper, we incorporate data that satisfy both of these requirements to explore the temporal variability of a contemporary Northwest Atlantic LDG. We do so by drawing on more than three decades of annual fishery-independent marine fish surveys and corresponding environmental data (Fig. 1). These data span three of 64 global large marine ecosystems (Sherman et al. 2005). The shelf circulation in the region is dominated by equatorward advection of cold waters of Arctic origin; exchanges with deeper offshore waters contribute significantly to water mass properties (Loder et al. 1998). Consequently, a distinct poleward decline in surface and bottom water temperatures occurs within the area investigated (Fig. 2a). The northern region features annual 0–200 m temperatures of 0–5 °C with a weak latitudinal gradient, while across an equal latitudinal range in the south, the gradient in temperature is strong, ranging from 5 to 20 °C (1, 2). Within this oceanographic context, Macpherson (2002) identified temperature as the strongest correlate of benthic species numbers in evaluations of Atlantic latitudinal diversity gradients. Further, using Macpherson’s (2002) marine fish data, Frank et al. (2007) showed that the conspicuous differences in latitude-specific patterns of species numbers between the eastern and western North Atlantic were well matched to average water temperatures. Previous marine studies in the northern hemisphere have also reported static LDG based on cumulative data from diverse taxa and have identified spatial differences in water temperature [e.g. Fischer 1960; Rohde 1992; Angel 1993; Roy et al. 1998; Macpherson 2002; but see Rex et al. (2000)] and the boundaries of multiple water masses (Angel 1993; Macpherson 2002; Woodd-Walker et al. 2002) as leading causes. Global analyses of marine zooplankton (Rutherford et al. 1999) and large pelagic fishes (Worm et al. 2005) have also identified water temperature, not latitude, as the strongest correlate of species diversity. Additionally, temporal variations in marine water temperatures are associated with changes in diversity in contemporary local studies (Attrill & Power 2002; Danovaro et al. 2004) and fossil assemblages (Hunt et al. 2005; Powell 2007). Given these strong associations between spatially and temporally variable water temperatures and marine species diversity at multiple scales, we opted to examine interannual LDG variation in the context of a dominant climate signal, the winter North Atlantic Oscillation (NAO) index, which is known to alter continental shelf bottom water temperatures (Petrie 2007).
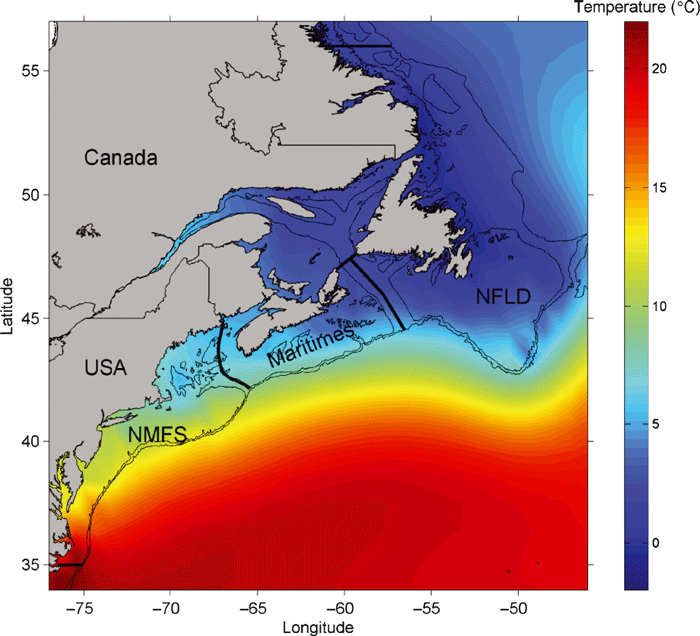
Map of the Northwest Atlantic showing the boundaries (heavy black lines) of the three data sources from 35 to 55 °N where the 27 224 samples were collected: National Marine Fisheries Service, USA (NMFS); Department of Fisheries and Oceans, Canada (DFO) Maritimes Region (Maritimes); DFO Newfoundland and Labrador (NFLD). Colour scale indicates the 0–200 m annual average water temperature. Thin black lines offshore indicate the 200 and 1000 m isobaths.
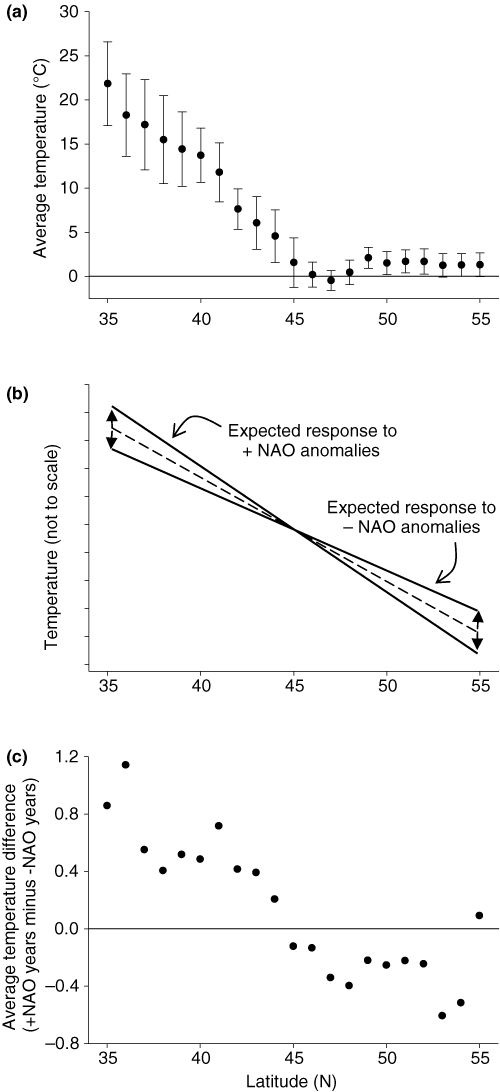
(a) Average bottom water temperatures (°C; ± SD) per degree of latitude based on 25 339 samples from the trawl survey database. (b) Schematic relationships of the expected shelf bottom water temperature responses to the sign of the winter North Atlantic Oscillation (NAO) anomaly [simplified from Petrie (2007)]. An interannual average temperature gradient (dashed line) and two distinct spatially variable responses to +NAO or −NAO anomalies (solid lines) are illustrated. (c) Average difference in bottom water temperatures (°C) per degree of latitude between years in which the NAO anomaly was positive and years in which the NAO anomaly was negative. Temperatures are from data used in (a).
Interannual variations in the sign and magnitude of the winter NAO index, which we take as the December–February sea level atmospheric pressure difference (mb) between Ponta Delgada, Azores and Akureyri, Iceland, have been repeatedly shown to alter sea surface temperatures (Hurrell & Dickson 2004) and the abundance and distribution of marine populations (Ottersen et al. 2001, 2004; Attrill & Power 2002; Drinkwater et al. 2003). Additionally, the sign of the annual NAO anomaly (relative to the 1971–2000 mean) is now known to have strong, opposite influences on Northwest Atlantic shelf bottom temperatures northeast and southwest of c. 45 °N (Petrie 2007). Positive NAO anomalies, associated with cold, windy conditions over the Labrador Sea, induce lower than average temperatures in the cool northern waters and higher than average temperatures in the warm southern waters, thereby setting up conditions for maximum latitudinal dissimilarities in temperature (Petrie 2007; Fig. 2b). During negative NAO anomaly years, corresponding to milder, less windy conditions over the Labrador Sea, relative warming in the north and cooling in the south act to reduce temperature differences across latitudes (Petrie 2007; Fig. 2b).
If latitude-specific marine fish species diversity is correlated with and responds to temperature differences on the same time scales, we predict that the LDG should be steeper during periods when temperature gradients are maximized (+NAO anomalies), relative to periods when temperature gradients are minimized (−NAO anomalies).
Our analyses support this prediction and, for the first time, demonstrate that a contemporary temperate LDG exhibits a dynamic pattern – caused by consistent shifts near the boundaries of many species’ geographic distributions – in response to atmospherically driven environmental variability across a broad region. We also find conspicuous, temporal scale dependent, differences in LDG slopes when the data are analysed using cumulative vs. annual species diversity values. Given these differences, and the fact that annual dynamics are concealed within the cumulative LDG values, we suggest that the pattern revealed by cumulative analyses is an incomplete descriptor of latitudinal diversity gradients. These findings demonstrate the importance of considering environmental influences that can modify large spatial scale diversity patterns on short time scales and have implications for the responses of large-scale diversity gradients and their related ecosystems to regional or global change.
Materials and Methods
Annual fishery-independent bottom trawl survey data from three sources that collectively sampled 21° latitude of the Northwest Atlantic continental shelf (Fig. 1) were analysed. These surveys employ a random sampling design within depth-stratified areas, with sampling intensity generally proportional to the stratum size, to estimate marine fish abundances and distributions (Doubleday 1981; Doubleday & Rivard 1981; Chadwick et al. 2007). Analyses were restricted to a continuous group of 31 years in which sampling occurred across the region (1973–2003).
The United States National Marine Fisheries Service (NMFS) conducts fall (September–December) surveys at least as far south as 35° and north to 44° (Azarovitz 1981). We included only samples to 35 °N, as this latitude was the southern limit sampled in all 31 years. Data from the Scotian Shelf and Bay of Fundy (42–47 °N) were from July to August surveys conducted annually by the Department of Fisheries and Oceans (DFO), Maritimes Region, Canada (Doubleday 1981; Shackell & Frank 2003). Data for the northernmost latitudes (42–55 °N) derive from surveys conducted annually from June to December by the DFO, Northwest Atlantic Fisheries Center (NFLD; see Fig. 1). Since 1995, NFLD surveys used a trawl with smaller mesh towed for a shorter duration (Chadwick et al. 2007). These changes mainly affect the abundances of fish species collected, though we generally did not weight species by their representative abundances in our analyses, except for the purposes of computing diversity estimators (described below). As in previous analyses (Mahon et al. 1998; Frank et al. 2006), no corrections were made for different vessels or gear types among or between regions or years due to the lack of intercalibration data (Mahon et al. 1998). Mahon & Smith (1989) have also demonstrated that species composition can vary as much among replicate samples using the same vessel and gear as among different vessels and gears.
Within all three surveys, we limited our analyses to samples taken from the continental shelf: from ≤ 200 m depth south of 48 °N; and from ≤ 350 m depth north of 47 °N where the continental shelf is deeper. The interannual variations in LDG are present even if all latitudes are sampled at ≤ 200 m depths. Given the varying width of the continental shelf across this region (Fig. 1), annual sampling effort generally peaked at mid latitudes (Fig. S1). To facilitate calculations and comparisons of cumulative numbers of species, samples were combined into 1° latitudinal bins (e.g. 50.00–50.99 °N latitude considered ‘50 °N’). Geographic position, depth, bottom water temperature (from 93% of all samples) and abundances and weights of fish were recorded for each sample. Our analyses included only fish identified to the species level, with the exception of redfish (Sebastes spp.), a genus that contains up to three species within the sampled region (Mahon et al. 1998). Three species were excluded from the analyses [Clupea harengus L. herring, Scomber scombrus L. mackerel, Mallotus villosus (Müller) capelin], because representative data for these species were available only for latitudes < 42 °N. There were 27 224 samples, which captured > 25 million individuals from no less than 426 species (Froese & Pauly 2008) within 135 families (Table S1).
We report the number of species observed per year per degree latitude as ‘species diversity’ (Rosenzweig 1995), which is considered distinct from ‘species richness’ (Gotelli & Colwell 2001). One goal was to use annual samples to construct LDG for comparison among years. However, species diversity did not reach an asymptote for certain year-latitude combinations (Fig. S2) and therefore annual LDG parameters could be influenced by sampling intensity. To address this concern, we calculated three additional diversity estimators for all latitude and year combinations: (i) sample-based rarefaction (which accounts for heterogeneity among samples) to the level of an individual sample (Gotelli & Colwell 2001); (ii) the classic Chao2 estimator (Colwell 2006), and; (iii) Fisher’s α (Fisher et al. 1943; Rosenzweig 1995), using EstimateS 8.0 software (Colwell 2006). The dynamics of annual LDG based on these measures were then compared with the patterns generated using observed species diversity.
As with other macroecological studies, autocorrelation between variables may inflate Type 1 statistical errors and could lead to erroneous conclusions if not incorporated explicitly into analyses. We therefore applied the formalism developed by Bayley & Hammersley (1946), Chelton (1983), and Bretherton et al. (1990) in order to calculate the effective number of degrees of freedom (Neff) prior to statistical tests on autocorrelated data, and when necessary we have replaced temporal increments with spatial increments. Since the NAO itself induces spatially autocorrelated patterns (Fig. 2c), we recognize that these Neff corrections provide very conservative test statistics. Therefore, as suggested for strong macroecological analyses (see Brown 1995; Kerr et al. 2007), our analyses rely not only on evaluation of null hypotheses but also on a pseudo-experimental approach that evaluates support for predictive, mechanistic hypotheses that in our system link temporal variation in climate and oceanographic changes to ecological responses.
To identify those species that contributed to the observed interannual variations in LDG slopes, we calculated, within each latitude, the difference in frequencies of occurrence for each species between +NAO anomaly years and −NAO anomaly years. Species with ≥ 20% difference in occurrence in at least one degree latitude were assessed, together with a quantification of their relative frequencies of occurrence at all sampled latitudes over the 31-year sampling period.
Given the large-scale effects of the NAO on bottom water temperatures (Fig. 2; Petrie 2007), and its influence on annual variability in species diversity, changes in species diversity were examined in relation to annual variation in the NAO rather than variation in local water temperatures the data for which were restricted to the fisheries surveys. However, because bottom water temperatures were available for virtually all survey stations, we also directly investigated the influence of the winter NAO signal on summer-fall bottom water temperatures across latitudes.
Results
Shelf bottom water temperature variability
Average bottom water temperatures decreased nonlinearly with increasing latitude (Fig. 2a). This pattern illustrates both the mean state of a dominant physical variable and the extensive range of temperatures. This 31 year mean may, however, be an inadequate descriptor of annual temperatures because opposing states of the winter NAO are expected to influence bottom water temperatures in opposite directions at the limits of the sampled range (Fig. 2b). Bottom water temperature differences during periods of opposing NAO state ranged from positive in the south to negative in the north (Fig. 2c) with a range of c. 2 °C.
Cumulative latitudinal diversity gradient
As expected, when data from all years were combined, cumulative species diversity declined with increasing latitude (Fig. 3, inset). Linear regression removed 84% of the variance and provided a single slope (−7.5) for comparison to a previous study (Macpherson 2002). However, because of the evident curvature in this cumulative gradient, we fitted a second-order regression that accounted for an additional 12% of the variation. Moreover, per degree of latitude, the cumulative number of species was strongly correlated (r = 0.97) with the average temperature (Fig. 2a). Despite large differences in the numbers of samples with latitude (Fig. S1), cumulative species diversity was not related to latitude-specific sampling effort (R2 = 0.04, n = 21, P = 0.36) and the latitude with the highest cumulative number of species had the lowest total number of samples.
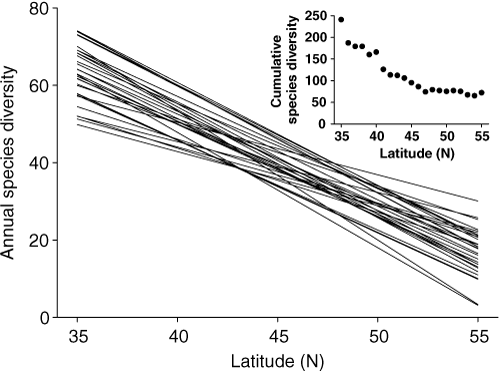
Solutions to all 31 annual linear regressions of species diversity per degree latitude (27 with P ≤ 0.05; average Neff = 9.6), showing variation in the slopes and intercepts of these latitudinal diversity gradients (LDG). Among years, latitude accounted for an average of 78% of the variation in annual observed species (range 48–90%). Inset: Cumulative species LDG using data from all 31 years.
The cumulative species diversity and the long-term average bottom temperatures vary similarly with latitude and at long spatial scales that indicate a high degree of autocorrelation. This is evident in the data series themselves and in their spatial autocorrelations. We calculated the auto- and cross-correlations to lags of 8° of latitude. This indicated that that correlation (0.97) between cumulative species diversity and long-term temperature has few degrees of freedom, as the effective number of degrees of freedom (Neff) was converging at c. 1.6.
Annual latitudinal diversity gradients
The form and magnitude of the static, cumulative LDG constructed using data collected over the entire survey period bore little resemblance to the dynamic LDG calculated using annual data (Fig. 3). In contrast to the cumulative LDG, all but one of the 31 annual LDG were well fit by linear regression. The average difference in explained variation between linear and second-order regressions was 3%; the maximum was 14%. Latitude accounted for an average of 78% of the variation in species diversity each year when assessed with linear regression (range 48–90%). After accounting for autocorrelation by calculating the Neff (average 9.6) for each annual gradient, 27 of 31 LDG were significant at the α ≤ 0.05 level. The four that were not had shallow slopes, occurred during −NAO years and had Neff < 6. Since annual species diversity values were strongly correlated with latitude in all years and excluding four −NAO years (which may be expected to have shallow slopes) could bias against detecting NAO-related patterns, all 31 annual LDG were retained in subsequent analyses. In addition to exhibiting shallower slopes (average −2.3) relative to the cumulative pattern (−7.5), annual LDG varied interannually (Fig. 3). Moreover, their slopes and estimated species diversity at 35 °N were negatively correlated (r = −0.81; Fig. 3).
Annual LDG relationship to NAO anomalies
The annual estimated Neff values were used to calculate the 95% confidence limits of the slopes from annual LDG regressions. These confidence limits were combined with the mean annual slopes to obtain 1000 randomized values of the slopes for each year. When these annual LDG slopes were grouped according to the sign of NAO anomalies, positive NAO anomalies were found to be associated with steeper species gradients (average slope −2.57 ± 0.051 SE) (Fig. 4). In contrast, LDG slopes associated with negative NAO anomaly years were significantly shallower (average −2.04 ± 0.049 SE). Of 1000 averages across all years grouped by NAO sign, in only 19 cases was the average LDG slope steeper in negative NAO anomaly years. In addition to these associations between LDG slope and NAO sign, annual LDG slopes from summer-fall surveys were negatively correlated (r = −0.45, Neff = 17, P < 0.07) with the strength of the NAO anomaly during the preceding winter (Fig. 5). On average, therefore, the steepest LDG occurred when NAO anomalies were highest, and the shallowest slopes occurred when the anomalies were lowest. Correspondingly, the steepest LDG slopes were associated with bottom water temperatures that differed maximally between the northern and southern limits of sampling and the lowest slopes were associated with minimal differences in water temperatures over this range (Fig. 2). The same pattern of steeper LDG slopes during years with positive NAO anomalies also occurred when species diversity was calculated using rarefaction, the Chao2 estimator, and Fisher’s α based on annual slope estimates (Fig. S3). The Chao2 estimator did produce steeper annual LDG slopes than those observed (Chao2 annual average −3.4; range −1.9 to −5.6; Fig. S3); these slope estimates remained below the cumulative LDG slope stated above and largely paralleled the observed annual LDG slopes. Given these similarities in diversity responses to the NAO, our subsequent analyses that rely on both the numbers and identities of observed species, and our interest in comparing our results to studies that reported observed species numbers – our remaining analyses and interpretations focus on patterns from LDG generated using observed species diversity.
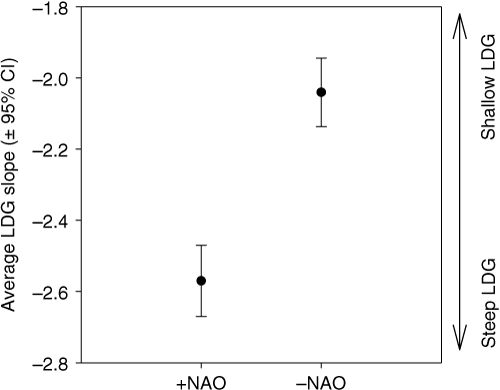
Average latitudinal diversity gradient (LDG) slopes (± 95% CI) based on years in which the sign of the winter North Atlantic Oscillation (NAO) anomaly was either positive (+NAO) or negative (−NAO). Confidence intervals are based on 1000 randomized values of the LDG slope calculated for each year.
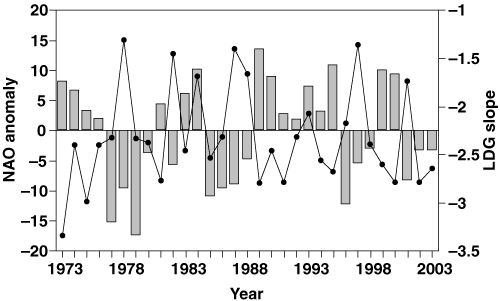
Annual North Atlantic Oscillation (NAO) anomalies (bars) and latitudinal diversity gradient (LDG) slopes (lines). Annual LDG slopes and NAO anomalies are negatively correlated (r = −0.45, Neff = 17, P < 0.07).
The annual LDG slopes based on observed species diversity varied c. 2.5-fold over the 31 years investigated, ranging from −1.31 to −3.34 (Fig. 6). This range suggests an among-year difference of 42 species over the 21° of latitude investigated. As expected, given their apparent response to NAO induced changes in bottom temperature, southern and northern patterns in observed species diversity generally changed in opposite directions with changing slopes; southern diversity increased and northern diversity decreased with increasing slopes. Mid-latitude species diversity showed no systematic relationship with changing LDG slope (Fig. 6). The differences in observed species diversity at the southern and northern limits of the LDG (35 °N vs. 53 °N) during 1973, which had the steepest annual LDG gradient was 50 (Fig. 6). In contrast, in 1978, the year with the shallowest gradient, this difference was 26 species.
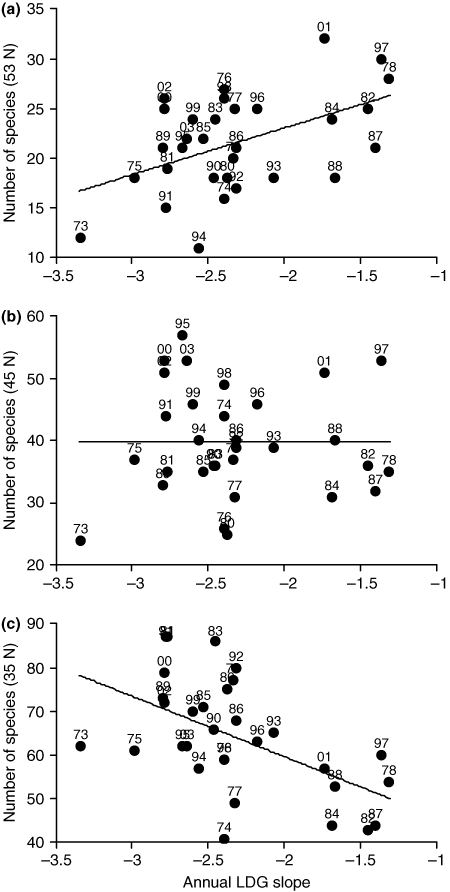
Annual observed fish species plotted against the slopes of 31 significant, annual latitudinal diversity gradients (LDG) from: (a) the northern limit sampled in all years (53 °N); (b) the midpoint of the sampled range (45 °N), and; (c) the southern limit of the sampled range (35 °N). Lines show best-fit solutions within latitudes; labels above each point indicate last two digits of sample year.
Changing latitudinal distributions and the NAO
In total, 133 species showed at least a 20% difference in frequencies of occurrence within at least one degree of latitude between years with opposing NAO states (Fig. 7). The majority of these species occurred commonly somewhere within the sampled range (≥ 50% frequency of occurrence over all surveyed years). Many of the differences in occurrence between years with +NAO and −NAO anomalies were near the edges of the observed geographic distributions of species rather than within the core of their ranges (Fig. 7). Furthermore, parallel to the changes in temperature between years with opposing NAO states (Fig. 2c), there was a negative correlation (r = −0.54) between latitude and the proportion of species showing higher frequencies of occurrence during +NAO anomaly years. In southern latitudes (i.e. 35–38 °N) most species with ≥ 20% differences in frequency of occurrence were observed more frequently during years with +NAO anomalies, while in northern latitudes (i.e. 50–55 °N), most species with consistent differences in occurrence were observed more frequently during −NAO anomaly years (Fig. 7). These results strongly suggest that the mechanism underlying the LDG slopes vs. NAO anomaly relationship involves systematic changes in the latitudinal distributions of 100+ species.
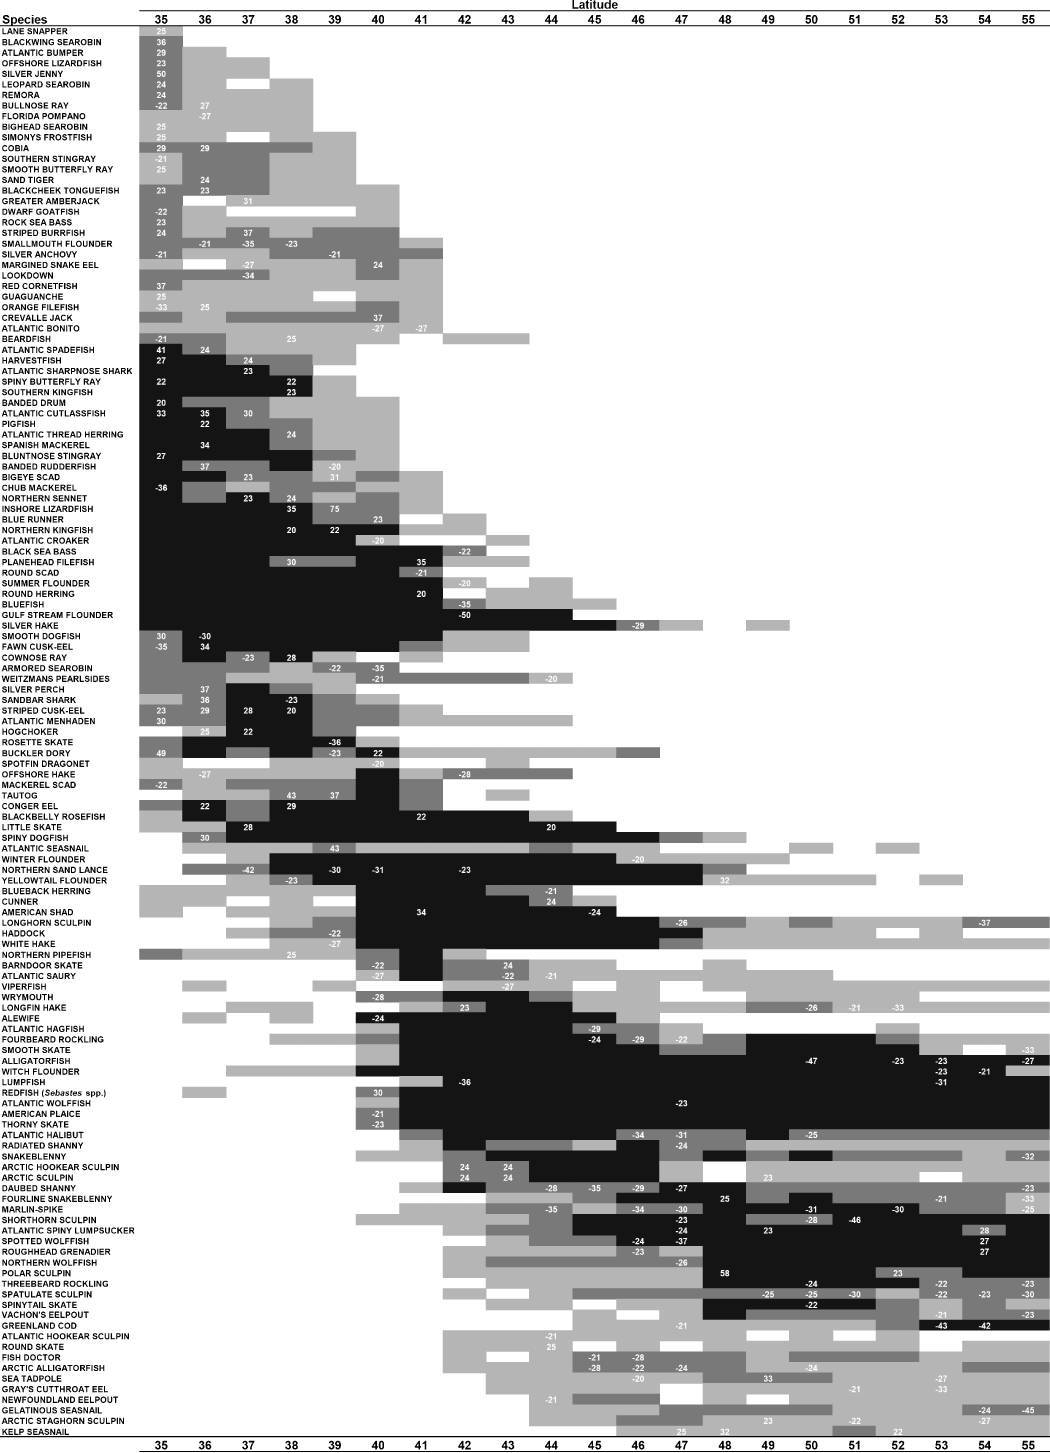
Frequency of occurrence patterns of 133 fish species selected on the basis of having a ≥ 20% difference in frequencies of occurrence between years with opposite North Atlantic Oscillation (NAO) anomaly states. White text indicates the percentage difference in frequency of occurrence, with positive or negative values indicating higher frequency of occurrence during years characterized by +NAO or −NAO anomalies, respectively. Cell shading indicates the species’ frequency of occurrence over the entire 31 year sampling period per degree latitude: black (), species occurred in ≥ 50% of the sampled years; dark grey ( ), species occurred in ≥ 25% and < 50% of the sampled years; light grey (
 ), species occurred in > 0 and < 25% of the sampled years. White cells indicate that the species was not found. Scientific names are listed in Table S1.
Discussion
Clearly, LDG can and do exhibit interannual dynamics. Moreover, local species diversity can and does respond rapidly to dominant large-scale climate forcing, which, in this case, induced a consistent spatial variation in water temperatures. The strong correlation between the cumulative species per latitude (Fig. 3, inset) and the average bottom water per degree latitude (Fig. 2a), derived by combining data from all years, demonstrates the apparent tight coupling of physical and biological gradients when accumulated or averaged over decades. The cumulative LDG we derived also is comparable to that reported by Macpherson (2002) in his analysis based on published range limits. Within a comprehensive analysis of Atlantic pelagic and benthic taxa across both hemispheres, Macpherson analysed fish species numbers within 5° latitudinal bands on the Northwest Atlantic continental shelf and slope (100–1000 m depths). While his analyses covered a wider latitudinal range, within the geographic range we sampled (35–55 °N) linear regression accounts for 92% of the variance in Macpherson’s (2002) decline in species numbers with latitude with a slope of −7.7 and a prediction of 201 species at 35 °N, which compares with our calculated slope of −7.5 and prediction of 189 species at 35 °N. Hence, despite large differences in data sources, sampling intervals, depth ranges and spatial scales, very similar static diversity gradients emerge for the continental shelf and slope of the Northwest Atlantic.
However, although similar in magnitude, these cumulative, static LDG smooth and obscure the temporal variation inherent in LDG and exhibit slopes that are markedly different from the dynamic, annual LDG we report. In contrast to the best-fit cumulative pattern, annual LDG vary greatly, have consistently shallower slopes and are generally linear.
Given that cumulative LDG are based on monotonically increasing species lists with no turnover, such atemporal descriptions of diversity may provide an overestimate of the numbers of co-occurring species at any time (Fisher et al. 1943; Briggs 1974; Rosenzweig 1995; Brown et al. 2001; Hurlbert & White 2005). On the basis of the cumulative data, the LDG cumulative slope we estimated (−7.5, assuming linear regression) was more than twice the largest annual slope observed (−3.3) and larger than the largest annual Chao2 LDG slope estimate (−5.6). These differences in cumulative and annual slopes demonstrate a strong dependence of the magnitude of LDG on sampling frequency. This result is analogous to the effect of spatial scale on LDG slopes (based on comparisons of disparate cumulative LDG). In that case, the gradients examined at regional spatial scales generally had steeper slopes than those based on local spatial scales (Hillebrand 2004a,b).
While annual slopes were comparatively linear and shallow, their variations among years were large. This feature was not a result of inadequate sampling in time and space, because other diversity estimators produced similar patterns of LDG variability in relation to NAO sign and strength (Fig. S3). What remains unknown is whether such annual LDG variations occur in, and are comparable in magnitude and sign, in contemporary terrestrial ecosystems, where to date, they remain largely unexplored (Willig et al. 2003). Given the lack of contemporary data, we compared the range of the interannual variations in LDG slope we observed to two disparate marine and terrestrial data series from the fossil record, for which temporally resolved data are available. Those studies documented LDG responses to long-term climate variation.
Silvertown’s (1985) analyses of woody plant diversity from Europe showed that among 13 recent 1000 year intervals sampled across a 30° latitudinal range following the retreat of glaciers, LDG slopes generally became steeper through time and varied from −0.42 to −2.28. On larger spatial and temporal scales, Powell (2007) described how numbers of fossil brachiopod genera changed before, during and after a c. 35 million year ice age within the late Palaeozoic (359–251 Ma) across a 120° latitudinal range. Within this c. 100 million year span, the slope of the northern hemisphere LDG varied from −1.3 to −3.2 (Powell 2007). Contemporary marine fish LDG slopes in the Northwest Atlantic varied from −1.31 to −3.34 during the course of 31 years (Fig. 6). When the results of these three studies are evaluated over an arbitrary 10° range of latitude, they all yield very similar estimates of differences in the diversity of taxa (18.6–20.3) when extreme LDG slopes are compared. This outcome is remarkable given the wide range of temporal scales, taxa resolutions, geographic ranges, and mechanisms underlying these diversity changes (e.g. from speciation to local colonization) involved in these LDG responses to climate variation.
Perhaps the oldest hypothesis offered as an explanation for spatial gradients in species diversity is variations in available energy (Hawkins 2001), and as described by Clarke & Gaston (2006)‘energy’ may refer to one of at least three different forms: (i) thermal energy; (ii) chemical energy; or (iii) radiation energy. Recently no less than nine different interrelated mechanisms have been identified that relate species diversity to energy availability (Evans et al. 2005). Temperature gradients have also been frequently hypothesized to be a key mechanism underlying the origins of LDG [Fischer 1960; Turner et al. 1987, 1996; Rohde 1992; Roy et al. 1998; Allen et al. 2002; but see Rex et al. (2000)]. Range limitation due to physiological tolerance (Evans et al. 2005), a hypothesis consistent with the changes in ocean temperature that are known to be induced by the NAO, appears to be the mechanism underlying the interannual variability we report (Fig. 7). Given that the response of local oceanographic conditions to the NAO varies spatially (Hurrell & Dickson 2004; Petrie 2007), so too should the species responses (Drinkwater et al. 2003).
Individual marine fish species are known to occur within temperature limits that are physiologically set (Brett 1970). If their geographic distributions cannot respond sufficiently rapidly to changing oceanographic conditions, the consequences are potentially lethal. For example, the widely documented 1882 mortality of hundreds of millions of ‘warm water’ tilefish (Lopholatilus chameleonticeps) and deep-sea robin (Peristedion miniatum) at c. 39–40 °N on the edge of the Northwest Atlantic continental shelf occurred during a period of exceptionally strong negative NAO, and correspondingly very low water temperatures that fell below the species’ lower lethal temperature limits (Marsh et al. 1999). These uncharacteristic and extreme results demonstrate one mechanism through which the NAO could influence local species diversity. Many temperate marine fish do, however, appear to alter their geographic ranges quickly in response to more typical and gradual temperature changes (Colton 1972; Briggs 1974; Murawski 1993; Frank et al. 1996; Ottersen et al. 2004; Perry et al. 2005; Worm et al. 2005; Harley et al. 2006; Hiddink & ter Hofstede 2008). The strong interannual variations in species diversity we report suggested that changes in geographic or depth distribution – changes that clearly operate more rapidly than potential changes due to population dynamics – contributed to the interannual LDG variability we report.
Further support for this range limitation/extension hypothesis is found in the fact that many species’ changes in distribution during years with opposite NAO signs occurred near their observed geographic boundaries rather than within the centre of their range (Fig. 7). This pattern suggests that the differences are due to species’ responses to temperature changes rather than the inability of annual sampling within latitudes to detect species, as the latter would be expected to show differences at high or low latitudes where annual sampling intensity was lowest (Fig. S1). This was not the pattern that emerged (Fig. 7), as even within latitudes intensively sampled, such as 40 °N that had ≥ 60 samples per year, some widespread species with northern distributions (e.g. Hippoglossoides platessoides American plaice, Amblyraja radiata thorny skate) had higher frequencies of occurrence during years with −NAO anomaly conditions, which would lead to colder conditions at 40 °N (Fig. 2). In contrast, the majority of the species with southern distributions, species which presumably occur more regularly in the warmer waters south of the sampled region, appeared more frequently within the sampled region during +NAO anomaly years, i.e. warmer conditions in the south (e.g. 29 of 35 species at 35 °N). The changes in geographic distributions illustrated in Fig. 7 are consistent with previous analyses that have demonstrated colonization of large areas in the Northwest Atlantic during altered temperature conditions (Frank et al. 1996) and North Sea species’ latitudinal boundaries shifting up to hundreds of kilometres per 1 °C change in bottom water temperature (Perry et al. 2005).
When two or more competing mechanisms may similarly influence patterns of species diversity, it is important to test each of them in order to eliminate those without explanatory power (Pianka 1966; Roy et al. 1998; Currie et al. 1999). In addition to the influence of the NAO on water temperatures and on species geographic distributions, chemical energy from changing productivity (Clarke & Gaston 2006) can also influence species diversity and may vary systematically with NAO forcing. We examined two data sources that provided annual estimates of primary productivity over large areas of the Northwest Atlantic and spanned a minimum of 10 years each to address this possibility (Fig. S4). Neither the greenness index from the long-term continuous plankton recorder survey, nor satellite derived ocean colour data from 13 areas along the Northwest Atlantic coast [data and sources described by Frank et al. (2006)] revealed any consistent influence of the NAO on spatial or temporal patterns of primary productivity (Fig. S4). Therefore, in addition to the potential role of temperature in the origination of LDG (Fischer 1960; Turner et al. 1987, 1996; Rohde 1992; Roy et al. 1998; Allen et al. 2002), we conclude that variation in temperature, but not productivity, acts to modify LDG on shorter time scales through changing species distributions and therefore species numbers within latitudes.
Turner et al. (1987) provided suggestive evidence that a decrease in numbers or range sizes of butterflies in southern England were associated with a temperature decrease of c. 0.8 °C between the eighteenth and nineteenth centuries. In contrast to the single temporal contrast described by Turner et al. (1987), the single die-off investigated by Marsh et al. (1999), and the steady increase in North Sea species numbers with increasing temperature (Hiddink & ter Hofstede 2008), the interannual variability in the sign and strength of the NAO and the documented responses of water temperature to their forcing (Petrie 2007) allowed us to perform extensive spatial analyses of the responses of annual LDG. As a mechanism driving temporal variation in LDG, we have presented evidence that deviations from ‘average’ summer-fall water temperatures – induced by prior winter NAO anomalies – play a role by altering species geographic distributions. The reality is that the magnitudes of these temperature variations increase towards the extremes of the sampled region and do so in opposite directions (Fig. 2c). This demonstrates not only that the influence of winter NAO anomalies persist throughout the following year and is therefore not the product of averaging temperatures across the entire year (Petrie 2007), but also that these temperature differences are apparent even after averaging within latitudinal bins, some of which contain broad longitudinal areas (Fig. 1).
Previous research has demonstrated the influence of NAO on local water temperature and strong associations between NAO strength and the abundance, growth, and species diversity of juvenile fish among years at a single location (Attrill & Power 2002). The research we report expands these observations by demonstrating associations between NAO and gradients in species diversity across a wide range of latitudes, [the sign of annual NAO anomalies being associated with the average magnitude of the annual LDG slopes (Fig. 4)]. Additionally, LDG slopes are negatively related to the strengths of NAO anomalies (Fig. 5). Taken together, these two interdependent results provide strong support for the hypothesis that NAO induced modifications of the continental shelf temperature field shape this macroecological pattern. Two related analyses provide further support for the role of changing water temperatures in defining large-scale LDG patterns in the Northwest Atlantic. First, the slopes of simplified, annual temperature gradients (using linear regression) are negatively correlated (r = −0.55) with the magnitude of the annual NAO anomalies (Fig. S5). This, too, demonstrates the influence of winter NAO on summer-fall temperatures as expected and outlined in Fig. 2. Second, in addition to the link between NAO and annual temperature gradients, the slopes of the temperature gradient are positively correlated (r = 0.59) with the slopes of the LDG (Fig S6), providing direct evidence that, on average, steep LDG occur during years characterized by steep temperature gradients. Taken together, these links between NAO, water temperatures and species diversity variation provide a novel contribution to the relatively unexplored field of community- and ecosystem-level responses to climate variation (Harley et al. 2006). In addition, given that the potential response of the NAO to climate change has been the subject of extensive investigations, these strong associations between NAO and LDG have important implications for the development of adaptive management strategies applied to marine fishes in the light of climate change.
Current general circulation models predict that the NAO, in response to increased levels of greenhouse gases, will have a long-term positive trend (Gillett et al. 2003). Should this occur and the underlying oceanic responses remain similar to its current response, the LDG in the Northwest Atlantic is likely to intensify. And this, in turn, could temper the decrease in LDG slope that may result from poleward geographic shifts in distribution (e.g. Perry et al. 2005; Hiddink & ter Hofstede 2008) in response to global warming.
However, over longer periods the relationship between oceanographic conditions and NAO can also vary (Polyakova et al. 2006). A spectral analysis of successive 64-year blocks of NAO anomalies [1895–2005 (Fig. S7)] reveals that the spectrum is becoming more energetic at longer time periods (Hurrell & van Loon 1997). Indeed, this variance increased by 41% from the first to the last period investigated, with most of the increase accounted for by periods longer than c. 5 years. In addition to effects on gradients of biodiversity, the potential responses of LDG to climate change also have implications for the resilience of temperate marine fish assemblages to exploitation.
Water temperature and marine fish species numbers, strongly correlated at large spatial scales, have recently been shown to be positively correlated with resilience to overexploitation (Frank et al. 2006, 2007). Therefore, if positive NAO anomalies persist and intensify in the future, northern marine ecosystems now characterized by having relatively fewer fish species and cooler waters may see both conditions intensified (even colder temperatures and fewer species), with the consequence that their resilience to exploitation will be further diminished. A species diversity response of this type is evident from the time series examined here, as relative to years with negative NAO anomalies, during positive NAO anomaly years northern species diversity declined by c. 20% while southern species diversity increased by c. 10% (Fig. 8). It is notable that underlying the percentages in Fig. 8, extreme northern and southern species diversity changed in opposite directions by approximately five and seven species, respectively. Therefore, although the magnitude of species diversity decline was lower in the north, the greater percentage change was driven by decreases in species diversity acting within an already species poor latitude. These interactions between temperature, species diversity and resilience emphasize the potential for complex spatial responses of marine ecosystems to climate change (Harley et al. 2006).
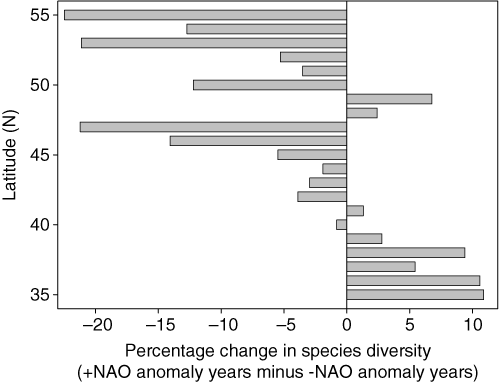
Observed percent change in average species diversity per degree of latitude between years with opposite states of North Atlantic Oscillation (NAO) anomaly. Differences between +NAO anomaly years and −NAO anomaly years are relative to the average species diversity across all years. Greater percentage declines in the north relative to percentage increases in the south illustrate the asymmetric influences of the NAO on marine fish assemblages across this region.
The reported temporal variations in LDG and the differences in form between annual and cumulative patterns we report have implications for monitoring biodiversity. If individual, extensive censuses are relied on to provide a view of diversity, the apparently static patterns generated will be of limited use, as they will not be able to reveal temporal dynamics, but instead provide information on the potential range of species observable across a region. As the current results demonstrate, monotonic collections in the form of cumulative LDG not only display a different slope relative to annual patterns, but also conceal important latitude-specific variability in species diversity that contributes to varying LDG slopes through time. With repeated extensive sampling, however, even if not all species are detected in each survey – as is possible in the current annual analyses – changes in observed species diversity may be detectable, as reactions within this marine system appear rapid, widespread, and of sufficient magnitude to alter the LDG from one year to the next. The need for repeated surveys is especially true for analyses of marine diversity dynamics, where species are predicted to be influenced significantly in the coming years due to climate change (Harley et al. 2006). However, a complete census of fish diversity, for example, has not been achieved based on either decades of sampling within a region (Shackell & Frank 2003), or centuries of global collections (Mora et al. 2007). Future analyses may therefore require the initiation of both intensive and extensive sampling across large spatial scales or, as in our case, the amalgamation of existing data from ongoing scientific monitoring programs (see also Angel 1993).
Conclusions
Our focus on interannual variability within LDG provides a novel view of one of the oldest macroecological patterns. By applying a pseudo-experimental approach using climate variability to test specific hypotheses (Kerr et al. 2007), this research has identified high frequency, temporal dynamics within a pattern that had previously been assumed static and documented differences in magnitude between annual and cumulative LDG. Strong evidence of relationships between LDG variability, changing geographic distributions and the NAO provides a mechanistic link via demonstrated spatially variable changes in ocean temperature, which suggests spatially complex responses of temperate marine assemblages to future climate change. Our results show that local and regional processes contribute to and rapidly modify large spatial scale patterns, thereby demonstrating the importance of variation at intermediate spatial scales, which had recently been identified as a potentially important but largely unexplored scale for LDG analyses (Harrison & Cornell 2007). Temporal dynamics should therefore be incorporated into evaluations of latitudinal diversity gradients, as factors that contribute to their origins may be different from those that maintain and modify diversity patterns.
Acknowledgements
We thank B. Branton, M. Fogarty, D. Kulka, E. Macpherson and J. Palmer for facilitating data exchange or providing data and R. Pettipas for technical assistance. M. Sinclair and the referees and editor provided many helpful comments. Funding for this research was provided by NSERC Discovery grants to K.T.F. and W.C.L. and the Canadian Department of Fisheries and Oceans.


