Gap junction-mediated calcium waves define communication networks among murine postnatal neural progenitor cells
Abstract
In the postnatal neurogenic niche, two populations of astrocyte-like cells (B cells) persist, one acting as neural progenitor cells (NPCs, B1 cells) and one forming a structural boundary between the neurogenic niche and the striatum (B2 cells, niche astrocytes). Despite being viewed as two distinct entities, we found that B1 and B2 cells express the gap junction protein connexin 43 and display functional coupling involving 50–60 cells. Using neonatal electroporation to label slowly cycling radial glia-derived B1 cells, which send a basal process onto blood vessels, we further confirmed dye coupling between NPCs. To assess the functionality of the coupling, we used calcium imaging in a preparation preserving the three-dimensional architecture of the subventricular zone. Intercellular calcium waves were observed among B cells. These waves travelled bidirectionally between B1 and B2 cells and propagated on blood vessels. Inter-B-cell calcium waves were absent in the presence of a gap junction blocker but persisted with purinergic receptor blockers. These findings show that privileged microdomains of communication networks exist among NPCs and niche astrocytes. Such functional coupling between these two cell types suggests that niche astrocytes do not merely have a structural role, but may play an active role in shaping the behavior of NPCs.
Introduction
The adult subventricular zone (SVZ) is one of two neurogenic zones that persist in the adult brain of all mammalian species examined. The SVZ is the largest neurogenic zone and is located along the wall of the lateral ventricle beneath a layer of ependymal cells (E cells). This neurogenic region contains several cell types, including neural progenitor cells (NPCs), intermediate progenitors, neuroblasts and a specialized type of astrocytes. Both NPCs and astrocyte-like cells (also called niche astrocytes) express glial fibrillary acidic protein as well as other antigenic markers of astrocytes and are referred to under the umbrella term B cells (B1 and B2 cells, respectively) to acknowledge their shared antigenic properties (Liu et al., 2006; Mirzadeh et al., 2008; Wang & Bordey, 2008). However, they appear as distinct entities based on their location and cytoarchitecture. B1 cells exhibit their cell body beneath the ependymal layer while B2 cells are located at the SVZ–striatal border (Doetsch et al., 1997). B1 cells display epithelial properties including an apical process intercalated between ependymal cells and a basal process ending on blood vessels. The basal processes are of variable length depending on the proximity of the vessels to the ependyma and confer a radial glia-like morphology to NPCs (Mirzadeh et al., 2008). B2 cells display a more stellate appearance (Mirzadeh et al., 2008) although some have an elongated morphology creating a physical boundary between the SVZ and the striatum (Liu et al., 2005).
B1 cells also display intimate contacts with ependymal cells. More specifically, B1 cells and ependymal cells express one astrocytic gap junction protein, connexin 43 (Liu et al., 2006; Mirzadeh et al., 2008). Staining for connexin 43 was observed at the interface between B1–B1 and B1–E cells. It is, however, unclear whether these homotypic and heterotypic junctions are functional. It is also unknown whether B2 cells express connexins and form a functional coupling network between each other.
We thus explore whether B cells and E cells display functional gap junction coupling. We report dye coupling between B1–B1 and B1–E cells, and unexpected coupling between B1–B2 cells. In addition, connexin 43 expression is enriched in the SVZ, in particular at the striatum border where B2 cells are located. We adapted a slice preparation for calcium imaging preserving the three-dimensional (3-D) architecture of the SVZ. Using this preparation, we found that gap junction-dependent calcium waves travelled between B cells (B1–B1 and B1–B2 cells). These waves also involved propagation on blood vessels. These findings show unexpected large communication networks between B cells, including between NPCs and niche astrocytes. This suggests that these two types of B cells can exchange information as well as metabolites through their connectivity to the blood vessels. Further investigation of the role of this functional connectivity between NPCs and niche astrocytes is warranted.
Materials and methods
Mice
Research protocols were approved by the Yale University Institutional Animal Care and Use Committee. Experiments were performed in CD1 mice (Charles River Laboratories, MA, USA) and two lines of transgenic mice – human glial fibrillary acidic protein (hGFAP)-GFP mice (Jackson Labs, Bar Harbor, ME, USA) and hGFAP-tTA/TetO-MrgA1:GFP mice (noted hGFAP-MrgA1:GFP, a gift from Dr K. McCarthy, University of North Carolina at Chapel Hill, NC, USA). In the absence of doxycycline, astrocytes express green fluorescent protein (GFP) fused to the MrgA1 receptors (Fiacco et al., 2007). All experiments were performed at postnatal days (P)17–P54 in at least three mice.
Connexin 43 immunostaining
Mice were deeply anesthetized with pentobarbital (50 mg/kg). The brain was then quickly removed and placed in 4% paraformaldehyde overnight at 4 °C, then washed in 1× PBS. The next day, 100-μm-thick slices were prepared using a vibratome (Leica VTS 1000). Immunostaining was as previously described (Platel et al., 2009). Free-floating sections were blocked in TBS containing 0.1% Triton X-100, 0.1% Tween-20 and 2% bovine serum albumin and incubated in mouse anti-connexin (1 : 500; Chemicon, Temecula, CA, USA) overnight at 4 °C. After several washes in TBS containing 0.1% Tween-20, slices were incubated with a secondary antibody (Alexa Fluor series at 1 : 1000, Invitrogen, Carlsbad, CA, USA). Staining in the absence of the primary antibody did not yield any signal. Staining was replicated in at least 3–4 slices from three different mice. Z-section images were acquired on a confocal microscope (FluoView 1000) with a 20× dry objective (numerical aperture 0.75) or a 60× oil objective (numerical aperture 1.42). Images were reconstructed using Imaris 4.0 (Bitplane AG) and Photoshop CS3.
Acute brain slice preparation
Mice were deeply anesthetized with sodium pentobarbital (50 mg/kg). After dissection, sagittal brain slices (250–300 μm) were prepared in chilled (4 °C) dissecting solution (in mm) – 25.2 NaCl, 176 sucrose, 2.5 KCl, 5 MgCl2, 1.2 CaCl2, 1.25 NaH2PO4, 10 glucose and 26 NaHCO3, pH 7.4, bubbled with 95% O2/5% CO2. Slices were incubated for > 1 h in oxygenated artificial cerebrospinal fluid (aCSF) at room temperature (in mm) – 125 NaCl, 2.5 KCl, 1 MgCl2, 2 CaCl2, 1.25 NaH2PO4, 10 glucose and 26 NaHCO3, pH 7.4. Slices were then transferred to a flow-through chamber and superfused (approximately 1 mL/min) with oxygenated aCSF. The chamber was mounted on the stage of an upright microscope (Olympus BX61) equipped with a laser-scanning confocal head (Olympus Fluoview 300) and a water-immersion Nomarski and fluorescence 60× objective (numerical aperture 0.9). Experiments were performed at room temperature.
Patch clamp recordings and dye-coupling analysis
Whole-cell patch-clamp recordings were obtained as previously described (Liu et al., 2005, 2006; Young et al., 2010). Patch pipettes pulled from thin-walled borosilicate glass (WPI) had resistances of 6–8 MΩ when filled with an intracellular solution containing (in mm, unless otherwise noted) – 110 KCl, 3 MgCl2, 2 EGTA, 10 HEPES, 310 U/mg phosphocreatine kinase, 0.3 Na3-GTP, 4 Mg-ATP, 10 phosphocreatine and 20 μm Alexa fluor dye 488 or 568. pH and osmolarity were adjusted to 7.3 and 290 mOsm, respectively. Whole-cell recordings were performed using an Axopatch-200B amplifier and current signals were low-pass filtered at 2–5 kHz and digitized on-line at 5–20 kHz using a Digidata 1320 digitizing board (Axon Instruments). Cells were held in voltage clamp with a constant −5 pA current injection for 13–17 min to allow for dye diffusion.
Z-stack images were acquired on a confocal microscope (FluoView 300) with a 60× water-immersion objective (numerical aperture 0.95). Images were analysed using Imaris 4.0 (Bitplane AG) or ImageJ 1.39t (Freeware; Wayne Rasband, NIH, Bethesda, MD, USA) and reconstructed in Photoshop CS3. To count the number of coupled cells, we used Cell Counter plugin in ImageJ. Regions of interest (ROIs) were placed in the center of the cell bodies in the z-section.
Sulforhodamine 101 (SR101) loading and co-localization analysis
SR101 (200–400 μL) was transcardially perfused in hGFAP-MrgA1:GFP mice at 350 μm prior to slice preparation. For analysis, cells were counted approximately 10–20 μm below the slice surface. Cells stained within blood vessels were excluded from the analysis. The ImageJ plugin Cell Counter was used to quantify cells that had fluorescent signals in one or more channels.
Calcium imaging and analysis
SVZ cells were loaded by pressure application (< 3 p.s.i., approximately 20.7 kPa) of Fluo-4 AM (250 μm in aCSF, 0.4% pluronic acid F-127) inside the tissue (Lacar et al., 2010). Time-lapse movies were acquired at 0.30–0.89 Hz with FluoView 300 acquisition software. Most recordings lasted between 3.33 and 5.5 min. Calcium activity was analysed with custom-coded software CalSignal (written by J.C.P.) (Platel et al., 2007). F0 (i.e. baseline) and F are the mean fluorescence intensities measured throughout all of the ROIs and in each ROI, respectively. A change in fluorescence was considered to be a calcium increase if it was > 15%F/F0.
Time-lapse color representation (TLCR) for calcium waves
Frames in a movie were selected depicting calcium activity propagation. TLCR allows for temporal coding of a movie in a single image. This was performed as follows with a custom-coded script in MATLAB (written by B.L.). Every pixel in a time-lapse movie (typically 512 × 512 resolution) was treated as its own signal. For every pixel, the 8-bit intensity value (0–255) was re-scaled to 0–1. The average signal intensity of all time frames was then subtracted from each individual frame. When there is a salient calcium event that occurs at a particular time point (and only that time point), the resulting intensity would be very high (e.g. 0.9 on the 0?1 scale). If there is no calcium activity, the intensity would be low. The intensity for the individual pixels was then multiplied by RGB values, each representing particular time points, to assign that pixel a color. RGB values are comprised of three numbers, each represented on a 0–1 scale. (Red would be 1 0 0, blue would be 0 0 1, etc.) All color-coded time-series frames were then merged into a single image. Frames that depict high intensity (representing a salient event) will be shown within the spectrum of colors (blue to red), representing when it occurs in the movie (early to late, respectively). Non-salient signals, while still assigned an RGB value, will not be evident by virtue of their resulting low intensity. When salient signals do not appear more than once in the same place, this method provides an accurate representation of the pattern of activity in a movie.
Drugs
Pressure application (< 3 p.s.i., approximately 20.7 kPa) was performed using a computer-driven Picospritzer II (General Valve, Pine Brook, NJ, USA). Antagonists were bath applied. Suramin and MRS2179 were purchased from Tocris (Ellisville, MO, USA). Fluorescent dyes were purchased from Molecular Probes (Eugene, OR, USA). All other chemicals except antibodies were purchased from Sigma (St Louis, MO, USA).
Statistical analysis
Data were presented in Origin 8.0. Statistical significance was determined using the Fisher’s exact test with differences considered to be significant at P < 0.05 for (KyPlot 2.0). Data are presented as mean ± standard error of the mean (SEM) unless otherwise indicated. Box plots are represented as – box = SEM and median, open circle = mean.
Results
Connexin 43 expression is enriched in E and B cells
Using immunostaining in hGFAP-GFP mice, we examined connexin 43 expression in the dorso-lateral SVZ. Connexin 43 was highly expressed in E cells along the ventricle, in B1 cells (in particular their radial process, arrow, Fig. 1A and B), and in B2 cells (arrowhead, Fig. 1A–D). Connexin 43 staining has recently been reported in ependymal cells and B1 cells, further validating our findings (Mirzadeh et al., 2008). Cells were identified as B1 based on GFP expression, their location beneath the ependymal layer and the presence of a radial process extending through the SVZ. B2 cells were identified based on their location in the SVZ and away from the ependymal layer. A region enriched in connexin 43 staining was also visible between the SVZ and striatum (Fig. 1A and C).
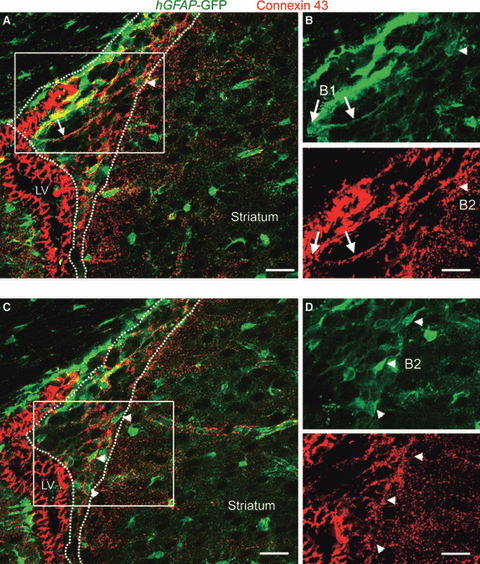
B1 and B2 cells of the SVZ express connexin 43. (A, C) Confocal photomicrographs of connexin 43 immunostaining (red) and GFP fluorescence (green) in coronal sections from hGFAP-GFP mice. The dotted lines delineate the SVZ. The arrow and arrowheads point to B1 and B2 cells, respectively, which both express connexin 43. Intense connexin 43 expression is visible in ependymal cells lining the lateral ventricle (LV). Connexin 43 is also enriched in a zone separating the SVZ and the striatum. (B, D) Higher magnification of the area delineated by the white squares shown in A and C. Scale bars – 50 μm (A, C) and 30 μm (B, D). For interpretation of color references in figure legend, please refer to the Web version of this article.
Gap junction coupling between B1, B2 and E cells
To explore gap junction coupling among B and E cells, we obtained whole-cell patch clamp recordings to fill B cells with the fluorescent dye Alexa fluor 568 (molecular weight, 730). This dye has limited diffusion through gap junctions and remains more concentrated in the recorded cells than a lower molecular weight dye, thus allowing better visualization of the recorded cell morphology. B cells were recorded in the dorso-lateral SVZ of acute slices from hGFAP-GFP mice. Figure 2A and B illustrate several planes above and below the recorded B1 cell (red, arrow) in a coronal section showing dye coupling to GFP+ cells in the SVZ. About 80% of the dye-coupled cells (excluding ependymal cells) expressed GFP, identifying them as B cells (Fig. 2C). 3-D perspectives and drawings in coronal view illustrate the location of the dye-filled cells with respect to the ventricular surface (Fig. 2D–E, G and H). Alexa 568-coupling is visible between B1 cells (arrows) as well as E cells (blue arrow) and B2 cells (arrowheads) and involved a mean of approximately 32 B cells (n = 4 slices, Fig. 2F). B1 cells were beneath the ependyma and sent a radial glia-like process inside the SVZ. B2 cells were inside the SVZ and at the SVZ–striatal border zone. The location of dye-filled B2 cells is better appreciated on the top-down projection from the 3-D coronal perspective (Fig. 2H). A 3-D perspective drawing illustrates the coupled cells in different views (Fig. 2I).
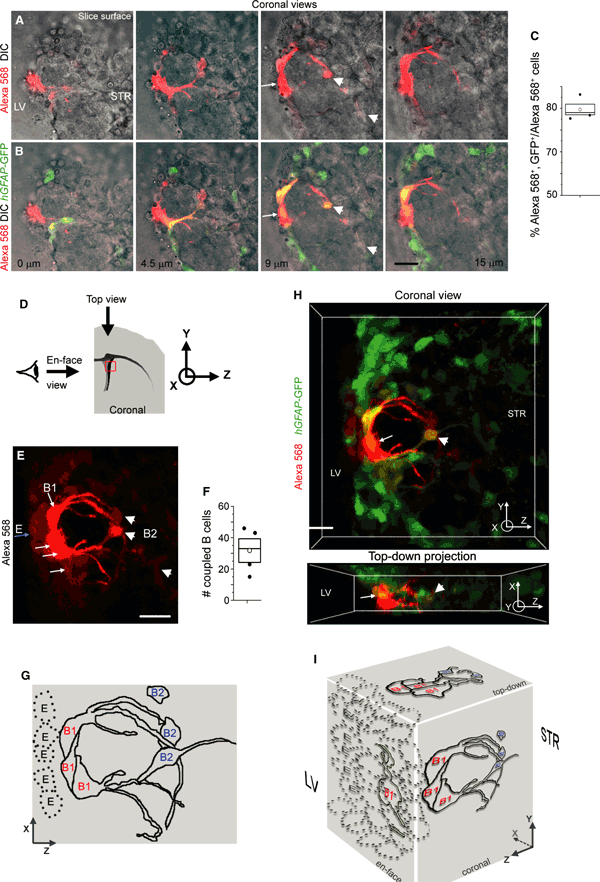
Gap junctional coupling between B1–B1 and B1–B2 cells in the SVZ. (A, B) Images of coronal views of Alexa 568 (red), differential interference contrast and overlay with GFP from hGFAP-GFP (green) at different depth inside the slice. (C) Box plot of the percentage of Alexa fluo 568+ cells that are GFP+ in sections from hGFAP-GFP mice. (D) Diagram illustrating the slice orientation. (E) Confocal 3-D perspective of Alexa fluor 568-coupled cells shown in A. The white arrows point to B1 cells, the arrowheads to B2 cells and the blue arrow to ependymal cells. (F) Box plots of the number of coupled B cells using the Alexa fluor 568 dye. (G) Diagram illustrating the 3-D perspective of Alexa 568-coupled cells shown in E. (H) Coronal view of 3-D perspective and top-down projection of Alexa fluor 568-coupled GFP+ cells shown in B. The top-down view illustrates the location of presumed B2 cells inside the tissue while the somata of B1 cells are located close to the ventricle. (I) 3-D diagram illustrating the coronal, en-face and top-down views of the coupled cells shown in A, E and H. Box = SEM and median, open circle = mean. Scale bars – 20 μm (A–H). For interpretation of color references in figure legend, please refer to the Web version of this article.
To further validate that NPCs cells were coupled, we used in vivo electroporation of radial glial cells at postnatal day 0–1 located along the lateral ventricle (Fig. 3A). Radial glial cells generate neuroblasts that integrate as interneurons in the olfactory bulb and progressively transform into B1 cells, i.e. the NPCs of the SVZ (Merkle et al., 2004). Because B1 cells are slow cycling, they are expected to retain the electroporated CAG-GFP plasmid while fast cycling cells dilute it and lose GFP expression after successive divisions. Indeed, most GFP+ cells at 3–4 weeks post-electroporation displayed a B1 cell morphology characterized by a long radial glia-like process terminating with endfeet on blood vessels (Fig. 3B and D). Patch clamp recordings of GFP+ cells with such morphology and beneath the ependymal layer revealed the presence of Alexa fluor 488 coupling to B1 and B2 cells (Fig. 3C and E, schematic diagram in Fig. 3F). A high-power image of the coupled cells inside the tissue illustrates the extensive blood vessel coverage formed by the dye-coupled cells (Fig. 3G). Collectively, these data show that B1 and B2 cells are coupled and form a communication network that bridges the ventricular surface to blood vessels.
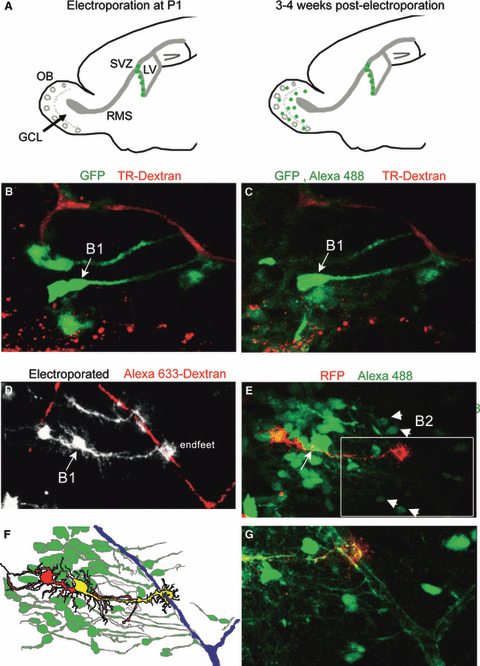
Slow-cycling B1 cells with projections on capillaries display dye coupling to B2 cells. (A) Diagrams illustrating time points and corresponding locations of SVZ-born cells following electroporation at P1. At > 3–4 weeks post-electroporation, slow-cycling neural progenitor cells persist in the SVZ while neuroblasts have integrated in the granule cell layer (GCL) of the olfactory bulb (OB). (B) Photograph of GFP fluorescence from a CAG-GFP plasmid and Texas-Red dextran fluorescence in capillaries prior to patch clamp recording of the B1 cell marked with the arrow in an acute sagittal slice from a 3-week-old animal electroporated at P1. (C) Photograph of the same cells as in B following patch clamp recording of the B1 cell filled with the Alexa fluor 488 dye. The recorded cell is dye-coupled to surrounding cells (diffuse green fluorescence). (D) Photograph of GFP and RFP fluorescence pseudo-colored white (from a CAG-GFP or -RFP plasmid) and Alexa fluor 633 dextran fluorescence prior to patch clamp recording of the B1 cell marked with the arrow in an acute sagittal slice from a 3-week-old animal electroporated at P1. (E) Photograph of the same cells as in D following patch clamp recording of the B1 cell filled with the Alexa fluor 488 dye. The recorded cell is dye-coupled to surrounding B1 cells, including deeper cells in the tissue, presumably B2 cells. (F) Diagram illustrating the red fluorescence from CAG-RFP, the green fluorescence from the Alexa 488 dye and the red–green overlay (yellow) of the recorded cell. (G) Zoom of the image shown in the white square in E. For interpretation of color references in figure legend, please refer to the Web version of this article.
An en-face view of the SVZ in acute slices to image B1 cell coupling and calcium activity
To better image the extent of B1 cell coupling, we prepared acute sagittal slices that contain an ‘en-face’ view of the dorso-lateral SVZ with the ependymal layer on top (4, 5). In addition, to better visualize the extent of coupling we used the Alexa fluor 488 dye, which diffuses better than the Alexa fluor 568 due to its smaller molecular weight (570). A B1 cell just beneath the ependymal layer was filled with the Alexa fluor 488 (arrow, Fig. 4A and D). Three individual sections and a 3-D en-face view with projections are shown in Fig. 4A and B, respectively. Coupling involved a mean of approximately 60 B cells in a 40-to 50-μm-thick optical section (n = 4 slices, Fig. 4C). The dye diffused to other B1 cells located close to the ventricular surface presumably through their lateral processes, which are visible on the individual section (Fig. 4A). The coupling faded as a function of distance, as illustrated using pseudo-coloring (Fig. 4D). In addition, coupled B1 cells form clusters along the ventricular surface (Fig. 4D).
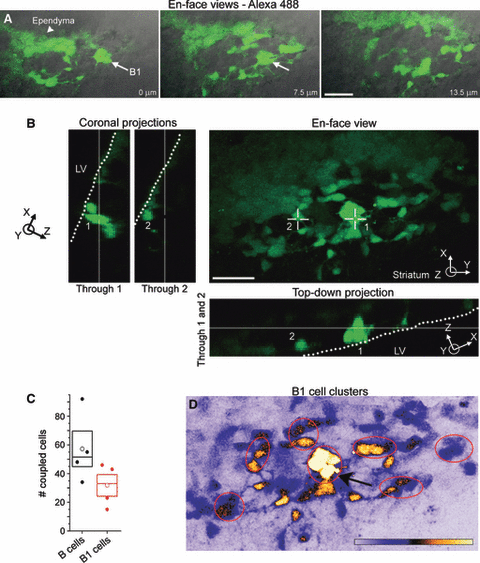
En-face view of Alexa 488-coupled B1 cells. (A) Montage of en-face views of Alexa 488 (green) and differential interference contrast overlay at different depth inside the slice. The white arrow points to a presumed B1 cell, which was dye filled during patch clamp recording. (B) Confocal en-face 3-D perspective of Alexa fluor 488-coupled cells shown in A. The coronal (left) and top-down (bottom) projections illustrate that the recorded cell and some of the dye-coupled cells have their somata located along the lateral ventricle (dotted line). (C) Box plots of the number of coupled B and B1 cells using the Alexa fluor 488 dye in a en-face view section. (D) Confocal image of highly coupled B1 cells in the 3-D en-face perspective using intensity color representation. Intensity color scale bar – 0–255 (saturation). The arrow points to the recorded cell. Box – SEM and median, open circle – mean. Scale bars – 50 μm (A) and 40 μm (B).
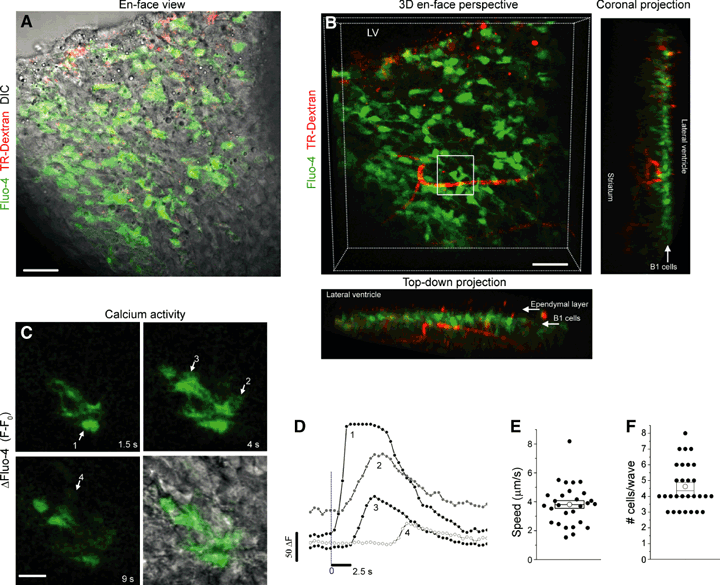
B1–B1 calcium waves. (A) Composite photograph of an en-face view of Fluo-4 and Texas Red-dextran fluorescence overlaid with differential interference contrast. (B) 3-D en-face perspective of Fluo-4 and Texas Red-dextran from the composite slice shown in A. The coronal and top-down projections illustrate the depth of the Fluo-4-loaded cells (B1 cells along the ventricular surface) and the red fluorescent capillaries. The ependymal cells were not loaded with Fluo-4. The boxed region is spatially and temporally expanded in C. (C) Fluo-4 fluorescence at four time points illustrating a calcium wave that propagates between B1 cells close to a capillary. (D) Calcium activity graph of region of interest 1–4 shown on the image in C. (E, F) Box plot of the speed of the wave (E) and the number (#) of cells participating in a wave (F). Scale bars – 30 μm (A, B), 20 μm (C).
Such an en-face preparation was chosen to image calcium activity as it preserves the 3-D architecture of the SVZ. We previously reported preferential B-cell loading using the calcium indicator Fluo-4 AM pressure-applied inside the tissue (Lacar et al., 2010; Young et al., 2010). To further identify Fluo-4-loaded cells as B cells, we used SR101 in either CD1 wild-type mice or hGFAP-MrgA1:GFP mice, in which the outlines of B cells are GFP-fluorescent (Holm et al., 1997; Kafitz et al., 2008; Platel et al., 2010a; Young et al., 2010). In acute slices, the majority (74.3%) of the Fluo-4-fluorescent cells were SR101-positive (n = 4 slices, n = 404 cells) (Supporting Information Fig. S1A–C). In hGFAP-MrgA1:GFP slices, 90% of SR101-positive SVZ cells were GFP-fluorescent, identifying SR101-positive cells as B cells (n = 5 slices, n = 338 cells, Supporting Information Fig. S1D and E). Ependymal cells were SR101-positive, but they were morphologically distinguishable from B cells and did not display spontaneous calcium activity (Genzen et al., 2009). Thus, the majority of Fluo-4-loaded SVZ cells were identified as B cells.
Intercellular calcium waves engage B1 and B2 cells
A representative en-face view of Fluo-4-loaded B cells in the SVZ is shown in Fig. 5A. Fluo-4-labeled B1 cells, which are located beneath the ependymal layer, were seen in proximity to Texas red-dextran-loaded capillaries, as illustrated in the 3-D perspective and projections (Fig. 5B). Calcium waves occurred between B1 cells adjacent to a capillary and lasted approximately 10 s (Fig. 5C, white box in Fig. 5B). These waves travelled at a mean speed of 4 μm/s (n = 28 waves, 11 slices, Fig. 5E) and involved about five B cells in a single optical plane (Fig. 5F).
In addition to B1–B1 waves, calcium propagations between B1 and B2 cells were also visible (Fig. 6). B1 (arrow) and B2 cells (arrowheads) are visible in the 3-D en-face perspective, which also contains red fluorescent capillaries and lipid-droplet-containing ependymal cells (Fig. 6A and B). A calcium wave travelled from a cell beneath the ependymal layer to B1 and B2 cells in approximately 10 s (Fig. 6C–E). We used time-lapse color representation (TLCR) to provide a calcium imaging movie in a single image (Fig. 6D). Inter-B cell waves occurred at a frequency of 1.1 wave/min (n = 17 waves, eight slices, Fig. 6F) and were observed in 86% of the 3-to 6-min-long recordings (12/14 slices).

B1–B2 calcium waves. (A, B) Confocal photomicrographs of an en-face view of Fluo-4 and Texas Red-dextran (A) and Texas Red-dextran overlaid with the differential interference contrast image (B). (C) Fluo-4 fluorescence at several time points illustrating a calcium wave that propagates from B1 to B2 cells contacting a capillary. (D) TLCR of the calcium wave shown in C. (E) Calcium activity graph of ROIs 1–5 shown on the image in C. (F) Box plots of the number (#) of waves per min. Scale bars – 40 μm (A, B) and 20 μm (C, D).
Inter-B cell calcium waves propagate on blood vessels and are gap junction-dependent
One characteristic of the inter-B cell calcium waves was the localization of calcium activity around blood vessels (Fig. 7A–C). TLCR illustrates the time and direction of travel as well as the en-passant engagement of several B cell processes along the blood vessel. TLRC also allows a better appreciation that calcium waves travelled bidirectionally along the vessels. Calcium waves covered approximately 40 μm on blood vessels (n = 29 waves, 11 slices, Fig. 7D).

B cell-calcium wave propagate on capillaries and are gap junction-dependent. (A) Fluo-4 fluorescence at several time points illustrating a calcium wave that propagates on a capillary and involved calcium activity in B cells along the capillary. (B) TLCR of the wave shown in A. (C) TLCR of another calcium wave propagating on a capillary. (D) Box plots of the distance travelled on blood vessels. (E) Bar graphs of the percentage of slices displaying calcium waves under control conditions and in the presence of MFA, MRS2179 and suramin. Scale bars – 30 μm (A–C).
We examined whether calcium waves were eliminated in the presence of meclofenamic acid (MFA, 100 μm), which is known to block gap junctions in B cells (Liu et al., 2006). Calcium wave frequency was significantly reduced in the presence of MFA, suggesting that MFA significantly blocked waves between B cells (Fisher’s Exact test, P ≤ 0.01, waves occurred in 1/5 slices in MFA vs. 19/21 in control, Fig. 7E). P2Y receptors are expressed in SVZ cells and they contribute to wave propagation in other cell types including astrocytes (Weissman et al., 2004; Fiacco & McCarthy, 2006; Lin et al., 2007; Wang & Bordey, 2008). We thus tested the P2Y1 receptor blocker MRS 2179 (30 μm), and the broad-spectrum P2 receptor blocker suramin (100 μm), which are known to affect waves among astrocytes. Inter-B cell calcium waves persisted in the presence of the P2Y1 (MRS 2179, n = 4/5 slices) and P2 receptor blockers (suramin, n = 4/4 slices), respectively (Fig. 7E). Nevertheless, suramin and MRS 2179 significantly reduced calcium responses induced by uridine 5′-triphosphate (UTP) (100 μm, 30 s, n = 3 slices) and the P2Y1 agonist MRS 2365 (100 nm, 10 s, n = 3 slices) in B cells, respectively (data not shown). These data suggest that calcium waves among B cells are gap junction-dependent.
Discussion
The results presented here demonstrate for the first time that B cells, including B1–B1 and B1–B2 cells, form gap junction-mediated communication networks at the vascular interface in the SVZ.
Dye-coupled cells essentially include B cells based on their expression of GFP in hGFAP-GFP mice and ependymal cells. This network mediated through gap junctions involves 50–60 B cells in a approximately 50 × 320 × 320 μm3 volume. In fact, 50–80 μm can cover the entire distance from the striatum to the lateral wall in our slices. Ependymal cells identified based on their cuboidal morphology and the presence of moving cilia under phase-contrast microscopy also participated in the gap junction network.
Coupled B cells but not E cells displayed active communication through calcium waves. The lack of calcium waves from B to E cells remains unclear. Between B cells, the waves involved both B1–B1 and B1–B2 cell propagation. Calcium waves did not involve ependymal cells even though these cells were dye-coupled to B1 cells. Calcium waves essentially involved 5–7 cells in a single optical section while coupling involved 50–60 B cells with the dye used in three dimensions. It is expected that calcium waves would involve 15–21 cells in 3-D space, which is still lower than the dye-coupling spread. One explanation for this discrepancy is that the calcium spread may involve mechanisms based not only on calcium diffusion. Consistent with the presence of dye-coupled, connexin 43 expression in B cells, these waves were dependent on the gap junction blocker MFA but not P2Y1 receptor activation as shown in other astroglial preparations (Weissman et al., 2004; Fiacco & McCarthy, 2006; Wang & Bordey, 2008). However, additional experiments using selective connexin 43 blockers or genetic manipulations would be required to conclude that these waves are mediated by connexin 43 gap junctions because MFA is not a selective blocker of gap junctions or connexin 43 (e.g. Anderson et al., 2009). These waves occurred spontaneously, as previously shown in embryonic radial glia (Weissman et al., 2004). It remains to be examined whether others factors such as ambient GABA, prostaglandin E2 from the choroid plexus or locally, or even various neuronal inputs in the SVZ trigger or regulate these waves (Bolteus & Bordey, 2004; Liu et al., 2005; Platel et al., 2010b; Dave et al., 2011). Based on the preferential Fluo-4 loading of B cells, it is not possible to examine whether neuroblasts were activated ‘en passant’. Nevertheless, it is highly conceivable that inter-B cell calcium waves activate neuroblasts ‘en passant’ through the calcium-dependent release of diffusible signals such as glutamate (Platel et al., 2010a).
One unexpected characteristic of the calcium waves is their propagation on blood vessels. Other groups have reported the presence of a large blood vessel network in the SVZ and examined the structural relationships between B1 cells and blood vessels in the SVZ (Mirzadeh et al., 2008; Shen et al., 2008; Tavazoie et al., 2008; Snapyan et al., 2009). Here, we reveal dynamic, intercellular calcium signaling at the B cell–vascular interface. On blood vessels, calcium waves may travel in astrocytic endfeet, pericytes (for capillaries), smooth muscle cells (for arterioles) or endothelial cells. In some instances, a process between the astrocytic endfeet and the vessel was visible under phase-contrast microscopy. This process was not loaded with the calcium indicator and was probably from a pericyte, suggesting that the calcium wave propagated in the B cell endfeet. In addition, B cell processes were activated en-passant during the wave propagation, suggesting that such calcium waves essentially involved B cells, i.e. GFAP+ cells. Such calcium waves between B cells travelling on blood vessels may have major functional implications. They could regulate glucose and metabolite uptake for transfer through the B cell network and control the release of active signals onto smooth muscle cells or endothelial cell, thus regulating the permeability of the blood–brain barrier in the neurogenic niche (for a review see Wang & Bordey, 2008). Finally, the restriction of the waves to a relatively small group (5–7 in a single optical section, expected 15–21 in three dimensions) of B cells suggests the existence of functional microdomains close to blood vessels in the SVZ. These microdomains could be activated independently in terms of calcium activity and perhaps leading to synchronized proliferation and migration.
Collectively, this study provides evidence that in the neurogenic postnatal SVZ NPCs and niche astrocytes form communication networks that have a privileged location at the vasculature interface. This challenges the previous concept that B1 cells are an individual unit distinct from B2 cells. In addition, B2 cells may not only play a structural role separating the SVZ from the striatum, but may also actively shape the behavior of NPCs through functional coupling and calcium waves.
Acknowledgements
This work was supported by grants from the NIH (DC007681, A.B.), CT Stem Cell grant (A.B.), Predoctoral Ruth L. Kirschstein National Research Service Awards (NRSA; S.Z.Y.), and a NSF Graduate Research Fellowship (B.L.). We thank Dr Ken McCarthy (University of North Carolina) for generously providing the hGFAP-MrgA1 mice and the Bordey lab members for helpful comments on the manuscript. The present material is based on work partly supported by the State of Connecticut under the Connecticut Stem Cell Research Grants Program. Its contents are solely the responsibility of the authors and do not necessarily represent the official views of the State of Connecticut, the Department of Public Health of the State of Connecticut or CT Innovations, Inc.
Abbreviations
-
- 3-D
-
- three-dimensional
-
- aCSF
-
- artificial cerebrospinal fluid
-
- GFP
-
- green fluorescent protein
-
- MFA
-
- meclofenamic acid
-
- NPCs
-
- neural progenitor cells
-
- SEM
-
- standard error of the mean
-
- SR101
-
- sulforhodamine 101
-
- SVZ
-
- subventricular zone
-
- TLCR
-
- time-lapse color representation


