Sound stimulation modulates high-threshold K+ currents in mouse auditory brainstem neurons
Abstract
The auditory system provides a valuable experimental model to investigate the role of sensory activity in regulating neuronal membrane properties. In this study, we have investigated the role of activity directly by measuring changes in medial nucleus of the trapezoid body (MNTB) neurons in normal hearing mice subjected to 1-h sound stimulation. Broadband (4–12 kHz) chirps were used to activate MNTB neurons tonotopically restricted to the lateral MNTB, as confirmed by c-Fos-immunoreactivity. Following 1-h sound stimulation a substantial increase in Kv3.1b-immunoreactivity was measured in the lateral region of the MNTB, which lasted for 2 h before returning to control levels. Electrophysiological patch-clamp recordings in brainstem slices revealed an increase in high-threshold potassium currents in the lateral MNTB of sound-stimulated mice. Current-clamp and dynamic-clamp experiments showed that MNTB cells from the sound-stimulated mice were able to maintain briefer action potentials during high-frequency firing than cells from control mice. These results provide evidence that acoustically driven auditory activity can selectively regulate high-threshold potassium currents in the MNTB of normal hearing mice, likely due to an increased membrane expression of Kv3.1b channels.
Introduction
Neuronal activity, particularly during development, is thought to be crucial in shaping the strength of synaptic connections and the membrane properties of neurons in the brain. However, there is surprisingly little direct in vivo experimental evidence for such refinement at the fundamental membrane and channel level in postsynaptic neurons, following increases or decreases in neuronal activity. Our previous results on central auditory pathways in congenitally deaf mice have demonstrated that a lack of auditory nerve activity results in an increase in neuronal membrane excitability (Leao et al., 2004), suggesting a role for neural activity during development in regulating neuronal membrane properties. In particular, that study showed that the increased excitability of neurons in the medial nucleus of the trapezoid body (MNTB) in congenitally deaf mice was primarily due to alterations in the expression of low- and high-threshold potassium channels (Leao et al., 2004). Voltage-activated potassium currents are important determinants of the firing properties of MNTB neurons, and are crucial to the role of these neurons in sound localisation (Brew & Forsythe, 1995; Wang et al., 1998; Oertel, 1999; Dodson et al., 2002; Ishikawa et al., 2003; Kopp-Scheinpflug et al., 2003; Macica et al., 2003; Barnes-Davies et al., 2004; Kaczmarek et al., 2005; Bortone et al., 2006; Klug & Trussell, 2006). Principal cells of the MNTB show high expression of voltage-gated K+ channel (Kv) genes, in particular for Kv1.1, Kv1.2, Kv2.2 and Kv3.1 potassium channels (Grigg et al., 2000; Johnston et al., 2008). Low-threshold voltage-activated K+ currents, generated by Kv1 channels, are important for the MNTB principal cell’s ability to generate single action potentials (APs) in response to large depolarisations (Brew & Forsythe, 1995; Dodson et al., 2002). Kv3.1 channels, which generate the high-threshold voltage-gated K+ current (Wang et al., 1998), are instead important for the ability of cells to fire at high rates (Rudy & McBain, 2001). Kv2.2 channels, although exhibiting slow activation kinetics, have been shown to play a role in maintaining AP amplitude during high-frequency firing (Johnston et al., 2008). In the mouse MNTB, there is a greater expression of Kv3.1 channels at the ‘high-frequency’ (medial) region of the MNTB and a slightly greater expression of Kv1.1 channels at the low-frequency (lateral) region of the MNTB (Leao et al., 2006). Interestingly, these gradients are disrupted in congenitally deaf mice (Leao et al., 2006), again suggesting a role for activity in the regulation of potassium channel expression. While these results are suggestive, questions remain as to whether changes in sensory activity in normal hearing animals result in modification of membrane and firing properties and, if so, which channel types underlie these changes. In the present study, this was investigated directly by exposing normal hearing mice to 1-h sound stimulation to increase neural activity selectively in tonotopically defined regions of the MNTB. A combination of immunolabelling and patch-clamp electrophysiological methods was used to measure changes in channel expression and functional differences in voltage-dependent currents in MNTB neurons following sound stimulation.
Materials and methods
Acoustic stimulation
Experiments were carried out in accordance with the Australian National University Animal Ethics Committee. Awake and freely moving CBA mice (16–23 days old, male and female) were presented with broadband chirp stimuli (4–12 kHz) for 1 h from a high-frequency loudspeaker (Scan-speak R2904/700000 tweeter, Model: 25735 59 044) placed on top of a standard plastic cage, which contained a plastic divider ensuring that mice (1–3 per experiment) were located underneath the speaker (area dimensions 12 × 12 cm). The cage was further placed in a soundproof chamber. Animals were given a period of 15–30 min prior to sound presentation for acclimatisation in the new environment. Sound pressure levels were of a non-harmful level of 75 dB measured 20 cm directly underneath the speaker. Acoustic stimuli were synthesised using custom-made software in Labview (National Instruments) and the loudspeaker was driven by a National Instruments data acquisition card (National Instruments). A sound level meter (Type 2230, Brüel & Kjær) was used to calibrate the sound pressure level, and a free-field microphone (Type 4939, Brüel & Kjær) was used to assure the correct frequencies were emitted. Sound stimulation waveform consisted of 275-ms chirp with frequency increasing linearly from the lowest to the highest frequency within the chosen spectrum. Pulse amplitude was ramped from 0 to maximum and maximum to 0 in 12.5-ms intervals, and the interpulse interval was equal to 200 ms (Friauf, 1992). Some experiments required sound stimulation only for 10 or 30 min. Control animals were placed in the same cage, allowed 15–30 min of acclimatisation and thereafter kept sound deprived for 1 h.
Initial experiments with pure tones of 1, 4, 16 and 30 kHz, for 1 h at 75 dB, were used to assess frequency regions within auditory nuclei. Pure tone frequency stimuli consisted of tone pulses of 100 ms duration with a ramp duration of 5 ms and 100-ms intervals between tone pulses (Friauf, 1992).
Electrophysiology
Following 1-h sound stimulation (chirps of 4–12 kHz), or control conditions, mice were decapitated and the forebrain and cerebellum were removed in ice-cold modified cutting artificial cerebrospinal fluid (ACSF; in mm: KCl, 3.0; MgCl2, 5.0; CaCl2, 1.0; NaH2PO4, 1.25; NaHCO3, 26.2; glucose, 10; sucrose, 218; equilibrated with 95% O2, 5% CO2). Transverse slices (200 μm) containing the MNTB were made using an oscillating tissue slicer (Integraslice 7550 PSDS; Campden Instruments, UK). Slices were incubated for 1 h in normal ACSF (in mm: NaCl, 130; KCl, 3.0; Mg2SO4, 1.3; CaCl2, 2.0; NaH2PO4, 1.25; NaHCO3, 26.2; glucose, 10; equilibrated with 95% O2, 5% CO2) at 35 °C, and subsequently held at room temperature (22–25 °C) for electrophysiological recordings. Whole-cell voltage-clamp and current-clamp recordings from visualised MNTB neurons were made using an Axopatch 200B and a Multiclamp 700B amplifier, and Axograph X data acquisition and analysis software (AxoGraph Scientific, Sydney, Australia.). Access resistance (5–15 MΩ) was routinely compensated by > 80%. The internal solution consisted of (in mm): potassium gluconate, 122.5; KCl, 17.5; NaCl, 9; MgCl2, 1; Hepes, 10; Mg-ATP, 3; GTP-tris, 0.3; EGTA, 0.2). The pH was adjusted to 7.2 using KOH. Current and voltage steps were applied and analysed using Axograph X and Matlab R13 (Mathworks). Potassium currents were elicited by 500-ms voltage steps to test potentials between −70 and +44 mV (6-mV increments, with 300 ms pre-potential at −80 mV), and current amplitudes were measured for the last 10 ms of the 500-ms step. To account for the uncompensated series resistance (Ru), the membrane voltage (Vm) was calculated by Vm = Vc − ImRu , where Vc is the command voltage and Im is the membrane current (Rothman & Manis, 2003). Voltage-clamp data are shown in relation to Vm rather than Vc, and to simplify calculations we obtained current values for Vm ranging from −70 mV to 20 mV (6-mV steps) by using cubic spline interpolation. Tetraethylammonium (TEA; 1 mm) was used to block the high-threshold potassium currents. In one series of experiments, trains of current pulses (2 nA, 0.5-ms duration, at 166, 250 and 500 Hz) were used to stimulate APs in MNTB neurons. Alexa-488 (Molecular Probes) was added to the internal solution in order to determine the spatial location of the cell within the MNTB.
Dynamic-clamp
In order to assess the functional effects of different Kv3.1 conductances in MNTB neurons, we have simulated Kv3.1 currents with the dynamic-clamp technique using a dedicated computer running a Linux kernel modified by the Real Time Application Interface for Linux from the Politecnico di Milano Institute – Dipartimento di Ingegneria Aerospaziale (http://www.rtai.org), and custom-made software that reads membrane voltage and generates current commands at a 40-kHz refreshing rate using a DAQ card (National Instruments) and drivers from the Linux Control And Measurement Device Interface (COMEDI, http://www.comedi.org; Leao et al., 2005). To block the native Kv3.1 current we bath-applied 1 mm TEA. The Kv3.1 current was calculated according to IKv3.1 = gn4(V − VK), with dn/dt = (n∞ − n)/τn; n∞ = α/(α + β) and τn = 1/(α + β). α and β were calculated by α = C(V + Vc)/(e−(V + Vc)/Vα − 1) and β = Ce−(V − Vc)/Vβ (C = −0.034425/ms; C = 0.91647/ms; V = 2.0885.10−6 mV; V = 40.605 mV; Vc = 0.17634 mV; Leao et al., 2006).
Immunohistochemistry
Sound-stimulated animals used for immunohistochemical experiments were usually left for 1 h in the soundproof chamber after the sound stimuli ended (time after stimulation; TAS) to account for the incubation (1 h, 35 °C) of sections used in electrophysiological experiments. Control animals were handled in the same way, but without sound stimulation. Some experiments required animals to be immediately killed on termination of sound stimuli or left for longer TAS (see Results). Following stimulation or control conditions, mice were anaesthetised (Avertin 0.4–0.6 mg/g body weight; Sigma) before transcardial perfusion with cold normal saline followed by 15–20 mL of fixative (4% paraformaldehyde in 0.1 m phosphate buffer; pH 7.4). The brainstem was dissected and placed in 4% paraformaldehyde for post-fixation overnight, and thereafter placed in phosphate-buffered saline (PBS) with 30% sucrose until dehydrated. Transverse sections (35 μm) were obtained at the level of the MNTB on a cryostat (Leica CM 1850). Frozen sections were blocked with 5% normal donkey serum in PBS with 0.3% Triton X-100 for 30–60 min, and subsequently incubated overnight at room temperature with the appropriate commercially available primary antibody: c-Fos (Santa Cruz; catalogue no: sc-253; rabbit, 1 : 500) and Kv3.1b (Alomone; catalogue no: APC-014; rabbit, 1 : 500), followed by incubation (1 h) with species-appropriate Alexa-conjugated secondary antibody (Molecular Probes; 1 : 1000). Sections were coverslipped with Vectashield mounting medium (Vector Laboratories) and sealed with nail polish. Guinea pig anti-vesicular glutamate transporter 1 (VGLUT1; Millipore; catalogue no: AB5905; guinea pig, 1 : 1000) was used to outline presynaptic terminals (specifically the large calyx of Held synapse onto MNTB neurons) and anti-microtubule-associated protein (MAP2A,B; Millipore; catalogue no: MAB378; mouse, 1 : 200) was used as a postsynaptic marker (somas and dendrite; Leao et al., 2008). Specificity of the Kv3.1b antibody was performed by preabsorption with antigenic peptide (sequence CKESPVIAKYMPTEAVRT; Alomone; catalogue no. APC-014; Fig. S1). We used Kv3.1b antibodies in our study as ‘b’ is the predominant splice variant of the Kv3.1 gene in auditory neurons of adult animals (Liu & Kaczmarek, 1998; Macica et al., 2003).
Fluorescent images were collected as single thin images or z-stacks using a laser-scanning confocal microscope (Ziess LSM) with a 20 × /0.75 objective at 1024 × 1024 pixel resolution. The × 20 objective made it possible to obtain images containing the whole length of the MNTB, thus generating images containing both lateral and medial regions with identical imaging acquisition parameters.
Image analysis
Confocal images (collapsed z-stacks) were thresholded using ImageJ (NIH) and positive c-Fos-immunoreactivity was manually recorded. Only c-Fos staining found within cell bodies that were surrounded by VGLUT1-positive staining (the large presynaptic calyces of Held) were counted as activated principal cells of the MNTB. For potassium channel-immunoreactivity the relative mean optical density (OD) was measured as the average mean pixel value of manually outlined membrane staining of MNTB cells (10 cells/region per optical slice in the z-stack) of the most lateral and medial region of the MNTB (< 150 μm from the edge). The relative OD of images from the z-stack was then averaged for each nucleus to account for possible differences in the position of the horizontal axis after sectioning on the cryostat for each animal. Background intensity was routinely measured and subtracted from the average mean pixel value per region of each section. The ratio lateral/medial OD was calculated; values below 1 denote medial predominance of immunoreactivity and values above 1 denote lateral predominance of immunoreactivity.
Statistical analysis
Student’s t-test (two sample, equal variance) and one-way anova were used, and statistically significant differences are shown as asterisks (*P < 0.05 or **P < 0.005). Data are presented as means and standard error of the mean (SEM).
Results
Membrane protein expression of the shaw type K+ channel Kv3.1b and membrane properties (in particular, outward potassium currents) were studied in the MNTB of 3-week-old normal hearing mice (CBA strain) following sound stimulation.
c-Fos expression of MNTB neurons following sound stimulation
In order to understand the role of sensory activity on K+ channel expression, mice were exposed to sound that would temporarily increase the neuronal activity in the auditory system. To confirm that the sound presentation increased neuronal activity of MNTB neurons, an antibody against the protein product of the cellular immediate-early gene c-Fos, which is a marker for increased neuronal activity (Sheng & Greenberg, 1990; Friauf, 1992; Keilmann & Herdegen, 1997), was used. Animals kept in a quiet environment for 1 h (control) showed no detectable c-Fos reactivity in the MNTB, or in the preceding auditory brainstem nuclei; the anteroventral cochlear nucleus (AVCN) that supplies the MNTB with tonotopically organised input, or in the postsynaptic auditory nuclei; the lateral superior olive (LSO) that receives input from the MNTB (Fig. 1A and B). To establish the patterns of activated neurons in response to sound stimulation, we used 1-, 4-, 16- or 30-kHz pure tones (Friauf, 1992). It is known that the AVCN has a ventral to dorsal distribution of frequency input from the cochlea (ventral – low frequency; dorsal – high frequency), while the MNTB and LSO have a lateral to medial frequency distribution (lateral – low; medial – high; Spangler et al., 1985; Willott, 2001). A 1-kHz tone (for 1 h) presented to the mice resulted in no positive c-Fos staining in any of the studied auditory brainstem nuclei, while 4-kHz pure tones elicited c-Fos-immunoreactivity in the lateral edges of the MNTB as well as the LSO, and the most ventral edge of the AVCN (Fig. 1B). Tones of 16 kHz produced non-uniform scattered immunoreactivity around the intermediate region of auditory brainstem nuclei. High-frequency (30 kHz) tones generated c-Fos labelling in the most medial region of the MNTB, with a few activated neurons dispersed towards the intermediate region (Fig. 1B, arrowhead). The LSO exhibited c-Fos labelling in the medial area, although a few strongly labelled neurons could be observed also at the intermediate ventral edge (Fig. 1B, arrowhead). The AVCN displayed distinct clustered labelling in the dorsal AVCN following 30-kHz pure tone stimulation (Fig. 1B). To increase the likelihood of recording from neurons affected by sound stimulation in slice, we used broadband sounds (4–12-kHz chirps) to trigger c-Fos activity in a large number of lateral neurons of the MNTB. The MNTB was carefully cryosectioned rostrally to caudally in thin slices and, using immunohistochemistry of c-Fos and VGLUT1 antibodies, the sound-activated neurons were shown to be exclusively contained within the lateral half of the MNTB (Fig. 2A and B), with a paucity of activated neurons in the medial half. Thus, the non-activated medial region of the MNTB serves as a useful internal control for non-specific effects of the sound stimulation (‘sound-stimulated neurons’ refers to MNTB cells found in the lateral region of the MNTB). Unstimulated animals, with no increased neuronal activity (and no c-Fos expression), provided control data for both the activated lateral cells and the internal control medial cells of sound-stimulated mice.
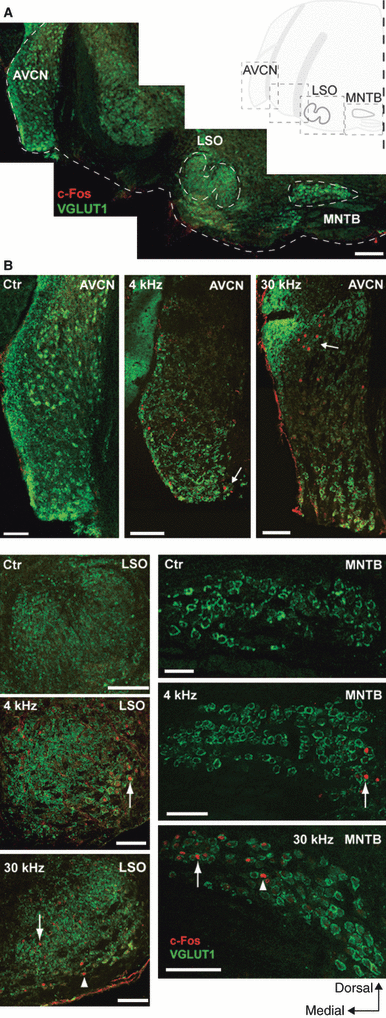
c-Fos expression in auditory neurons following pure tone stimulation. (A) Images outlining the ventral edge of a section containing the anteroventral cochlear nucleus (AVCN), the lateral superior olive (LSO) and the medial nucleus of the trapezoid body (MNTB) from control (quiet environment) mice stained with antibodies against c-Fos (red) and vesicular glutamate transporter 1 (VGLUT1; green). Scale bar: 200 μm. Inset: schematic drawing of a brainstem hemisection. (B) Higher-magnitude images of thin sections containing the AVCN (top panel), LSO (bottom, left column) and MNTB (bottom, right column) following control (ctr), 4 or 30 kHz pure tone stimulation labelled with antibodies against c-Fos (red) and VGLUT1 (green). Arrows point at typical c-Fos-labelled cells, arrowheads point to non-conforming c-Fos staining. Scale bar: 100 μm.

Sound stimulation of lateral region MNTB neurons. (A) Confocal image of the MNTB (outlined) after animals were subjected to 1-h sound stimulation with 4–12-kHz broadband chirps. c-Fos-immunoreactivity (red) indicates activated principal neurons of the MNTB, co-stained with the presynaptic marker vesicular glutamate transporter 1 (VGLUT1; green) labelling the calyces of Held. (B) Schematic drawing summarising the localisation of c-Fos-positive neurons within 13 sequential sections of an MNTB from a sound-stimulated CBA mouse (P21). Lateral to the left, scale bar: 100 μm.
Increased expression of Kv3.1b potassium channels in the MNTB of sound-stimulated mice
The lateral to medial MNTB distributions of Kv3.1b channels of control and sound-stimulated (4–12 kHz, 1 h, 75 dB) animals were examined using immunohistochemistry. No potassium channel gradients were observed in the orthogonal axes of the MNTB (dorsal-to-ventral, or rostral-to-caudal), in agreement with previous results in rats (Brew & Forsythe, 2005) and mice (Leao et al., 2006).
Kv3.1b membrane expression was dramatically altered by sound stimulation (Fig. 3; Fig. S2A). Under control (unstimulated) conditions, Kv3.1b channel-immunoreactivity showed gradient expression in the MNTB, with the medial region expressing the strongest immunoreactivity, as previously reported (Leao et al., 2006; Fig. 3A). We assessed our immunohistochemistry data in different animals by measuring the ratio of the OD of neurons in the lateral region (corresponding to stimulated neurons) to that of neurons in the medial region for each MNTB imaged (see Materials and methods for details). The lateral to medial OD ratio under control conditions was 0.89 ± 0.04 (n = 13; Fig. 3B). However, following sound stimulation with 4–12-kHz chirps for 1 h, a large increase in Kv3.1b-immunoreactivity was observed in the lateral MNTB, reversing the normal gradient (high to low expression) from medial/lateral to lateral/medial (Fig. 3A and B). The ratio of lateral/medial OD (relative mean OD) for Kv3.1b channels of MNTB following sound stimulation (1.25 ± 0.08, n = 15) was significantly different to the control value (P = 0.0003, t-test; Fig. 3B).
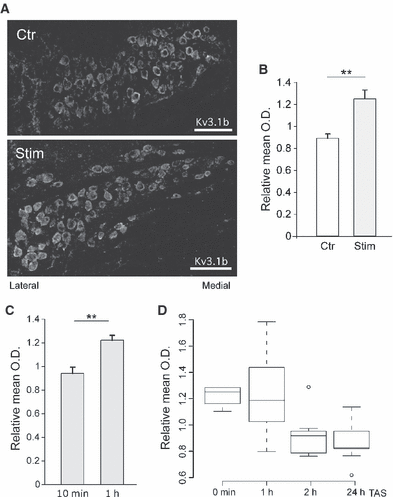
Sound stimulation can rapidly increase potassium channel expression in the MNTB. (A) Micrograph showing typical immunoreactivity of antibodies against Kv3.1b in MNTB sections from control (upper panel) and sound-stimulated (4–12 kHz, 75 dB, 1-h stimulation, 1-h wait before perfusion) mice (lower panel). Scale bar: 100 μm. (B) Bar graph showing relative mean relative optical density (OD) (ratio of lateral/medial mean OD after background subtraction) of Kv3.1b-immunoreactivity in manually outlined neurons from the lateral and medial region of the MNTB of control (open bar) and sound-stimulated mice (grey bar). Mean relative OD lower than 1 indicates predominance of medial immunoreactivity. (C) Relative OD measurements of Kv3.1b-immunoreactivity after varying length of stimulation. (D) Relative mean OD of Kv3.1b-immunoreactivity after varying the time after stimulation (TAS) before transcardial perfusion with fixative. Error bars indicate SEM and statistically significant differences are shown as **P < 0.005.
Changes in Kv3.1b protein membrane expression were dependent on both stimulus and TAS (Fig. 3C and D). No upregulation in Kv3.1b protein membrane expression in lateral cells was observed after 10 min of sound stimulation and immediate perfusion with fixative (relative mean OD: 0.94 ± 0.05 vs. 1.22 ± 0.04 for 1 h stimulation and immediate perfusion, n = 10, P = 0.001, t-test; Fig. 3C). Sound presentation for 30 min generated Kv3.1b-immunoreactivity that was not evenly distributed among cells, with some intensely labelled lateral neurons and others weakly stained (data not shown). Sound-stimulated mice killed immediately and 1 h after 1-h sound stimulation (TAS = 1 h) showed similar relative mean OD (1.25 ± 0.08, n = 8), for TAS = 2 h and TAS = 24 h the relative mean ODs were 0.92 ± 0.06 (n = 8) and 0.87 ± 0.05 (n = 9), respectively (Fig. 3D). Differences in relative mean OD for different TAS were significant according to a one-way anova test (P = 0.001).
Pre- and postsynaptic effects of sound stimulation on Kv3.1b expression were analysed by co-labelling sections with anti-VGLUT1 antibody. Colocalised Kv3.1b/VGLUT1 labelling was obtained by underlying individual cells in the Kv3.1-labelled sections and using ‘thresholded’ (Otsu, 1979) VGLUT1 sections as a mask (pixels were considered colocalised if they are contained within the mask). The uncolocalised (Kv3.1b and VGLUT1) relative mean OD was equal to 0.85 ± 0.05 for control and 1.36 ± 0.16 for stimulated (1-h sound stimulation, no TAS) mice (n = 9, P = 0.02; Fig. 4–n refers to the number of sections analysed). However, the relative mean OD for colocalised Kv3.1b and VGLUT1 was not significantly different between control and stimulated animals (0.99 ± 0.04 for control and 1.03 ± 0.04 for stimulated mice, n = 9, P = 0.25; Fig. 4).
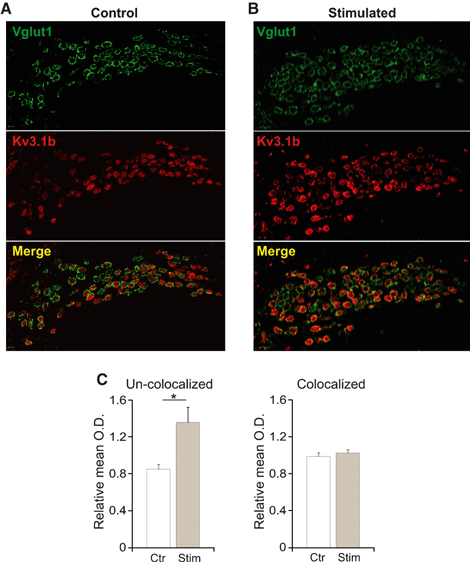
Sound stimulation increases potassium channel expression pre- and postsynaptically. (A-B) Micrographs showing immunoreactivity of antibodies against vesicular glutamate transporter 1 (VGLUT1; green) and Kv3.1b (red) in MNTB sections from control (A) and sound-stimulated (4–12 kHz, 75 dB, 1-h stimulation, no TAS) mice (B). (C) Relative mean optical density (OD) of Kv3.1b expression uncolocalised (left panel) and colocalised (right panel) with VGLUT1. Error bars indicate SEM and statistically significant differences are shown as *P < 0.05.
We also used MAP2A,B antibody to mark the postsynaptic cell and Kv3.1b proteins. In a control animal MAP2A,B/Kv3.1b both colocalised and non-colocalised OD (not relative mean OD) were greater in the medial region than in the lateral (colocalised OD = 0.35 ± 0.03 vs. 0.24 ± 0.02, respectively, n = 40 cells, P = 0.005; non-colocalised OD = 0.29 ± 0.04 vs. 0.18 ± 0.02, respectively, n = 40, P = 0.02; Fig. S2C and D). However, in a sound-stimulated animal, no significant differences in OD were found between medial and lateral cells (colocalised OD = 0.35 ± 0.03 vs. 0.42 ± 0.04, respectively; non-colocalised OD = 0.35 ± 0.04 vs. 0.34 ± 0.02, respectively; supporting information Fig. 2C and D). No detectable Kv3.1b gradient or labelling was observed when sections were incubated with the antibody-blocking peptide (Fig. S1).
Increased outward potassium currents in MNTB neurons from sound-stimulated mice
Electrophysiological experiments were carried out in slices from animals killed after exposure to sound (4–12 kHz) for 1 h. A fluorescent dye (Alexa-488) was routinely added to the electrode internal solution in order to determine the location of each neuron recorded in the MNTB, for both control and acoustically stimulated mice (Fig. 5A and B). Whole-cell patch-clamp recordings of MNTB neurons showed no changes in passive membrane properties (resting membrane potential, input resistance or cell capacitance) in sound-stimulated vs. control animals, suggesting a lack of significant change in resting conductance channels (including two-pore potassium leak channels –Berntson & Walmsley, 2008). However, lateral MNTB cells from sound-stimulated mice exhibited significantly larger outward current in response to voltages greater than −40 mV (P < 0.05) and P < 0.005 for voltages greater than −34 mV, compared with control lateral neurons (n = 41; Fig. 5B and C, left). At +20 mV, steady-state (measured about 500 ms after the onset of the test pulse) whole-cell currents recorded in normal ACSF were equal to 4.54 ± 0.21 nA in lateral cells of sound-stimulated mice and 3.10 ± 0.23 nA in control mice (n = 41, P = 2.56 × 10⁻⁵; Fig. 5B and C). Medial MNTB neurons from sound-stimulated and control mice showed no difference in steady-state current amplitudes (Fig. 5B and C).
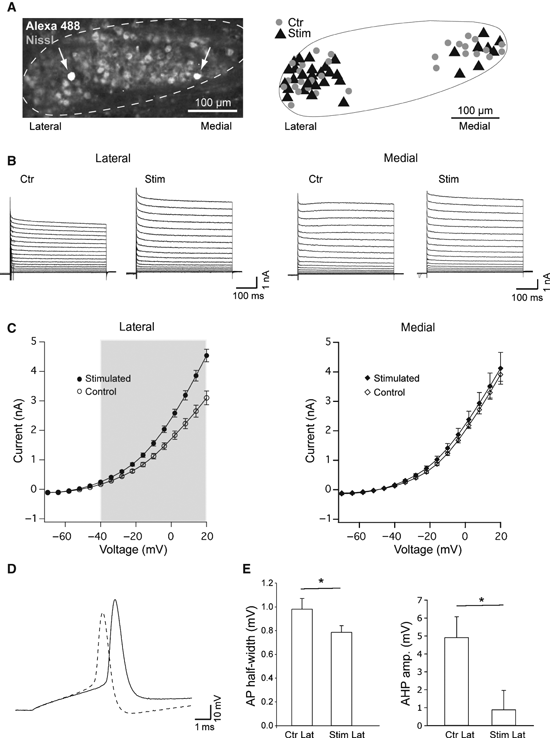
Sound stimulation increases high-threshold voltage-dependent potassium currents in MNTB neurons. (A) Confocal image of an MNTB (outlined) slice (Nissl stain, light grey) showing the location of a medial cell and a lateral cell, filled with Alexa488 (arrows). Right: schematic drawing demonstrating the location of MNTB neurons of control (•, n = 30) and stimulated (, n = 32) animals, from which electrophysiological recordings were obtained. Lateral to the left, scale bar: 100 μm. (B) Example of current response to voltage steps (command voltage ranging from −70 to ± 44 mV) from control/stimulated lateral (left) and control/stimulated medial MNTB neurons (right). (C) Left: current–voltage (membrane voltage) plot showing significant difference between the average current responses from acoustically stimulated lateral neurons (•, n = 23) and lateral control cells (○, n = 18). Right: current–voltage plot showing no difference between the average current responses of medial cells from stimulated animals (♦, n = 9) and control animals (⋄, n = 13) (grey rectangles contain data points with significant difference in the mean; P < 0.05, t-test). (D) Examples of AP generated by the injection of a 150-pA current step in a control/lateral cell (solid line) and a stimulated/lateral cell (dashed line). (E) Summary of AP HW and AHP for control/lateral and stimulated/lateral neurons. Error bars indicate SEM and statistically significant differences are shown as *P < 0.05.
Firing properties of control and sound-stimulated MNTB neurons (lateral) were assessed using current steps varying from 50 to 300 pA (200-ms duration). As expected, cells fired between 1 and 5 APs for each current step that produced depolarisations above threshold in neurons from both control and sound-stimulated animals (no statistical difference between the two groups). AP threshold (voltage at dV/dt > 10 mV/ms) and amplitude showed no significant difference between the two groups. AP half-width (HW) and afterhyperpolarisation valley (AHP; measured as the lowest deflection after AP peak in relation to the resting membrane potential) were significantly different between neurons from control and sound-stimulated animals. During 150-pA steps, the HW of the first AP in the step was equal to 0.98 ± 0.09 and 0.78 ± 0.05 ms for lateral MNTB neurons from control and sound-stimulated animals, respectively (n = 34, P = 0.04, t-test; Fig. 5D and E). Also, in response to a 150-pA current step AHP was equal to 4.90 ± 1.15 mV (control) and 0.17 ± 1.10 mV (sound-stimulated; n = 34, P = 0.003, t-test; Fig. 5D and E).
We pharmacologically isolated high-threshold current by adding 1 mm TEA to the perfusate (Fig. 6). The TEA-sensitive (digitally subtracted) currents for lateral MNTB cells are shown in Fig. 6B. Steady-state TEA-sensitive currents were significantly greater for sound-stimulated cells from voltage steps greater than 0 mV (n = 13, P < 0.05, t-test; Fig. 6C). For example, at 2 mV, the TEA-sensitive current was equal to 0.51 ± 0.20 and 1.22 ± 0.32 nA in neurons from control and sound-stimulated animals.
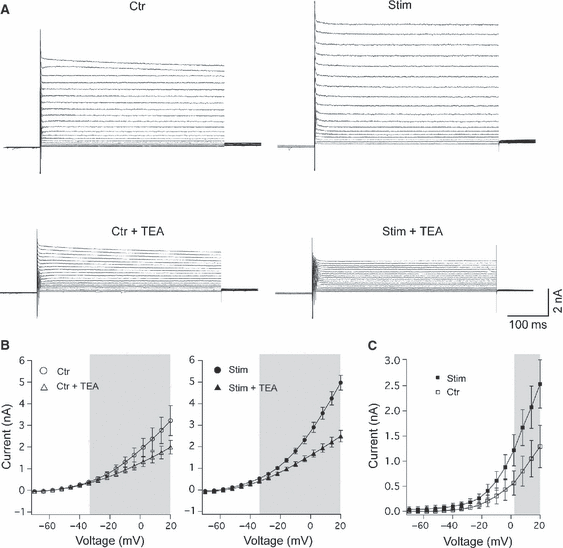
MNTB neurons from sound-stimulated mice show greater tetraethylammonium (TEA)-sensitive current. (A) Example current responses to voltage steps (command voltage ranging from −70 to ± 44 mV) from a control and stimulated lateral MNTB neuron before and after bath application of TEA (1 mm). (B) I–V graph showing average currents before and after the addition of TEA for control and sound-stimulated lateral MNTB neurons. (C) I–V graph showing the average TEA-sensitive currents (digitally subtracted) for control (open circles, n = 6) and stimulated (filled circles, n = 5) lateral MNTB cells. Error bars indicate SEM and grey rectangles contain data points with significant difference in the mean; P < 0.05, paired t-test.
Neurons from sound-stimulated mice show greater levels of repolarisation during high-frequency firing
The ability of lateral MNTB neurons to generate APs at high frequency was investigated by injecting current pulses at 166, 250 and 500 Hz via the patch electrode (Fig. 7). We estimated the strength of repolarisation by integrating membrane voltage (normalised by the mean AP amplitude of each current trace) in response to current pulses. Lateral cells from sound-stimulated animals showed a smaller area under the curve (produced by the normalised membrane depolarisation response) for all the pulse frequencies (control: 19.66 ± 2.04, 20.57 ± 2.25 and 16.88 ± 1.21 ms; stimulated: 11.79 ± 1.65, 16.01 ± 1.38 and 13.24 ± 1.18 ms, for 166, 250 and 500 Hz, respectively; n = 15, P = 0.005, 0.049 and 0.026, respectively; t-test). In four cells we used a simulated Kv3.1 current using dynamic-clamp (and bath-applying 1 mm TEA to block the native Kv3.1 current). Maximal Kv3.1 conductance (g) was extrapolated from the TEA-sensitive current/voltage relationship from cells from control and sound-stimulated animals for a potential equal to 40 mV. For a g = 30 nS (equivalent to a lateral cell from a non-stimulated animal), AP HW was equal to 1.03 ± 0.09 ms, while for a g = 45 nS, AP HW was equal to 0.85 ± 0.07 ms (n = 4, P = 0.037, paired t-test). Recordings using g = 45 nS also showed a smaller area under the curve for all the pulse frequencies (g = 30 nS: 24.40 ± 5.99, 23.03 ± 5.01 and 21.16 ± 44.44 ms; g = 45 nS: 17.66 ± 3.44, 17.71 ± 3.26 and 15.62 ± 2.61 ms, for 166, 250 and 500 Hz, respectively; n = 4, P = 0.048, 0.043 and 0.039, respectively; paired t-test).
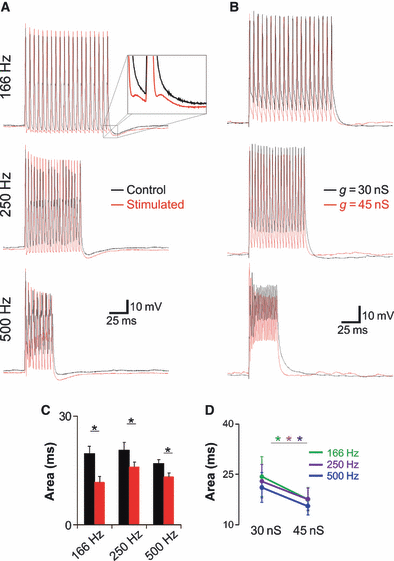
Neurons from sound-stimulated mice fire briefer APs in response to high-frequency current pulses. (A) Current-clamp response to 166, 250 and 500 Hz stimulation train (2 nA, 0.5-ms pulse duration) from a control (black line) and stimulated (red line) MNTB neuron. (B) Similar to (A), but black traces are cell responses using a simulated Kv3.1 current (with 1 mm TEA in the bath) with g = 30 nS (black traces) and g = 45 nS (red traces). (C) Summary of the integral value (area underneath the curve) of current clamp (normalised by dividing the trace mean AP amplitude of each repetition) recordings in response to 166, 250 and 500 Hz for control/lateral (black bars) and stimulated/lateral (red bars) (*P ≤ 0.05, t-test). (D) Summary of the integral value of normalised current-clamp recordings in response to 166 Hz (green trace/circles), 250 Hz (purple trace/circles) and 500 Hz (blue trace/circles) for (dynamic-clamp) Kv3.1 g = 30 and g = 45 nS.
Discussion
This study demonstrates that a relatively short in vivo sound stimulation can induce significant changes in the functional expression of high-threshold K+ channels and in the firing properties of MNTB neurons. Our results were consistent with a recent report from Strumbus et al. (2010) that demonstrated an increase in Kv3.1b expression in MNTB of rats induced by sound stimulation. In this work, we not only show a similar change in mice using immunohistochemistry, but we also show the functional effect of this increased expression using electrophysiology. In addition, we performed colocalisation studies with Kv3.1b and the presynaptic marker VGLUT1 and the soma/dendrite marker MAP2A,B.
Our experiments used c-Fos labelling to show that a 4–12-kHz chirp could activate a large proportion of neurons clustered in the lateral region of the MNTB. The large cell population activated by the 4–12-kHz sound stimulus permitted us to target ‘activated’ neurons for patch-clamp recordings. A 75-db sound level was enough to elicit an increase in neuronal activity in auditory brainstem nuclei. Previous studies have shown that sound levels above 55 dB result in reliable c-Fos expression in the MNTB (Brown & Liu, 1995), while sound levels above 100 dB are harmful and can cause tinnitus-like symptoms on auditory neurons (Basta & Ernest, 2004; Ma et al., 2006).
To estimate changes in Kv3.1b expression gradients by immunohistochemistry, we first used collapsed z-stacks to compensate for slicing/slide mounting artefacts and then normalised the OD according to the ipsilateral medial MNTB. It has been shown by previous studies that Kv3.1b channels show a tonotopic gradient of expression, with stronger immunoreactivity in the medial region of the MNTB (Li et al., 2001; Leao et al., 2006). However, quantification of protein expression using immunohistochemistry is known to be problematic and require a standard curve of antigen expression for each antibody and each tissue analysed (True, 2008). In order to avoid these caveats, we have not attempted to quantify Kv3.1b expression using absolute fluorometry. Instead, we use ratios of medial vs. lateral OD. Here, we found a significant increase in membrane Kv3.1b-immunoreactivity of laterally located MNTB cells after 1 h of sound stimulation. In fact, this increase was large enough to mask the normally observed gradient of Kv3.1b expression in the MNTB. In addition to a postsynaptic increase in the lateral/medial ratio of Kv3.1b, we also noted a presynaptic change in Kv3.1b expression. Sections of sound-stimulated animals showed an increase in the lateral/medial ratio of Kv3.1b colocalised with VGLUT1 (presynaptic marker; Leao et al., 2006). In fact, in control animals, the presynaptic terminals are almost devoid of Kv3.1b. These findings were supported by a double-labelling experiment using MAP2A,B (postsynaptic marker; Leao et al., 2008), showing an intensification of non-colocalised Kv3.1b staining in the lateral MNTB of sound-stimulated animals. The functional relevance of Kv3.1b-increased expression in the presynaptic terminal would be an interesting topic for future studies. While our results demonstrate an increase in Kv3.1b expression, a parallel change in Kv3.1a expression cannot be ruled out. The Kv3.1a splice variant, detectable as early as embryonic day 17 in mice, persists into adulthood, while the Kv3.1b splice variant shows a dramatic increase in expression at about postnatal day 8–14, earlier than the age used in this study (average P20; Macica et al., 2003).
Increased neuronal activity has been reported to briefly affect the phosphorylation state of Kv3.1b channels, which can increase and decrease within minutes (Song et al., 2005). Hence, changes in anchored Kv3.1b phosphorylation state rather than new channels anchoring to the membrane could account for the increase in current reported here. However, the effect of dephosphorylation caused by sustained depolarisation shown by Song et al. (2005) lasted only for a few minutes, while the changes in high-threshold K± currents shown here last for hours in slices and for at least 1 h in vivo. In addition, the Kv3.1b antibody used in this study binds to the intracellular C-terminus (residues 567–585) of the rat Kv3.1b (Materials and methods), while the phosphorylation site reported by Song et al. (2005) is on residue 503, making the antibody ‘insensitive’ to the Kv3.1b phosphorylation state. While a change in the phosphorylation of ion channels is a fast way to increase/decrease ionic currents, increase in protein expression at the cell membrane represents a further ‘consolidation’ of these currents (Greer & Greenberg, 2008).
The increase in the expression of Kv3.1b underlying channel could be caused by an increase in trafficking of Kv3.1b channels from other intracellular domains (Loewen et al., 2009) or an increase in Kv3.1b gene transcription. A recent study has found that neuronal activity can modulate the trafficking of Kv4.2 channels to/from the plasma membrane (Kim et al., 2007; reviewed in Heusser & Schwappach, 2005). In addition, neuronal activity can trigger the transcription of over 300 genes, including the promoter of the Kv3.1 K+ channel gene that is regulated by the Ca2+–cAMP-responsive element that binds CREB (cAMP response element-binding protein; Lin et al., 2008). CREB is a mediator of transcription triggered by activity (Lin et al., 2008), and its expression has previously been shown to be decreased in hearing-impaired mice (von Hehn et al., 2004). The decrease in CREB was directly correlated to a decrease in Kv3.1 expression in the MNTB (von Hehn et al., 2004). However, future experiments will be required to determine the molecular mechanism(s) underlying the observed increase in Kv3.1b expression.
Concomitantly with the changes in Kv3.1b labelling, we observed a significant increase in voltage-dependent outward currents in sound-stimulated animals. The voltage dependence of these currents suggests that the main increase is in the high-threshold K+ current, normally carried by Kv3.1 channels in MNTB cells (Wang et al., 1998; Dodson et al., 2002; Leao et al., 2006). The high-threshold K+ current in MNTB cells activates (10% of the maximum conductance) about −30 mV (Wang et al., 1998; Leao et al., 2006), and the increased outward current is observed at potentials greater than −40 mV. A significant involvement of a high-threshold Kv3 current is supported by blocking of the currents using 1 mm TEA (Leao et al., 2006), as this concentration is relatively specific for Kv3 channels, and much higher concentrations (IC50 = 11.8 mm) are required to block the slow delayed rectifier (Kv2.2) current in MNTB neurons (Johnston et al., 2008).
Increased Kv3.1b-immunoreactivity of MNTB neurons was observed after 1-h sound stimulation, and also with 1-h sound stimulation followed by 1-h TAS prior to perfusion (Fig. 2C). Our usual protocol of waiting 1 h following sound stimulation before immunohistochemical processing was intended to match the 1-h incubation (35°C) in ACSF of brain slices preceding electrophysiological recordings. We could not use our thick slices from electrophysiological recordings for post hoc immunohistochemistry due to poor antibody penetration and uneven labelling. In addition, the time required for patch-clamp recordings would complicate the interpretation of the temporal changes in Kv3.1b expression. Our patch-clamp recordings were carried out within a maximum of 4 h after the 35 °C incubation (see Materials and methods). While the Kv3.1b-immunoreactivity returned to a normal topographic gradient expression after waiting 2 h before killing animals (that had been sound stimulated for 1 h), we did not observe any time-dependent reduction in K+ currents within this period if slices were maintained in the holding chamber. Hence, the rapid decline in Kv3.1b expression in living animals seen after 2 h TAS (followed by acute perfusion with fixative) may not be observed in the in vitro tissue, possibly due to slower or disturbed cellular processes.
High-threshold voltage-gated K+ current provide an effective mechanism to permit neurons to respond to high-frequency inputs (Wang et al., 1998). By activating above threshold and rapidly deactivating, the Kv3.1-based current truncates the AP before it reaches excessively depolarised potentials, thus reducing Na+ channel inactivation. Our results demonstrated that lateral MNTB neurons of sound-stimulated animals fire significantly shorter APs, possibly due to an increase in Kv3.1 expression. Our dynamic-clamp experiments showed that a larger Kv3.1 conductance (similar to that observed in our voltage-clamp recordings) is enough to significantly decrease AP HW, improving the cell’s response to high-frequency stimuli.
Previous studies in which sound activity was suppressed or abolished have shown that Kv expression is dynamically regulated by sensory input. For example, in the bird auditory system, cochlear removal causes a rapid (after 3 h) and dramatic reduction in Kv1.1- and Kv3.1-immunoreactivity (Lu et al., 2004). However, 24 h after ablation, the expression of Kv3.1 channels was similar to non-ablated animals, while Kv1.1 levels recovered in 2 weeks (Lu et al., 2004). Studies in deaf and hearing-impaired mice also showed that normal topographic Kv3.1 and Kv1.1 channel gradients in MNTB are absent in these animals (von Hehn et al., 2004; Leao et al., 2006). Studies of MNTB neurons in the deaf (dn/dn) mouse have shown a significant reduction of the low-threshold K+ current (reduced expression of dendrotoxin-sensitive Kv1 channels) compared with normal mice (Leao et al., 2004). The dn/dn mouse experiments examined membrane properties of neurons in an auditory system that developed without spontaneous or sound-evoked neuronal activity, and cochlea ablation and deafening experiments relate to pathological alterations in sensory activity. In contrast, the present study has examined the acute effects of increased acoustically driven activity in an auditory system that has developed normally (both spontaneous and afferent activity). Here, we have extended previous observations using electrical stimulation in slices (Song et al., 2005) to directly demonstrate that changes in acoustic input in normal hearing mice can lead to functional changes in specific membrane currents, in particular high-threshold potassium currents, and that these changes can alter the firing properties of the neurons subjected to increased activity.
Acknowledgements
This work was supported by grants from the NIH (NS25547), and the National Health and Medical Research Council of Australia. R.N.L. is supported by a long-term fellowship from the International Human Frontier Science Program.
Abbreviations
-
- ACSF
-
- artificial cerebrospinal fluid
-
- AHP
-
- afterhyperpolarisation
-
- AP
-
- action potential
-
- AVCN
-
- anteroventral cochlear nucleus
-
- CREB
-
- cAMP response element-binding protein
-
- HW
-
- half-width
-
- LSO
-
- lateral superior olive
-
- MAP
-
- microtubule-associated protein
-
- MNTB
-
- medial nucleus of the trapezoid body
-
- OD
-
- optical density
-
- PBS
-
- phosphate-buffered saline
-
- TAS
-
- time after stimulation
-
- TEA
-
- tetraethylammonium
-
- VGLUT1
-
- vesicular glutamate transporter 1


