Audition differently activates the visual system in neonatally enucleated mice compared with anophthalmic mutants
Abstract
The occipital cortex, normally visual, can be activated by auditory or somatosensory tasks in the blind. This cross-modal compensation appears after early or late onset of blindness with differences in activation between early and late blind. This could support the hypothesis of a reorganization of sensory pathways in the early blind that does not occur in later onset blindness. Using immunohistochemistry of the c-Fos protein following a white noise stimulus and injections of the anterograde tracer dextran-biotin in the inferior colliculus, we studied how the occurrence of blindness influences cross-modal compensation in the mutant anophthalmic mouse strain and in C57BL/6 mice enucleated at birth. We observed, in mutant mice, immunolabeled nuclei in the visual thalamus – the dorsal lateral geniculate nucleus – in the primary visual area (V1) and a few labeled nuclei in the secondary visual area (V2). In enucleated mice, we observed auditory activity mainly in V2 but also sparsely in V1. No labeled cells could be found in the visual thalamus. Tracing studies confirmed the difference between anophthalmic and birth-enucleated mice: whereas the first group showed inferior colliculus projections entering both the dorsal lateral geniculate and the latero-posterior nuclei, in the second, auditory fibers were found only within the latero-posterior thalamic nucleus. None was found in controls with intact eyes. We suggest that the prenatal period of spontaneous retinal activity shapes the differences of the sensory reorganization in mice.
Introduction
Several animal models have been used to study the mechanisms underlying cross-modal plasticity. In particular, activation of the occipital cortex by non-visual stimuli has been demonstrated in blind animals. For instance, auditory activation of the occipital cortex was demonstrated in the blind mole rat using electrophysiology and 2-deoxyglucose techniques (Heil et al., 1991; Bronchti et al., 2002). In the same species, stimulation of the facial vibrissae was also reported to activate the occipital cortex (Necker et al., 1992; Bronchti et al., 2002). Similar activation of the visual cortical areas by auditory stimuli has been shown in neonatally enucleated hamsters (Izraeli et al., 2002), in an anophthalmic mouse strain (Bonaventure & Karli, 1968; Pichéet al., 2004) and in neonatally enucleated opossums (Kahn & Krubitzer, 2002; Karlen et al., 2006). Somatosensory stimuli also activate the visual cortex in neonatally enucleated rats (Toldi et al., 1994b). Single-neuron recordings demonstrate that auditory and haptic stimuli activate neurons in the anterior ectosylvian visual area in neonatally visually deprived cat (Rauschecker & Korte, 1993).
This cortical activation seems to be of subcortical origin in the blind mole rat as the dorsal part of the lateral geniculate nucleus (LGNd) was shown to be activated by auditory stimuli (Bronchti et al., 1989). Moreover, an axonal tracing study demonstrated a neuronal connection between the inferior colliculus (IC) and the LGNd in this subterranean blind mammal (Doron & Wollberg, 1994). A similar IC–LGNd connection was shown to give rise to the auditory activation of the occipital cortex in neonatally enucleated hamsters (Izraeli et al., 2002) and in ZRDCT/An mice (Pichéet al., 2004). The mutant mouse ZRDCT/An is studied as a model of human anophthalmia (Tucker et al., 2001) and certainly constitutes the earliest visual deafferentation known in mammals in view of the fact that its retinal axons never reach the thalamus (Chase, 1945). In non-human primates, the existence of projections from primary and secondary auditory fields to striate and extra-striate cortex have been described (Falchier et al., 2002; Schroeder & Foxe, 2005).
All the animals cited above were used to demonstrate cross-modal compensation occurring after early visual deprivation. The comparison between all these models is difficult: hamsters and opossums are altricial species (Clancy et al., 2001); the rat is the only non-altricial species in which cross-modal activation of the visual cortex was reported after postnatal enucleation; by contrast, anophthalmic mice mimic enucleation of mice at embryonic but not at postnatal ages (Cüllen & Kaiserman-Abramov, 1976; Kaiserman-Abramov, 1983). None of these studies reported, in the same species, the outcome of a later destruction of the visual periphery. In human functional magnetic resonance imaging studies, evidence of functional connectivity between sensory areas has been shown (Watkins et al., 2006) and differences in functional abilities have been described between early and late onset of blindness in humans (Buchel et al., 1998; Sadato et al., 2002; Wittenberg et al., 2004; Pascual-Leone et al., 2005). Recently, it has been shown that a repetitive transcranial magnetic stimulation applied onto the primary somatosensory cortex activates the peristriate cortex in early-blind but not in late-blind individuals (Wittenberg et al., 2004). Differences in the distribution of cortical activation following early and late onset of blindness clearly suggest that the time at which vision loss occurs influences the functional and anatomical compensatory mechanisms.
The main objective of the present study was to compare the functional and anatomical effect of an early vs. a later onset of blindness in the same species. To that end, the auditory activity and subcortical connections of visual centers were compared in the ZRDCT/An mouse, a congenital anophthalmic mutant, with those found in normal C57BL/6 mice enucleated at birth.
Materials and methods
Mice
The different animals used in our investigation are detailed in Table 1. The ZRDCT/An anophthalmic mice (n = 14) were born and raised in our inbred colony. This mutant mouse was first described by Chase & Chase (1941) and is particular in that it lacks eyes and optic nerves. No other effect of the mutation has been described. Birth-enucleated mice were of the C57BL/6 strain (n = 14) and intact C57BL/6 mice served as controls (n = 14). The latter strain is closely related to the ZRDCT/An mice and has also been used as a control by Chase & Chase (1941), Kaiserman-Abramov (1979, 1980, 1983) and Olavarria & Van Sluyters (1984). All animals were adults when killed. For the c-Fos study, the animals were between 85 and 120 days; for the tracing study, the animals were between 60 and 150 days of age. All animals were kept in our laboratory facilities with a light/dark cycle of 14/10 h, respectively. All experimental procedures were approved by the University Animal Care Committee and were carried out in accordance with the guidelines set out by the Canadian Council on Animal Care.
| Experiment and strain | Number of animals | Mean age (days) |
|---|---|---|
| c-Fos | ||
| Control | 10 | 102 |
| Enucleated | 10 | 103 |
| Mutant | 10 | 103 |
| Neuronal tracing | ||
| Control | 4 | 105 |
| Enucleated | 4 | 98 |
| Mutant | 4 | 113 |
Neonatal enucleation
Bilateral enucleations were performed on C57BL/6 mice pups within 24 h of birth. The mother and at least one pup from each litter were transferred to a new cage while the other pups were kept in the nesting cage until the end of the procedure (about 30 min). Under deep anesthesia by hypothermia, the palpebral fissure was opened with a scalpel and the eyeball pushed out with forceps. The optic nerve and the ophthalmic artery were then sectioned. Ocular orbits were filled with Gelfoam (Upjohn, Kalamazoo, MI, USA) to avoid hemorrhage. The pups were kept warm under a heat lamp before being returned to the nest. From each litter, about half of the pups underwent the surgical enucleation while the others were kept as intact controls. The nest cage was returned to the colony and the mother and the pup re-introduced into the nest cage.
c-Fos experiment
Under light anesthesia by isoflurane inhalation (Aerrane; Janssen Pharmaceutica, Beerse, Belgium), a silicon plug was placed in the right external ear canal to ensure asymmetrical auditory stimulation. This procedure is useful to authenticate the auditory origin of the activation observed in visual structures (Heil & Scheich, 1986; Bronchti et al., 1989). Mystacial whiskers were trimmed to skin level to limit somatosensory activation. Each animal (see Table 1) was then placed in a custom-made anechoic chamber overnight. The next morning, the mice were stimulated with white noise bursts randomly delivered through two loudspeakers, at an intensity of 90 dB sound pressure level for 60 min after which they were anesthetized with a lethal injection of sodium pentobarbital (Somnotol, MTC Pharmaceuticals, Cambridge, Ontario, Canada; 120 mg/kg i.p.). The animals were then perfused transcardially with 0.01 m phosphate-buffered saline (PBS) followed by 4% paraformaldehyde in 0.1 m phosphate buffer, pH 7.4 (PB). The brains were dissected out and were carefully examined along the ventral surface to confirm the absence of optic nerves in the enucleated and the ZRDCT/An mice. About 10% of ZRDCT/An mice have one or two eye remnants or even an occasional eye with a lens, although the latter is never fully normal sized (Chase, 1945). The brains were postfixed for 2 h and cryoprotected in 30% sucrose for about 24 h. Frozen serial sections were cut (50 µm) in the coronal plane and collected in two sets, one processed for c-Fos immunohistochemistry and the other counterstained with Cresyl Violet for the cytoarchitectonic identification of subcortical structures and cortical areas. The immunohistochemical free-floating procedure used a rabbit polyclonal anti-c-Fos (Ab-2) antibody (Calbiochem, San Diego, CA, USA, 1 : 20 000 dilution), a biotinylated goat anti-rabbit secondary antibody (Vector Laboratories, Burlington, Ontario, Canada, 1 : 500 dilution), avidin–biotin complex (Elite Vectastain, Vector Laboratories), and a nickel-intensified 3,3-diaminobenzidine (DAB) protocol. A few sections were examined under the microscope before stopping the reaction. This was done to ensure maximal staining of the labeled nuclei, thus limiting variation in staining density. The sections were then mounted on gelatinized slides, air-dried, dehydrated and cover-slipped. Control sections from each brain were processed according to the same immunohistochemical procedure but with the omission of either the primary or the secondary antibody. Under these circumstances, no labeled nuclei could be identified in all the structures examined.
Cell counts in the auditory and visual cortices and inferior colliculus
In order to compare the auditory activity within the structures of interest (SOI) in the different experimental groups (control mice; mutant mice; enucleated mice), the total number of c-Fos-immunoreactive (IR) nuclei was estimated in each SOI using the optical fractionator, an unbiased stereological procedure (West et al., 1991). Every fourth coronal section (50 µm thick), processed for c-Fos immunoreactivity and cut through either the primary auditory cortex (AC), the primary visual cortex (V1), the lateral and medial secondary visual cortex (V2l and V2m, respectively) or the inferior colliculus (IC) were analyzed on a Leica DMRB microscope (Leica Microsystems, North York, Ontario, Canada) equipped with a three-axis computer-controlled stepping motor system (0.1-µm resolution) coupled to a personal computer and to a color CCD camera (Optronix, MicroBrightField, Williston, VT, USA). Only structures contralateral to the stimulated unplugged ear were sampled because of the asymmetrical auditory stimulation leading to an asymmetrical labeling of c-Fos nuclei. The auditory thalamic nucleus – the medial geniculate – was not selected as a structure of interest in our quantification protocol, even if this structure is strongly activated by the auditory stimulus, because of the inconsistent labeling found in its principal, ventral, division (Carretta et al., 1999). The Stereo-Investigator software version 6.0 (MicroBrightField) was used to collect data from ten animals in each of the experimental groups. For each section, the contours of the SOI were first traced at low magnification (2.5×, 0.07 aperture). We applied the cytoarchitectonic criteria described by Caviness (1975) to differentiate occipital and temporal cortices, as the criteria used in delineating these two cortical fields in normal mice are valid in ZRDCT/An and enucleated animals. Then, at high magnification (100×, 1.3 aperture), the optical fractionator probe was applied to count labeled nuclei found within a minimum of ten sites per area. The same sampling probe, with the same sampling grid (210 × 210 µm) and counting frame (100 × 100 µm) parameters was applied to all animals without the experimenter knowing which group they belonged to. Guard zones of 2 µm at the top and bottom of the sections were used. The precision of the sampling is assessed by the Gundersen coefficient of error (CE). This CE represents the precision in the estimation of the population size (Gundersen et al., 1999). It takes into account the distribution of IR nuclei in the tissue, the inter- and intra-section variation and the total number of IR nuclei counted. A lower CE corresponds to a better estimation of the population size. The methodological details describing the design-based stereological study are presented in Table 2.
| IC | LGNd | AC | V1 | V2l | V2m | |
|---|---|---|---|---|---|---|
| Mean no. of investigated sections | 9 | 10 | 7 | 9 | 8 | 8 |
| Mean no. of investigated microscopic fields | 142 | – | 143 | 194 | 143 | 112 |
| Mean section thickness after histologic processing | 15 | – | 14 | 14 | 15 | 14 |
| Settings | ||||||
| Base area (µm2) | 10 000 | – | 10 000 | 10 000 | 10 000 | 10 000 |
| Height (µm) | 11 | – | 10 | 10 | 11 | 10 |
| Guard zones (µm) | 4 | – | 4 | 4 | 4 | 4 |
| Distance between counting spaces (µm) | 210 | – | 210 | 210 | 210 | 210 |
| Mean no. of counted cells | 833 | 57 | 608 | 191 | 173 | 105 |
| Coefficient of error* | Gundersen (m = 1) | – | Gundersen (m = 1) | Gundersen (m = 1) | Gundersen (m = 1) | Gundersen(m = 1) |
- * The m = 1 is used in the newer Gundersen's CE estimate formula (Gundersen et al., 1999).
Cell counts in the dorsal lateral geniculate nucleus
The LGNd in blind mice is a very small structure (Cüllen & Kaiserman-Abramov, 1976). Therefore, the quantification of IR nuclei in the LGNd was not based on a stereological estimation as in other SOI but on the exhaustive count of the c-Fos positively labeled nuclei. To that end, all the 50-µm-thick coronal sections from the LGNd contralateral to the stimulated ear were processed for c-Fos immunochemistry. These animals were the same as those used for the cortical and IC quantifications. As alternate sections were Nissl-counterstained for cytoarchitectonic identification, all labeled nuclei were plotted and counted on every second section. Correspondingly, the distribution shown in the box plots of Fig. 2 represents approximately half the total number of LGNd cells activated by the auditory stimulus in each animal. This procedure of quantifying cells may lead to an overestimation of the total number of cells in the LGNd because we did not use guard zones. Nevertheless, as the section thickness was considerable (50 µm) in comparison with the diameter of the IR nuclei (8 µm on average), the sampling error is small. In fact, very few IR nuclei would have been cut in the lower or higher focal plane of the section and counted by error. Moreover, it should be noted that this error is constant when comparing counts between different animals and any correction factor would yield lower numbers in all groups that would nevertheless be proportional to those presented in Fig. 2.
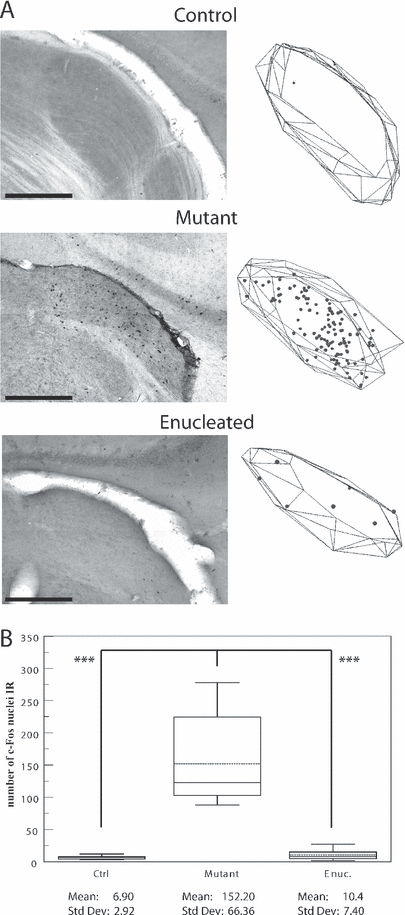
Auditory evoked c-Fos immunoreactivity in the lateral geniculate nucleus dorsal. (A) Photomicrographs of sections demonstrating c-Fos activity in the LGNd contralateral to the stimulated ear in control, mutant and enucleated mice. On the right side of each photograph is displayed the corresponding plot of all the c-Fos--IR nuclei found in four consecutive sections through the visual thalamus. Scale bars, 500 µm (identical for photomicrographs and plots). (B) Box plot describing the distribution of the number of c-Fos-IR nuclei counted in LGNd in each group. Parameters as in Fig. 1. P values obtained with the post hoc test Tamhane are indicated on box plot. Note that the auditory activity can be found in LGNd in mutant mice only. Also, note the reduced size of the LGNd in the mutant and the enucleated mice in comparison with the control mouse. ***P < 0.001.
c-Fos-IR nuclei plotting
To illustrate the distribution pattern of c-Fos-IR nuclei, the contours of AC, V1, V2m, V2l and the LGNd were traced in four consecutive sections using Neurolucida software (MicroBrightField) at low magnification (2.5×). In the same animal, all of the contours belonging to any one SOI were aligned with each other. At a higher magnification (40×) all c-Fos-IR nuclei found in each SOI were plotted. Then, the superposition of contours and markers was processed with the Neuroexplorer software (MicroBrightField) to show the distribution pattern of c-Fos-IR nuclei within each SOI.
Statistical analysis
The significance of differences in the mean values recorded within the SOI of the different experimental groups was tested with a general linear model multivariate analysis followed by the Tamhane post-hoc test. All statistical analyses were carried out with SPSS 12.0 for Windows (SPSS Inc., Chicago, IL, USA) with a significance level of P < 0.05.
Neuronal tracing
For neuronal tracing, a volume of 0.5 µL of biotinylated dextran (BDA) (Molecular Probes, Cedarlane Laboratories, Ontario, Canada) was pressure-injected into the central nucleus of the IC (CIC) of the mice from each group under deep anesthesia. The latter was achieved with an i.p. injection of Atravet (Ayerst, Montreal, Quebec, Canada; 1 mg/kg) followed 5 min later by a combined ketamine and xylazine anesthesia (i.p.; Ketaset; Ayerst and Rompun, Bayer Inc., Toronto, Ontario, Canada; 100 and 4 mg/kg, respectively). The animals were placed in a stereotaxic apparatus and a small amount of Xylocaine 2% (AstraZeneca Canada, Mississauga, Ontario, Canada) was injected locally under the scalp prior to incision. Control mice were protected from ocular dryness by application of an ophthalmic ointment (Polysporin; Pfizer Canada, Toronto, Ontario, Canada). A longitudinal incision was made along the midline and the posterior part of the skull was exposed. Using a surgical microscope, a small craniotomy was performed just posterior to the lambdoïd suture allowing a dorsal view of the IC. The dura-mater over the area of penetration was carefully removed and a glass micropipette (40 µm tip diameter) filled with a 5% solution of BDA (10 000 mol. wt; Molecular Probes, Cedarlane Laboratories, Ontario, Canada) in 0.01 m phosphate-buffered saline (0.9% NaCl, pH 7.4, PBS), was inserted to a depth of 1 mm below the surface of the IC. The pressure injection (microInjector, Tritech Research, Los Angeles, CA, USA) was made over a period of 10 min and the micropipette was left in place for a further 10 min before being carefully withdrawn. The mice were then kept warm until they recovered from anesthesia and postoperative pain was managed with buprenorphine (i.p.; Temgesic, Schering-Plough, Hertfordshire, UK; 0.009 mg/kg) injected 1 h after the surgery.
Following a survival period of 10–14 days and under deep anesthesia obtained with a lethal dose of sodium pentobarbital (i.p.; Somnotol, MTC Pharmaceuticals; 120 mg/kg), the mice were killed and perfused transcardially with 0.01 m PBS followed by 4% paraformaldehyde in 0.1 m PB, pH 7.4. The brains were then dissected out and the absence of optic nerves was checked in blind mice. The brains were postfixed for 2 h in the same fixative and cryoprotected in phosphate-buffered 30% sucrose. Frozen serial sections were cut (50 µm) in the coronal plane. Free-floating sections were treated for 15 min with 0.5% H2O2 and 70% methanol to quench endogenous peroxidase, and thoroughly rinsed in 50 mm Tris-HCl-buffered saline (pH 8.0) containing 0.5% Triton X-100 (TBS-Tx). The sections were then incubated for 90 min at room temperature employing an avidin–biotin complex kit (Elite Vectastain, Vector Laboratories) in TBS-Tx, pH 8.0. Labeled fibers were revealed using the nickel-intensified DAB protocol, in which the sections were incubated in 0.02% H2O2. The sections were mounted in two sets, one directly dehydrated in ethanol, cleared in xylene and cover-slipped with Permount mounting media, and the other counterstained with Cresyl Violet for the cytoarchitectonic delineation of relevant structures.
The BDA-labeled fibers were viewed with a Leica DMRB microscope (Leica Microsystems) and photographed with a CCD camera (Optronix, MicroBrightField) using Picture Frame software (MicroBrightField).
Results
c-Fos experiments
For all experimental animals, a silicon earplug was placed in the right ear (see Materials and methods) and this led to asymmetrical c-Fos labeling in the SOI with stronger labeling on the side contralateral (right) to the auditory stimulation. Only the latter contralateral side was sampled. There are no age differences between the c-Fos experimental groups (F = 0.18, P > 0.05) nor between groups in the tracing experiments (F = 0.136, P > 0.05). The Gundersen CE, which represent the precision in the estimation of the population size, were never higher than 9% in structures where substantial labeled nuclei were observed.
Inferior colliculus
As expected, auditory stimuli induced c-Fos expression in the contralateral IC in all mice (Fig. 1A). The general linear model multivariate analysis revealed no significant difference between experimental groups in their auditory evoked c-Fos activity (Fig. 1B).
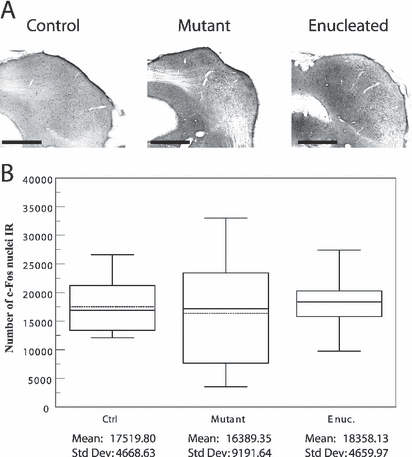
Auditory evoked c-Fos immunoreactivity in the inferior colliculus. (A) Photomicrographs of sections demonstrating c-Fos activity in the IC contralateral to the stimulated ear of control, mutant and enucleated mice. Scale bars = 500 µm. (B) Box plot describing the distribution of the estimated numbers of c-Fos-IR nuclei in the whole inferior colliculus in each group. The horizontal lines indicate the minimum, the 25th percentile, the median, the 75th percentile and the maximum points for each data set. The dashed line indicates the mean. Mean and standard deviation for each group are displayed at the bottom of the box-plot. Note that the auditory activity in IC does not differ among the experimental groups.
Dorsal lateral geniculate nucleus
As shown in Fig. 2A, auditory stimulation activated the primary visual thalamus – the LGNd – only in the mutant mouse. The Tamhane post-hoc test showed that the mutant strain exhibited higher auditory evoked c-Fos activity in LGNd than all the other groups (P < 0.001; Fig. 2B). For this structure, there is no Gundersen CE because of the quantification method used (see Materials and methods).
Auditory cortex
The photomicrographs of contralateral sections and the c-Fos-IR nuclei plots illustrate clearly in all experimental groups that the auditory stimulus activated cortical layers II–III, IV and VI and to a lesser degree layer V of the auditory cortex. Layer IV was the most intensely labeled (Fig. 3A). The Tamhane post-hoc test revealed no significant difference between experimental groups in their auditory-evoked c-Fos (Fig. 3B).
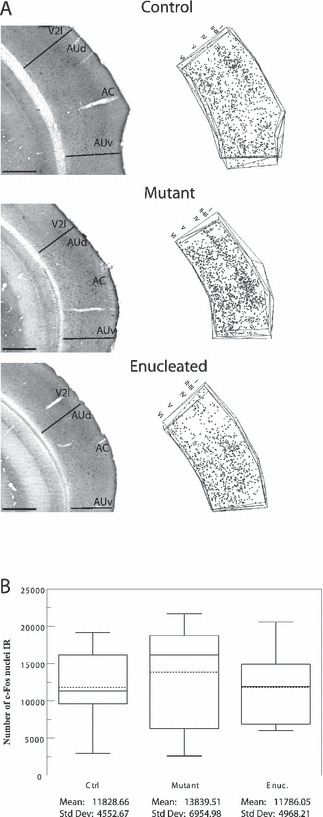
Auditory evoked c-Fos immunoreactivity in the primary auditory cortex. (A) Photomicrographs of sections demonstrating c-Fos activity in the AC contralateral to the stimulated ear in control, mutant and enucleated mice. Arrangement of the pictures and plottings as in Fig. 2. The plotting depicts all the c-Fos-IR nuclei found in four consecutive sections through the temporal cortex. The cortical layers are indicated above the plot. Scale bars, 500 µm (identical for photomicrographs and plots). (B) Box plot describing the distribution of the estimated numbers of c-Fos-IR nuclei throughout AC in each group. Parameters as in Fig. 1. Note that the auditory activity in AC, including the secondary auditory cortex dorsal and ventral (AUd, AUv), does not differ among all the experimental groups.
Primary visual cortex
The plot of the c-Fos-IR nuclei and the photomicrographs (Fig. 4A) show that the auditory stimulation induced c-Fos expression in very few cells in the primary visual cortex in normal mice. These were found mainly in supragranular layers and in layer VI. Labeling was more intense in mutant and enucleated mice, labeled cells being located in layers II–IV and VI. In mutant mice, a distinctly higher density of IR cells was observed in layer IV. The CE in control (up to 16%) and enucleated (up to 18%) mice were particularly high as almost no c-Fos labeling was sampled within the primary visual cortex in these two strains. The Tamhane post-hoc test, performed on the means of experimental groups, revealed that the mutant group exhibited a higher level of c-Fos activity in V1 as a result of the auditory stimulation than either the control (P < 0.002) or the enucleated group (P < 0.01; Fig. 4B).
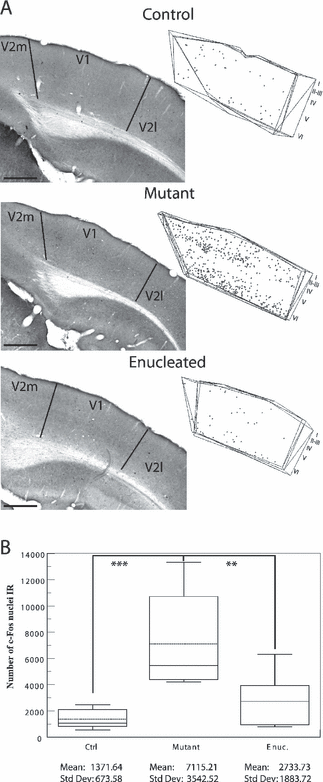
Auditory evoked c-Fos immunoreactivity in the primary visual cortex. (A) Photomicrographs of sections demonstrating c-Fos activity in V1 contralateral to the stimulated ear in control, mutant and enucleated mice. Organization of the pictures and plottings as in Fig. 2. The plotting depicts all the c-Fos-IR nuclei found in four consecutive sections through the occipital cortex. Scale bars, 500 µm (identical for photomicrographs and plots). Note that the auditory activity is mainly present in layers IV and VI in the mutant mice. (B) Box plot describing the distribution of the estimated numbers of c-Fos-IR nuclei throughout V1 in each group. Parameters as in Fig. 1. P values obtained with the post-hoc Tamhane test are indicated on box plot. While the auditory activity in V1 seems to be stronger in the enucleated mice in comparison with the control mice this difference is not statistically significant. **P < 0.01 and ***P < 0.002.
Lateral secondary visual cortex
The photomicrographs and plot of all c-Fos-IR nuclei (Fig. 5A) illustrate that the most intense c-Fos labeling was found in the enucleated animals. This was confirmed by the Tamhane post-hoc test, which revealed that only this group differed from the others (P < 0.01; Fig. 5B). The c-Fos-IR cells were distributed in layers II–III and VI, mainly close to the border with AC, and only a few dispersed cells were found in the bottom half of layer V. Although the number of c-Fos-IR nuclei in the mutant mouse was not different from that in controls, their distribution was similar to that found in the enucleated animals, close to AC. In the mutant and control mice, the CE was as high as 14 and 16%, respectively. This can be explained by the fact that only a few marked c-Fos-IR nuclei were identified within the lateral secondary visual cortex.
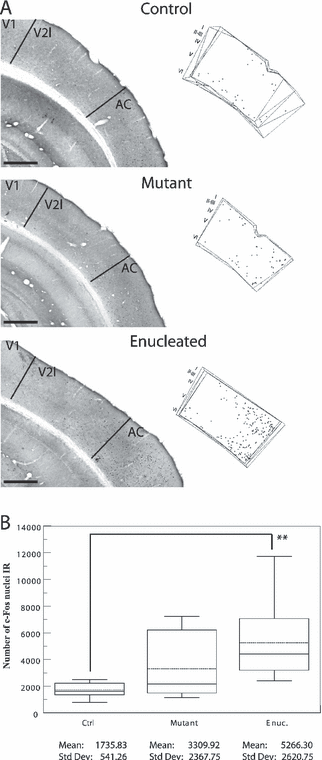
Auditory evoked c-Fos immunoreactivity in the lateral secondary visual cortex. (A) Photomicrographs of sections demonstrating c-Fos activity in V2l contralateral to the stimulated ear in control, mutant and enucleated mice. Organization of the pictures and plottings as in Fig. 2. The plotting depicts all the c-Fos-IR nuclei found in four consecutive sections through the occipital cortex. Scale bars, 500 µm (identical for photomicrographs and plots). Note that the auditory activity in the enucleated mice is mainly present close to the border with AC and in supragranular layers. (B) Box plot describing the distribution of the estimated numbers of c-Fos-IR nuclei throughout V2l in each group. Parameters as in Fig. 2. P values obtained with the post-hoc Tamhane test are indicated on box plot. While the auditory activity in V2l seems to be stronger in the enucleated mice in comparison with the mutant mice this difference is not statistically significant. **P < 0.01.
Medial secondary visual cortex
In controls, the plots of all the c-Fos-IR nuclei and the photomicrographs show only a few dispersed c-Fos-labeled cells. A greater number of cells were observed in mutant and enucleated mice. These cells were evenly distributed throughout all cortical layers except for layer I (Fig. 6A). The Tamhane post-hoc test revealed that enucleated and mutant mice showed higher auditory evoked c-Fos immunoreactivity in V2m than control mice (P < 0.02 and P < 0.05, respectively; Fig. 6B). In the control mice, the CE was also high (up to 22%) due to the fact that only a few c-Fos-IR nuclei were observed within the secondary visual cortex.
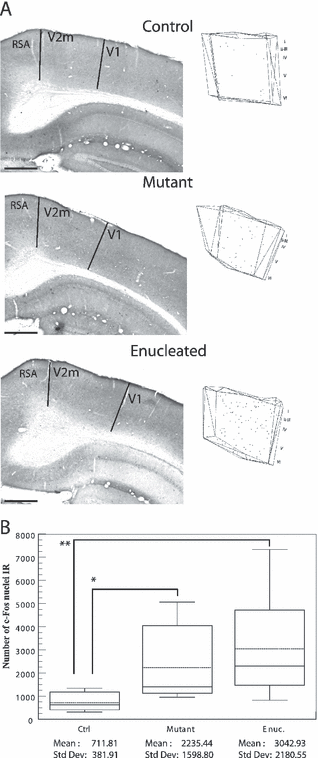
Auditory evoked c-Fos immunoreactivity in the medial secondary visual cortex. (A) Photomicrographs of sections demonstrating c-Fos activity in the V2m contralateral to the stimulated ear in control, mutant and enucleated mice. Organization of the pictures and plottings as in Fig. 2. The plotting depicts all the c-Fos-IR nuclei found in four consecutive sections through the occipital cortex. Scale bars, 500 µm (identical for photomicrographs and plots). Note that the auditory activity in the enucleated mice is evenly distributed in V2m. (B) Box plot describing the distribution of the estimated numbers of c-Fos-IR nuclei throughout V2m in each group. Parameters as in Fig. 2. P values obtained with the post-hoc Tamhane test are indicated on box plot. Note that the difference between enucleated and mutant is not statistically significant. *P < 0.02 and **P < 0.05.
Tracing experiments
Control mice
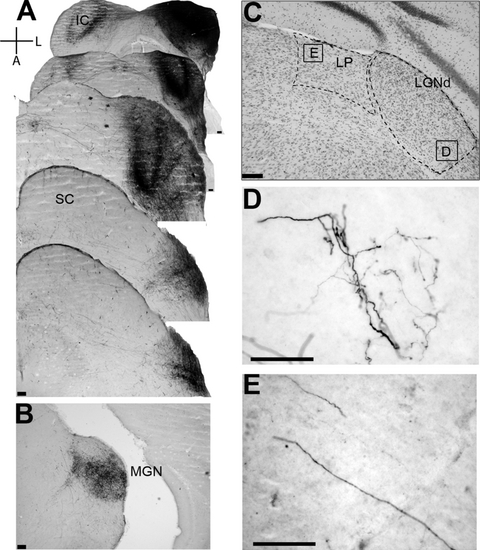
The bulk of the labeled axons followed the usual anterograde trajectory from the CIC through the brachium of the inferior colliculus to the ventral division of the ipsilateral medial geniculate nucleus (MGNv) (Fig. 7A and B). Normal retrograde transport was also noticed to varying degrees in the auditory cortex where cell bodies were clearly seen (see Fig. 10, upper row). The LGNd, the primary retinal thalamic target, was devoid of label in control mice (Fig. 7D). However, in two cases it was possible to observe a few isolated thin and short labeled fibers within the medial part of the thalamic latero-posterior nucleus (LP), a higher-order visual target (Fig. 7E) which receives direct retinal input.
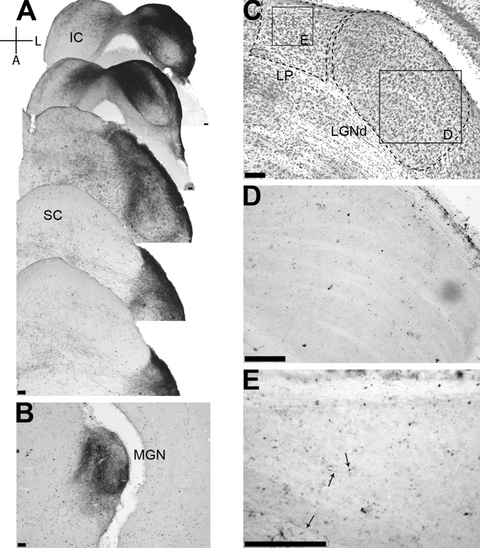
Tracer injection in a C57BL/6 eyed mouse. (A) The injection site of the tracer in the inferior colliculus is presented with photomicrographs of five serial sections that cover the entire extent of the injection. Note that the injection avoids the superior colliculus. (B) Photomicrograph of a section through the medial geniculate nucleus illustrating the terminal arborization of the incoming IC fibers. (C) Photomicrograph of a Nissl-stained coronal section through the visual thalamus. Contours of LGNd and LP are delineated. Squares correspond to the enlarged areas from LGNd and LP presented in D and E, respectively. (D and E) LGNd and LP, respectively, in the section, adjacent to C, reacted for BDA histochemistry. Note that LGNd is devoid of BDA label, while few axons are seen in LP. Scale bars, 100 µm for all photographs.
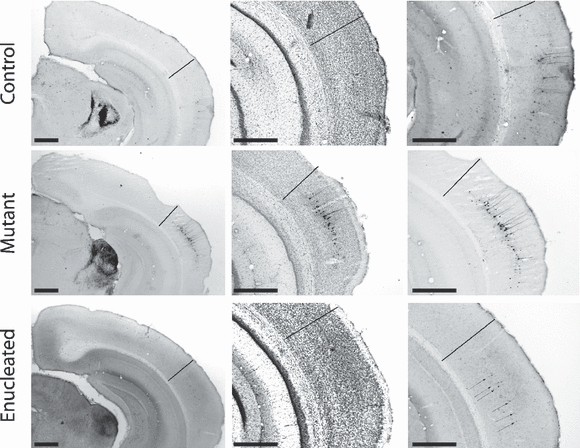
Retrogradely labeled cells in AC following injection of BDA in the inferior colliculus. Series of photomicrographs from coronal sections that have undergone BDA histochemistry. Experimental groups are organized in rows with controls, mutants and enucleated mice represented on the upper, middle and lower row, respectively (these are the same cases presented in 7, 8, 9). The left column offers a general view of the posterior cortex at the border between occipital and temporal cortices; middle column depicts high magnifications of the Nissl-counterstained corresponding sections to allow precise delimitation between AC and V2l (see text for criteria); the right column shows high magnifications of the BDA-reacted sections at the same level. The black line indicates, in each section, the exact border between AC and V2l. The important point here is that all retrogradely labeled somata are within AC exclusively. Thin arrows in the lower right photomicrograph point to the pale labeled somata. Scale bars, 500 µm.
Mutant mice
Following BDA injections, axonal arbors were found localized in the MGNv as in normal mice (Fig. 8B), but in addition, in every case a few anterograde labeled fibers were observed in the LGNd, near its inferior border with the intergeniculate leaflet (Fig. 8D). These fibers were short, rather thick and large synaptic endings were clearly visible. As previously reported (Heumann & Rabinowicz, 1980), Nissl-stained sections through the thalamus revealed that the LGNd is somewhat smaller in ZRDCT/An than in normal mice (Fig. 8C). The BDA label was also detected in the LP and the labeled fibers, rarely more than two in number, seemed to course through the structure without giving rise to varicosities or synaptic boutons (Fig. 8E). Retrograde transport was also consistently observed in the auditory cortex (see Fig. 10, middle row). It should be noted that retrogradely labeled cells could not be found in any other cortical area.
Tracer injection in a ZRDCT/An mouse. The organization of the plate is as in Fig. 7. Note in C the reduced size of LGNd and LP as compared with that of the normal control. Note also the thick ramified auditory fibers, coming from the inferior colliculus, with numerous terminals within LGNd in D and the long fibers with small varicosities passing through the medial part of LP in E. Scale bars, 100 µm.
Neonatally enucleated mice
As in control and congenitally blind mice, the normal connection between IC and MGN was preserved (Fig. 9B). Careful examination of the thalamus failed to reveal the presence of labeled fibers in the LGNd of all neonatally enucleated mice (Fig. 9D). However, in two animals, BDA histochemistry revealed the presence of very thin fibers in the LP (Fig. 9E). The size of LGNd also appeared to be considerably diminished when compared with that of control mice (Fig. 9C), as has previously been reported for neonatally enucleated (postnatal day 0) mice (Cüllen & Kaiserman-Abramov, 1976). Retrogradely labeled cells were found throughout AC but in no other cortical area (Fig. 10, lower row).
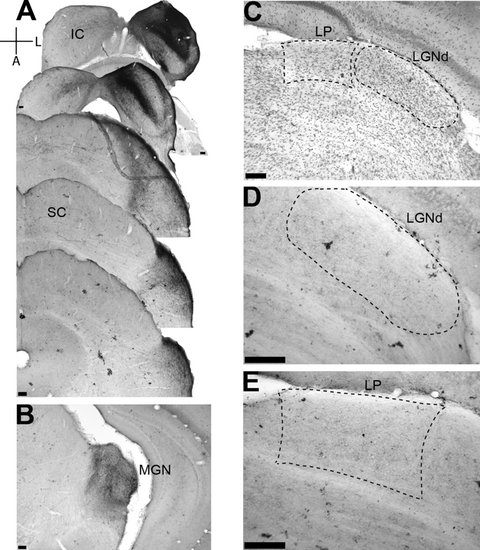
Tracer injection in a neonatally enucleated C57Bl/6 mouse. The organization of the plate is as in Fig. 7. Note in C the reduced size of LGNd and LP as compared with that of the normal control. The square delineates the enlarged area in E. Note in D that LGNd is devoid of BDA label, while a thin auditory fiber is found in LP (E). Scale bars, 100 µm.
Discussion
This study demonstrates major differences between these two animal models of blindness. In the mutant anophthalmic mouse, auditory driven c-Fos expression was observed in the LGNd and in V1. In the neonatally enucleated mouse, neither auditory afferents nor auditory activation could be demonstrated in LGNd or in V1. However, in the latter case, stronger auditory activity was observed in V2 abutting the auditory cortex. These results suggest that the prenatal absence of retinal afferents to the LGNd in the ZRDCT mutant mice is instrumental in the establishment of novel ascending connections from the inferior colliculus to the visual thalamus. Following early postnatal enucleation, it is more likely that cross-modal auditory activation of the visual cortex might have a cortical origin.
The mutant mouse
The activation patterns of AC in our experiments are in agreement with previous studies on the expression of c-Fos following auditory stimuli and were similar in blind and control mice. Pure tones activate frequency-specific columns of cells located in layers II–IV and VI and prolonged exposure further recruits numerous cells outside defined isotonic columns and in layer V (Scheich & Zuschratter, 1995; Zuschratter et al., 1995). Layer V activation was interpreted as representing the organization of auditory output. In the present experiments, relatively long exposures to broadband white noise are consistent with these observations and numerous c-Fos-IR cells were found in all layers except layer I. We also observe a distinctive intensely labeled layer IV. Such activation of this thalamorecipient layer is not always obvious in illustrations provided in other reports but can be seen in photomicrographs of auditory cortex of the behaving rat (Carretta et al., 1999), of the brown bat (Qian et al., 1996) and in the auditory cortex of the Mongolian gerbil (Zuschratter et al., 1995).
The auditory activation pattern of the primary visual cortex was typical of V1 of normal mice following a visual stimulation, with c-Fos-IR nuclei mainly localized in the thalamo-recipient layers II–III, IV and VI (Amir & Stewart, 1999). This pattern is similar to that found in AC with the exception of layer V, which was densely labeled in AC but not in V1. As the output layer, auditory cortex layer V was shown in our tracing study to be involved in the feedback connection with IC and may also be involved in feedforward connections between temporal and occipital areas (Bai et al., 2004). It is difficult to ascertain whether the laminar distribution of labeled cells indicates that V1 in the mutant mouse is activated by thalamocortical afferents and receives its auditory information directly through the connection established between IC and the LGNd. It has been suggested that the anatomical cross-talk between cortical layers makes it difficult to determine the source of the signal driving the expression of the c-fos gene (Kaczmarek & Chaudhuri, 1997). In our experiments, partial correlations between the number of c-Fos-IR cells, keeping AC as a constant in order to control for differences in the efficacy of the auditory stimulation between animals, do not indicate a significant correlation between the number of IR cells in the primary visual cortex and LGNd. Therefore, the activation of layer IV may not be indicative of a direct thalamic activation but could rather be the result of the transmission of visual information from layer IV to layers II–III, subsequently to infragranular layers V and VI and then back to layer IV. In addition, it has been suggested that c-Fos expression is dependent upon NMDA receptor activity and that direct thalamorecipient cells of layer IV are devoid of these receptors (Kaczmarek & Chaudhuri, 1997).
However, V1 activation might be related to the novel IC–LGNd projection as there are instances in which c-Fos expression in corresponding thalamic and cortical areas appears to be decoupled (Correa-Lacarcel et al., 2000). Similarly, c-Fos studies in the auditory system in mice have shown that basal activity levels in IC are generally high and very variable and do not necessarily correspond to activity levels in auditory cortex (Wallhäusser-Franke et al., 1996, 2003; Mahlke & Wallhaüsser-Franke, 2004).
The fact that mutant mice have a greater expression of auditory evoked c-Fos labeling in V1 than control and enucleated mice and that they also possess a direct connection between the IC and LGNd suggests that this ectopic pathway contributes to the auditory activation of V1. This projection is quite sparse, similar to that described in the blind-mole rat (Doron & Wollberg, 1994) and in the neonatally enucleated hamster (Izraeli et al., 2002). In the mole rat, this connection was sufficient to activate the visual thalamus (Bronchti et al., 1989) and subsequently a substantial activation of the primary visual cortex was observed (Bronchti et al., 2002). However, our observation cannot rule out the contribution of other routes by which auditory information can reach V1 in these animals. In neonatal enucleated and in normal hamsters (Izraeli et al., 2002) sporadic retrogradely labeled cells were observed in A1 following horseradish peroxidase injections in V1. In addition, very early enucleated opossums show a direct connection from AC to V1 (Karlen & Krubitzer, 2006). Other pathways can also explain auditory activations of the primary visual cortex in these animals. Indeed, there is evidence for a quite robust ascending connection from the IC to the lateral posterior thalamic nucleus in ZRDCT/An mice and for an enhanced extrageniculate thalamocortical pathway to area 17, arising from the nucleus lateralis posterior (Kaiserman-Abramov et al., 1980).
A recent contribution presented evidence for direct and reciprocal connections between IC and V1 in the ZRDCT/An mouse (Laemle et al., 2006). Our observations are at odds with these data. First, scanning of all visual and auditory cortical areas in all cases in which the IC has been injected with biotinylated dextrans has revealed a significant amount of cells in A1 but no trace of any retrogradely labeled cells in any visual cortical areas. Secondly, we found no evidence for anterogradely labeled axons either in auditory or in visual cortical areas following IC injections, confirming the absence of direct colliculo-cortical projections. In our material, the injections were clearly confined to IC and labeling observed in the medial geniculate complex is typical of IC projection patterns.
The secondary visual cortex was only weakly labeled with a significantly stronger activation compared with eyed controls only in V2m. Although not statistically more numerous than in the control group, the labeled nuclei found in V2l were generally distributed close to the border with AC. As this pattern was found in the enucleated mice as well, it is discussed further below.
The neonatally enucleated mouse
As expected, auditory stimulation yielded neuronal activity in both the inferior colliculus and the auditory cortex in the neonatally enucleated mouse. In contrast to our findings in the mutant groups, the activity quantified in LGNd and V1 in the enucleated mice was not different from that found in control animals. This observation is commensurate with the results of the tracing study in which no auditory fibers could be found entering the LGNd in the enucleated animals and reinforces the hypothesis raised above that the IC–LGNd connection contributes effectively to the activation of V1 in the anophthalmic mutant.
In contrast, an unequivocal activation was seen in the secondary visual cortex. In V2l, the auditory activity was typically localized at the border region adjacent to AC. In enucleated hamsters, there is also an extended region of cortex responsive to auditory stimulations (Izraeli et al., 2002). Whether this result represented a hypertrophy of the hamster's auditory cortex or an auditory activation of the adjacent V2l was not determined (Izraeli et al., 2002). We surmise that in the present material the extended auditory activation is within V2l. First, the laminar distribution of c-Fos-expressing cells is different between V2l and auditory cortex. Secondly, we applied the cytoarchitectonic criteria described by Caviness (1975) to differentiate occipital and temporal cortices, as the criteria used in delineating these two cortical fields in normal mice remain valid in ZRDCT/An and enucleated animals. The occipital cortex in Nissl-stained sections is obviously laminated and exhibits a clear cell-poor layer Va. Conversely, the temporal cortex is not as clearly laminated and does not show a distinct cell-poor layer Va. In addition, retrogradely labeled cells following tracer injections in the IC were located typically in primary auditory cortex and none was found in the lateral portion of V2l activated by auditory stimulation.
Auditory activity can reach V2l through several pathways. There is evidence for projections to V2l directly for auditory cortex in normal rodents. A belt area with visual–auditory multisensory neurons was described at the occipital/temporal border (Paperna & Malach, 1991; Wallace et al., 2004). The incidence of these multisensory neurons declines rapidly, with none being found 500 µm medial or lateral to this border zone. The auditory activity observed in our study is located similarly in a 500-µm-wide strip of occipital cortex abutting auditory cortex. This would suggest that the auditory activation of V2l results from unmasked projections in enucleated mice. Although less intense, a similar pattern was also found in the ZRDCT/An mice but we have no explanation as to why these pathways do not equally allow for auditory evoked c-Fos labeling in control mice.
In the present study, the medial part of V2 was also clearly labeled in enucleated as well as in ZRDCT/An mice but displayed a different laminar pattern of activation compared with V2l. Its activation could originate from either AC or the laterodorsal thalamic nucleus. The laterodorsal thalamic nucleus receives a direct projection from AC in gerbil (Budinger et al., 2006) and projects directly to V2m in normal intact and in enucleated rats (Warton et al., 1988). We never observed IC efferent fibers entering this thalamic nucleus. A direct connection between AC and V2m has also been shown in gerbil (Budinger et al., 2006).
An interesting question that needs to be investigated is the functionality of V1 in neonatally enucleated mice. In this case, the involvement of V1 in audition would appear to be negligible. It is certainly not activated by vision, but we cannot exclude a possible take-over by the somatosensory system. Asanuma & Stanfield (1990) demonstrated somatosensory afferents in the LGNd of neonatally enucleated mice as well as in mice suffering ocular retardation. Somatosensory stimulation was reported to activate V1 in neonatally enucleated rats as well (Toldi et al., 1994a).
Comparison between our animal models of blindness
The strength of this study resides in the comparison of the two animal models: in the mutant ZRDCT/An, the cross-modal plasticity is primarily subcortical whereas it seems to be largely cortical in the neonatally enucleated mouse. The difference observed can be attributed to the stage of development when visual deprivation occurs. The consequences resulting from the mutated gene expression of Rx/rax are not likely to be responsible for these differences because the mutation has very localized effects on the hypothalamus anatomy (Silver, 1977; Laemle & Rusa, 1992) and can disrupt intrinsinc circadian rhythms (Faradji-Prevautel et al., 1990; Laemle & Ottenweller, 1998) directly linked to the absence of retinofugal fibers. This gene is expressed in overlapping domains of the anterior neural ectoderm, which correspond to the forebrain and retinal fields and later in the optic vesicle (Ohuchi et al., 1999; D'Aniello et al., 2006). Indeed, anophthalmic mice have an atrophy of the LGNd and of the optical layer of the superior colliculus in comparison with control C57BL/6 animals (Chase, 1945) but the neonatally enucleated mice also present a smaller LGNd than the control animals. At birth, the critical period for the redirection of inferior collicular axons toward the LGNd is over. Intrauterine enucleation of C57BL/6 mice, between embryonic days 14 and 19, has shown that the visual thalamus contains synaptic terminals similar to retinal terminals, comparable with what also occurs in the ZRDCT/An mouse (Kaiserman-Abramov, 1983). The origin of these terminals is unknown. They could be terminals of cortical origin, as suggested by the authors, or from the IC. Altricial species are often used to avoid the difficulty of performing surgery on embryos. For instance, enucleated at birth, the ferret, opossum and hamster all show evidence of cross-modal plasticity at the subcortical level. At birth, the hamster exhibits the developmental stage of a mouse at embryonic day 16 (Clancy et al., 2001). Therefore, a neonatal enucleation performed on a hamster would be similar to an intrauterine enucleation on a mouse, occurring before or around the time of arrival of retinal fibers in the LGNd. However, to our knowledge, these early blind models have never been compared with enucleations performed later in the same species.
Special attention should be given to the neonatally enucleated rat, as this animal seems to have an extended critical period for crossmodal reorganization at the subcortical level. In contrast to the neonatally enucleated mouse, its primary visual cortex can be activated by a non-visual stimulus (Toldi et al., 1994a). This V1 activation is still present when the bilateral enucleation is performed before the end of the first postnatal week (Toldi et al., 1990).
The main finding in the present study remains that there is a clear difference in the activity patterns evoked by an auditory stimulation in enucleated and mutant blind mice. This indicates that the prenatal period of development provides cues for the subsequent development of cortical connectivity underlying the differences in the distribution of auditory activation of the cortex.
The difference between ZRDCT and neonatally enucleated mice resides in the absence of retinal afferents to LGNd. Therefore, spontaneous activity of the visual system is non-existent during the late prenatal period in ZRDCT mice as they never develop an optic cup, retina or optic nerve. This short period of prenatal deprivation could be sufficient to induce the difference in cross-modal activations of visual cortices as both ZRDCT and enucleated mice are deprived of visual information from birth. Recent evidence supports the possibility that spontaneous activity in the visual system is important in shaping cortical response properties and connections (Hanganu et al., 2006; Huberman et al., 2006). In addition, thalamocortical connections are functional in the subplate and in the deep cortical plate at embryonic ages and could influence cortical circuit formation before birth given that they can depolarize subplate cells during thalamocortical axon side-branch formation (Friauf & Shatz, 1991; Hanganu et al., 2002; Higashi et al., 2002; Molnar et al., 2003). The role of this early spontaneous activity remains ill-defined.
Although further investigation is needed to characterize the two animal models of blindness fully, our results shed new light on reports regarding early-blind humans and late-onset blindness. Recently, a positron emission tomography scan study suggested that the inhibitory patterns differ between early-blind and sighted individuals; the sighted individuals inhibit their occipital cortex in a binaural sound location task whereas no inhibition occurs in the occipital cortex of early-blind persons (Gougoux et al., 2005). Also, in early-blind humans, Braille-reading activates the primary visual area (Cohen et al., 1999) whereas this activation declines with age of blindness onset, reaching sighted control levels in early adolescence (Sadato et al., 2002). Similar results have been obtained with transcranial magnetic stimulation. Applying transcranial magnetic stimulation over the medial occipital cortex disrupts Braille-reading performance in the early-blind but not in the late-blind (Cohen et al., 1999). There is evidence that the occipital cortex of people who have lost their sight late in life is activated during sound localization (Voss et al., 2006). However, careful examination of Figure 1 in the latter report indicates that the evoked activity is mainly distributed over extrastriate areas and this is similar to that which we observed in mice enucleated at birth. Also, Goyal et al. (2006) have shown that in later-onset blindness, a Braille-reading task activates the middle temporal visual area (MT/V5). This differential pattern of visual cortex activation might be important to take into account in the mechanisms that will ensure the success or failure of a visual implant.
Acknowledgements
We are grateful to Mrs Rollande Caron and Marie-Ève Lemire for their support and advice with regard to animal care and maintenance. Special thanks to Dr Jean-François Quessy for his help with the statistical analyses. This work was supported by grants from the Natural Sciences and Engineering Research Council of Canada and from the Fonds Québécois de la Recherche sur la Nature et les Technologies. N.C. was supported by grants from the Fondation de l'Université du Québec à Trois-Rivières.
Abbreviations
-
- AC
-
- auditory cortex
-
- BDA
-
- dextran–biotin
-
- CE
-
- Gundersen coefficient of error
-
- CIC
-
- central nucleus of the inferior colliculus
-
- DAB
-
- 3,3-diaminobenzidine
-
- IC
-
- inferior colliculus
-
- IR
-
- immunoreactive
-
- LGNd
-
- lateral geniculate nucleus dorsal part
-
- LP
-
- latero-posterior nucleus
-
- MGN(v)
-
- medial geniculate nucleus (ventral division)
-
- SOI
-
- structure of interest
-
- V1
-
- primary visual cortex
-
- V2l
-
- secondary visual cortex lateral part
-
- V2m
-
- secondary visual cortex medial part
-
- TBS-Tx
-
- Tris-HCl-buffered saline-Triton X-100.


