A polymorphism in lipoprotein lipase affects the severity of Alzheimer's disease pathophysiology
Abstract
Emerging evidences indicate a role for lipoprotein lipase (LPL) in degenerative states. Genetic variations in the LPL gene were previously associated to lipid imbalance and coronary artery disease (CAD) risk and severity, a condition that shares pathological features with common Alzheimer's disease (AD). To evaluate whether these genetic variations associate with the risk and pathophysiology of common AD, autopsy-confirmed patients (242 controls, 153 AD) were genotyped for a PvuII single nucleotide polymorphism (SNP; rs285; referred to as the P+ allele) of LPL. Brain LPL mRNA levels, cholesterol levels, amyloid concentration, senile plaques and neurofibrillary tangles density counts were measured and contrasted with specific LPL genotypes. When adjusted for age and sex, homozygosity for the P+ allele resulted in an odds ratio of 2.3 for the risk of developing AD. More importantly, we report that the presence of the P+ allele of LPL significantly affects its mRNA expression level (n = 51; P = 0.026), brain tissue cholesterol levels (n = 55; P = 0.0013), neurofibrillary tangles (n = 52; P = 0.025) and senile plaque (n = 52; P = 0.022) densities. These results indicate that a common polymorphism in the lipoprotein lipase gene modulates the risk level for sporadic AD in the eastern Canadian population but more importantly, indirectly modulates the pathophysiology of the brain in autopsy-confirmed cases.
Introduction
More than 110 genetic loci have been associated with sporadic Alzheimer's disease (AD) (for list and review see Finckh, 2003). Interestingly, there is a large cluster of genetic markers involved in cholesterol homeostasis including among others apolipoprotein (apo)E4, apoCI, ATP-binding cassette (ABC)A2, LRP, VLDL receptor and cholesterol 24-hydroxylase (also known as CYP46). Lipoprotein lipase (LPL; EC 3.1.1.34), also involved in cholesterol homeostasis, was shown to be involved in normal synaptic remodeling in the injured adult brain (Blain et al., 2004).
LPL is an enzyme with a dual role in lipid metabolism. It is involved in the hydrolysis of triglycerides on the surface of lipoproteins and acts as a ligand for the different lipoprotein receptors (Beisiegel et al., 1991; Kounnas et al., 1993; Takahashi et al., 1995; Medh et al., 1996; Tacken et al., 2000) and heparan sulphate proteoglycans (HSPGs; reviewed in Kolset & Salmivirta, 1999). It is distributed in numerous tissues including the brain, where it is mostly expressed in the hippocampus (Goldberg et al., 1989; Ben Zeev et al., 1990; Paradis et al., 2004). In periphery, apoC-II acts as an essential cofactor for LPL activity (Havel et al., 1973; LaRosa et al., 1970), however, it is not expressed in the brain (Zannis et al., 1985; Hoffer et al., 1993). Nonetheless, catalytically inactive LPL retains its bridging function and promotes the active uptake of lipoproteins (Merkel et al., 1998) via cell-surface receptor-mediated endocytosis.
LPL expression is increased during the degenerative phase following peripheral nerve crush (Huey et al., 2002) and hippocampal deafferentation (Blain et al., 2004) where it is suggested to play a role in lipid redistribution and membrane remodeling. It is also found associated with amyloid (Aβ) and apoE in senile plaques of AD brains (Rebeck et al., 1995). Single nucleotide polymorphisms (SNPs) in the coding region of LPL were shown to associate with the disease incidence in clinically diagnosed AD subjects (Baum et al., 1999). However, these observations failed to replicate in independent studies (Retz et al., 2001; Fidani et al., 2002; Martin-Rehrmann et al., 2002). Recently, a HindIII SNP (rs320) in intron 8 of the LPL gene was found to strongly associate with the disease prevalence in a cohort of clinically diagnosed subjects (Scacchi et al., 2004).
This HindIII SNP, as well as a PvuII SNP (rs285) found in intron 6 of the LPL gene, associate with blood levels of triglycerides, HDL-cholesterol, the incidence of diabetes as well as coronary artery disease (CAD) incidence and severity (Chamberlain et al., 1989; Ahn et al., 1993; Wang et al., 1996). Interestingly, AD and CAD share common pathological features such as vascular damage, senile plaques (SP) and neurofibrillary tangles (NFT; Sparks et al., 1990; Sparks, 1997).
Based on these evidences, we screened a large eastern Canadian cohort of autopsy-confirmed control and AD brains for association between the intronic LPL PvuII SNP and the disease risk. We then contrasted the effect of this polymorphism, as well as its interaction with the presence of the ɛ4 allele of apoE, on the extent of the pathophysiological changes like brain tissue cholesterol levels, neurofibrillary tangles and senile plaques density in areas displaying high and low pathology.
Materials and methods
Study populations
For DNA extraction and genotyping, human frontal cortex tissue samples from 153 autopsy-confirmed AD patients and 242 age-matched, sex-matched, controls with no neurological disorders were obtained from the Douglas Hospital Research Centre Brain Bank (Table 1). Neuropathological analyses were consistent with the criteria used in the classification of Khachaturian (1985).
| Control subjects(n = 242) | AD patients (n = 153) | |
|---|---|---|
| Age, years | 75.8 ± 7.0 | 76.6 ± 8.1 |
| Female sex: n (%) | 124 (51.2) | 74 (48.3) |
| Allele frequency | ||
| APOE ɛ2 | 0.08 | 0.03 |
| APOE ɛ3 | 0.80 | 0.64 |
| APOE ɛ4 | 0.12 | 0.33 |
| LPL P– | 0.50 | 0.43 |
| LPL P+ | 0.50 | 0.57 |
| LPL H– | 0.29 | 0.22 |
| LPL H+ | 0.71 | 0.78 |
Lipoprotein lipase genotyping
DNA was extracted from brain tissue using DNeasy tissue kit (QIAGEN Inc., Mississauga, ON). DNA was subjected to PCR as described before (Ahn et al., 1993) with minor modifications. Briefly, amplification of a 1239 bp HindIII restriction fragment was carried out for 35 cycles (1 : 30 min at 95 °C, 2 : 30 min at 50 °C and 3 : 00 min at 72 °C) using the following primer pairs; forward 5′-TTTAGGCCTGAAGTTTCCAC-3′ and reverse 5′-CTCCCTAGAACAGAAGATC-3′. Amplification conditions for the 854 bp PvuII fragment were the same except for the annealing temperature which was set at 62 °C. Primer pairs were as follows; forward 5′-TAGAGGTTGAGGCACCTGTGC−3′ and reverse 5′-GTGGGTGAATCACCTGAGGTC-3′. PCR products were digested with HindIII or PvuII overnight at 37 °C and separated on gel. Presence of the restriction site (+ allele) resulted in the formation of 576 and 665 bp fragments for HindIII and 268 and 586 bp fragments for PvuII.
Apolipoprotein E genotyping
DNA was extracted from brain tissue using DNeasy tissue kit (QIAGEN Inc., Mississauga, ON). Amplification of a 226-bp fragment was carried out for 35 cycles (30 s at 94 °C, 30 s at 60 °C and 30 s at 72 °C) using the following primer pairs; forward 5′-CACGGCTGTCCAAGGAGCTGC-3′ and reverse 5′-GCCCCGGCCTGGTACACTGCCA-3′. PCR products were digested with AflIII and HaeII and analysed on 8% acrylamide gel. Digestion patterns were as follows; ɛ2/ɛ2 (168 bp 58 bp); ɛ2/ɛ3 (168 bp 145 bp 58 bp 23 bp); ɛ2/ɛ4 (203 bp 168 bp 58 bp 23 bp); ɛ3/ɛ3 (145 bp 58 bp 23 bp); ɛ3/ɛ4 (203 bp 145 bp 58 bp 23 bp) and ɛ4/ɛ4 (203 bp 23 bp).
Quantitative RT-PCR
RNA was extracted from frontal cortex samples using QIAGEN's RNeasy kit (QIAGEN Inc., Mississauga, ON). Primer pairs used for PCR amplification were as follows; LPL-forward 5′ -ATCCAGAAACCAGTTGGGCA-3′; LPL-reverse 5′-GCTGGTCCACATCTCCAAGTC-3′; Actin-forward 5′-TCACCCACACTGTGCCCATCTACGA-3′; Actin-reverse CAGCGGAACCGCTCATTGCCAATGG-3′. RT-PCR was performed using the SybrGreen method in a GeneAmp 5700 Sequence detection system from PE Applied Biosystems. Following comparison of the primer efficiencies, quantification could be made using the comparative Ct method that uses a mathematical model (Pfaffl, 2001).
Neuropathological analyses
Neurofibrillary tangles (NFTs) and senile plaque (SP) numbers were determined as previously described (Etienne et al., 1986) for the different areas and were consistent with the criteria used in the classification of Khachaturian (1985). Briefly, 15-micron paraffin-embedded sections (n = 52 for fusiform gyrus and n = 53 for parietal cortex) were stained with either haematoxylin and eosin, modified Bielchowsky stain, and alkaline Congo red to visualize neurofibrillary tangles and senile plaques. Quantitative morphometric evaluation of neurofibrillary tangles and senile plaques were determined. Using a micrometric scale for calibration, readings were performed with a 10× objective for senile plaques and a 25× objective for neurofibrillary tangles. Diffuse plaques were excluded from all measurements. Screening of alkaline Congo red stains under polarized light was used to control for the reliability of tangle staining and, to a lesser extent, of the senile plaques' affinity for the modified Bielchowsky preparation.
Brain cholesterol determination
Frozen sections of human frontal cortex (consisting of grey matter) weighing 30–60 mg were homogenized in 1 mL PBS for 30 s with Vibra-cell Processor then mixed. Extraction was carried out according to Folch et al. (1957) using a water-methanol-chloroform (3 : 4 : 8, v/v/v) mix. After vortexing and centrifugation, the aqueous phase was removed and kept for DNA measurements (Labarca & Paigen, 1980) and the organic phase was washed with 0.2 volume of distilled water. After centrifugation, the organic phase was removed and evaporated under a nitrogen stream. Acetonitrile-isopropanol (50 : 50, v/v) was added to the dried extract and injected on HPLC.
HPLC analysis adapted from Vercaemst et al. (1989) was performed on a POLARIS system equipped with a Microsorb-MV 100–5µ C18 column with a Metaguard 4.6 mm Metasil 5µ ODS (Varian, Inc., Mississauga, ON, Canada). The wavelength detector was set at 210 nm. Cholesterol and heptadecanoate were eluted isocratically at a flow rate of 1.0 mL/min with acetonitrile–isopropanol (50 : 50, v/v). A linear relationship was obtained between the injected amount of cholesterol and the peak area. The standard solutions were prepared by dissolving each standard in mobile phase. The standard curve range was 10–40 µg of cholesterol and 30 µg of heptadecanoate was added as an internal control.
β-Amyloid ELISA
Total Aβ concentration was determined as previously described (Beffert et al., 1999a) using 100 µg of protein from brain samples homogenized in a buffer containing 5 m guanidine. Coating antibodies used were R163 and R165 for Aβ1−40 and Aβ1−42, respectively (generous gift from Dr P.D. Mehta, New York Institute for Basic Research, Staten Island, New York) and detection antibody was a biotinylated-6E10 (Signet Laboratories Inc., Dedham, MA).
Statistical analyses
Logistic regression analysis (Enter method) was used to examine the simultaneous effect of LPL genotype, apoE4, age and sex on the risk of AD. One-way analysis of variance (anova) or t-test for biological markers are reported but nonparametric tests (Kruskal–Wallis and Mann–Whitney) were also run giving very similar results. Two-way anova was used to look for interactions between P+ and ɛ4 alleles for the different markers. All the analyses were performed using SPSS 11.5.
Results
Genetic association study
Allele frequency and population characteristics are reported in Table 1. The age and sex adjusted odds ratio (OR) for the risk of AD in homozygous carriers of the P+ allele was 2.3 (95% CI 1.28–4.22; P = 0.005) and 5.2 (95% CI 3.06–9.03; P < 0.0001) for the presence of at least one ɛ4 allele. There is no synergistic effect on AD risk between the P+ and ɛ4 alleles as demonstrated by the lack of significant interaction between the two (Wald χ2 = 1.72; d.f. = 1; P = 0.190). No significant association was found for H+ homozygous patients (Wald χ2 = 1.33; d.f. = 1; P = 0.248) even though presence of apoE4 remained highly significant (OR = 4.5; 95% CI 2.23–9.16, P < 0.0001).
PvuII SNP effect on LPL expression
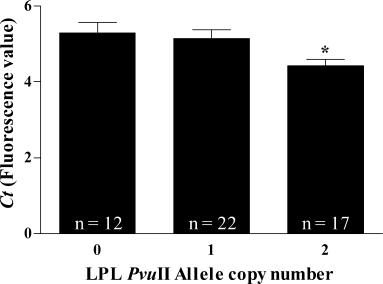
Due to the low occurrence of the homozygote H– genotype, associations could not be conducted for the HindIII SNP. Using real-time quantitative RT-PCR we measured a 1.42-fold increase of LPL mRNA in AD brain compared to control. One-way analysis of variance (anova) revealed a significant effect of the P+ allele on mRNA concentration in AD brain (F = 3.94; P = 0.026, n = 51; Fig. 1) which is not observed in controls (F = 0.48; P = 0.64, n = 30; not shown).

Gene-dose effect of the PvuII genotype of LPL on mRNA concentration in the frontal cortex of AD patients. Measures of mRNA are expressed as Ct which represents a fluorescence emission value. Note that lower Ct values correspond to higher mRNA expression. Each bar represents mean ± SEM, *P = 0.026 for 2 vs. 0.
PvuII SNP effect on neurodegeneration markers of AD
The extent of neurodegeneration was assessed in the autopsy-confirmed brains by the measurement of both tangle densities and cholesterol concentration. Association of these biological markers with the different LPL genotypes was established. Associations for the combined presence of the P+ allele of LPL and the ɛ4 allele of apoE were also measured. Population characteristics for these subgroups are reported in Table 2.
| Haplotype | ||||
|---|---|---|---|---|
| P–ɛ4– | P+ɛ4– | P–ɛ4+ | P+ɛ4+ | |
| Controls | ||||
| N | 48 | 138 | 15 | 41 |
| Age (years) | 72.9 ± 5.3 | 76.6 ± 7.3 | 76.6 ± 7.8 | 75.8 ± 7.1 |
| Female sex: n (%) | 23 (47.9) | 74 (53.6) | 5 (33.3) | 22 (53.6) |
| AD group | ||||
| N | 16 | 51 | 20 | 66 |
| Age, years | 79.6 ± 7.0 | 76.1 ± 8.6 | 75.6 ± 6.2 | 76.6 ± 8.5 |
| Female sex: n (%) | 7 (43.8) | 22 (43.1) | 8 (40.0) | 37 (56.0) |
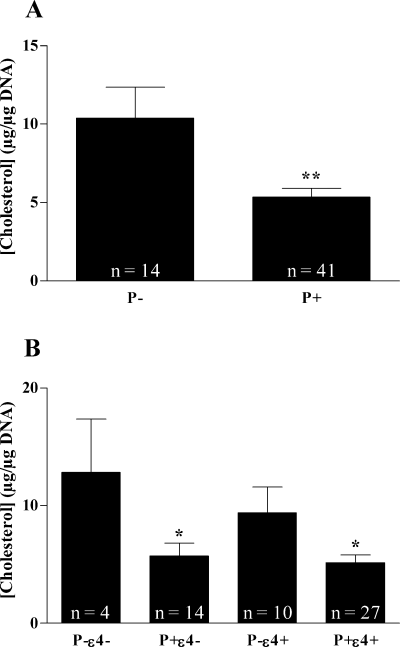
Statistical analysis revealed that frontal cortex cholesterol concentration was significantly lower in the presence of the P+ allele (5.36 ± 0.55 vs. 10.38 ± 1.97 in P– carriers) in AD brains (Fig. 2A) but not controls (P = 0.847; n = 32; not shown). The combined presence of an ɛ4 allele with the P+ allele did not contribute to further decreases in cholesterol concentration (Fig. 2B) and absence of interaction was demonstrated by two-way anova (F = 0.8, P = 0.38).

Frontal cortex cholesterol concentration in AD according to (A) presence or absence of the P+ allele of LPL; **P = 0.0013 and (B) combined presence the of P+ allele of LPL and ɛ4 allele of apoE; *P < 0.05 following Bonferroni posthoc test (vs. P–ɛ4–).
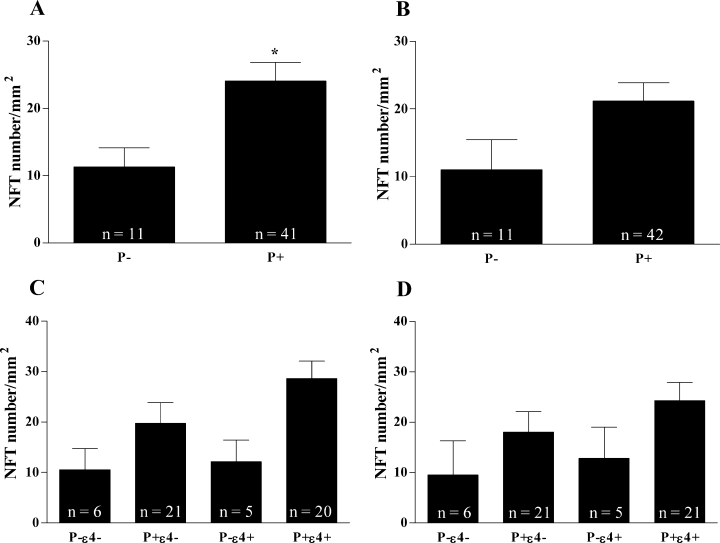
The number of NFTs, another marker of neurodegeneration, was found to be significantly higher in the fusiform gyrus (Fu) of P+ carriers (24.07 ± 2.76 vs. 11.27 ± 2.86 in P– carriers; Fig. 3A) however, it was not quite significant in the parietal cortex (PCx; P+ 21.19 ± 2.69 vs. P− 11.00 ± 4.44; P = 0.081; Fig. 3B). Again, no interaction was observed between P+ and ɛ4 in either Fu (F = 0.42, P = 0.52; Fig. 3C) or PCx (F = 0.06, P = 0.80; Fig. 3D).

Neurofibrillary tangles number in AD brain sections according to the presence or absence of the P+ allele of LPL in (A) fusiform gyrus (*P = 0.025) and (B) parietal cortex. Combined effect of P+ allele of LPL and ɛ4 allele of apoE in (C) fusiform gyrus and (D) parietal cortex.
PvuII SNP effect on amyloid concentration and senile plaque number
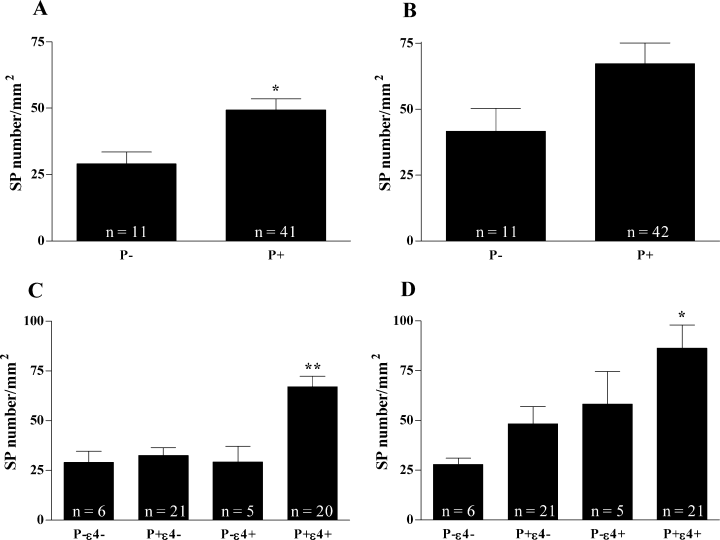
Another characteristic marker of AD pathology is the presence of SP. We found that SP number in the Fu was significantly higher in P+ carriers (49.32 ± 4.23 vs. 29.09 ± 4.43 in P– carriers; Fig. 4A) whereas it was not significant in the PCx (P+ 67.26 ± 7.80 vs. P− 41.64 ± 8.66; P = 0.11; Fig. 4B). When looking at the combined effect of P+ and ɛ4, two-way anova revealed a strong interaction between both alleles on SP number in the Fu (F = 6.32, P = 0.015; Fig. 4C) but only an effect of ɛ4 in the PCx (Fig. 4D). Interestingly, there was absolutely no effect of the presence of the P+ allele on amyloid concentration (Aβ40P = 0.63, n = 22; Aβ42P = 0.32, n = 23; data not shown).

Senile plaques number in AD brain sections according to the presence or absence of the P+ allele of LPL in (A) fusiform gyrus (*P = 0.022) and (B) parietal cortex. Combined effect of P+ allele of LPL and ɛ4 allele of apoE in (C) fusiform gyrus (**P < 0.001 following Bonferroni posthoc test; P+ɛ4+vs. all groups) and (D) parietal cortex (*P < 0.05 following Bonferroni posthoc test; P+ɛ4 + vs. P–ɛ4– and P+ɛ4–).
Discussion
Lipoprotein lipase HindIII and PvuII intronic polymorphisms were shown to associate with lipase deficiency (Gotoda et al., 1989), increased levels of blood triglycerides, lower HDL cholesterol as well as coronary artery disease risk and severity (Chamberlain et al., 1989; Mattu et al., 1994; Wang et al., 1996). Moreover, the H+ allele of the HindIII polymorphism associates with increased common AD risk in a clinically diagnosed cohort of patients (Scacchi et al., 2004).
In this study, although we do not confirm the proposed association of the HindIII SNP of LPL with the disease risk, we report for the first time an association between the PvuII SNP of LPL, the disease risk and the extent of the pathology in AD cases.
Most importantly, this PvuII polymorphism does not only associate with AD prevalence but with both amyloid and tangle densities. The low prevalence of the H–H– polymorphism did not allow for statistical analyses but we observed a trend for association between the H+ allele and the density of senile plaques and neurofibrillary tangles in the AD brains even in the absence of association with AD risk (J.-F. Blain & J. Poirier unpublished observations). The low prevalence of the H– allele and the sample size could explain the close, but nonsignificant association with disease risk. On the other hand, what we report is a clear and significant association between the P+ allele (presence of the PvuII cutting site) and the levels of LPL mRNA, tissue cholesterol, senile plaques and neurofibrillary tangles in autopsied AD cases. The P+ allele has a strong impact in terms of amyloid deposition and tangle density in the fusiform gyrus, a region more severely affected by the disease than the parietal cortex (Halliday et al., 2003).
Another interesting observation is that in most cases, the ɛ4 allele of apoE did not contribute much to the extent of the pathology. Even though it acts as the main cholesterol transporter in the brain, and was shown to associate with tangles (Nagy et al., 1995; Ohm et al., 1995), the presence of the ɛ4 allele does not impact significantly on brain tissue cholesterol concentration and NFT number. In fact, in our study, the ɛ4 allele only has an effect on senile plaques number, consistent with its role in amyloid deposition and clearance (Schmechel et al., 1993; Beffert et al., 1999b).
Intronic polymorphisms could influence the biological activity of LPL through different mechanisms leading to a modification of the rate of progression of the disease. These could also signal the presence of nearby exon mutations or polymorphisms, which would affect protein structure. However, in this particular case, the PvuII restriction site (5′-CAGCTG-3′) is localized in the consensus sequence for the E-box DNA motif, a sequence usually found in the promoter region and in enhancers of inducible genes. It binds transcription factors of the basic helix-loop-helix family (Blackwell & Weintraub, 1990) leading to induction or repression of genes. Consistent with this view, we found that AD brains express more LPL mRNA than control cases and that the increase is modulated in an allele dose-dependent fashion by the presence of the PvuII restriction site (P+ allele) of LPL. The P+ allele maintains the E-box sequence intact; consistent with the LPL overexpression measured in the cortical area of our AD cases. Moreover, increased LPL mRNA expression was also observed following hippocampal deafferentation and found to be associated with the presence of proliferating glial cells (Blain et al., 2004). Thus, we can not rule out the possibility that the gliosis observed in AD brain could also be responsible, at least in part, for the increased mRNA expression if we assume that the P+ allele is associated with more severe neuronal cell loss or enhanced synaptic damage.
In the periphery the P+ allele of LPL is associated with higher blood triglycerides and lower levels of HDL cholesterol (Chamberlain et al., 1989; Mattu et al., 1994; Wang et al., 1996). The brain contains virtually no triglycerides and produces lipoprotein particles of the HDL-like type (Fagan et al., 1999; LaDu et al., 2000). However, in this study the presence of the P+ allele correlated with tissue free cholesterol levels and accounted for 18.6% of the variance observed. As lipoproteins normally transport esterified cholesterol, lower tissue cholesterol is more likely an indicator of degeneration rather than lipoprotein cholesterol. It is interesting to note that increased NFT number is also a marker of degeneration and that it also associates with the P+ allele.
Decreased neuronal membrane cholesterol enhances Aβ production (Abad-Rodriguez et al., 2004), a characteristic feature of AD. We did not find any correlation between LPL polymorphisms and Aβ levels. However, we observed a strong association with the number of senile plaques and the P+ allele, which is further enhanced by the presence of the ɛ4 allele. It has been previously shown that LPL is tightly associated with apoE and amyloid in senile plaques (Rebeck et al., 1995). Furthermore, LPL acts as a ligand for different receptors of the LDL receptor family and could also interact with Aβ locally to mediate its internalization alone or in concert with apoE.
The exact function of LPL in the brain remains obscure today. It could help bridging lipoproteins to cell-surface receptors, act as transport for cholesterol and vitamin E and support survival and plasticity of neuronal networks (Ben Zeev et al., 1990; Rinninger et al., 1998; Blain et al., 2004; Paradis et al., 2004). Our results suggest that the presence of the P+ allele increases the risk of developing AD but more importantly, it enhances the pathological cascade that is so characteristic of sporadic AD (amyloid deposition, tangles accumulation). However, the fact that it enhances amyloid deposition without increasing beta amyloid production suggests an extracellular mode of action, conceivably similar to the one proposed for apoE4. Furthermore, the fact that the amyloid plaque density remains relatively stable between the onset of the disease and the death of the patients suggests that the interaction between LPL and extracellular amyloid occurs prior to diagnosis, in the years or decade that precede the clinical diagnosis.
More investigations are necessary to elucidate the exact role of LPL in the pathogenesis of AD and its possible interaction amyloid and other players involved in the regulation cholesterol homeostasis such as apoE and its receptors.
Acknowledgements
The authors would like to acknowledge the precious help of Dr Joseph Rochford from the Douglas Hospital Research Center and Dr Carole Dufouil from INSERM, France for statistical analyses. This work was supported in part by the Alzheimer's Society of Canada (J.P.) and the Canadian Institute of Health Research (J.P. and J.F.B.). J.P. is the recipient of a Senior Investigator Career Award from the CIHR.
Abbreviations
-
- AD
-
- Alzheimer's disease
-
- apo
-
- apolipoprotein
-
- Fu
-
- fusiform gyrus
-
- LPL
-
- lipoprotein lipase
-
- NFT
-
- neurofibrillary tangles
-
- PCx
-
- parietal cortex
-
- SNP
-
- single nucleotide polymorphism
-
- SP
-
- senile plaques


