Oxidative modulation of the transient potassium current IA by intracellular arachidonic acid in rat CA1 pyramidal neurons
Abstract
Oxidative stress affects cellular membrane lipids and proteins. Using whole-cell patch-clamp recording we demonstrate differential oxidative inhibition of voltage-gated transient (IA) and delayed rectifier [IK(V)] K+ currents by arachidonic acid (AA) and H2O2 in CA1 neurons in hippocampal slice. We show that intracellular application of 1 pm AA or its non-metabolizable analog eicosatetraynoic acid (100 pm) reduced IA by ∼42% but did not affect IK(V). AA shifted the voltage dependence of steady-state inactivation of IA by 12 mV to more negative potentials whereas the rate of inactivation was unchanged. Surprisingly, intracellular glutathione (GSH, 20 mm) enhanced the effect of AA on maximal IA (−62%) and with AA slowed inactivation of IA. The combination of GSH and extracellular ascorbate (0.4 mm) prevented reduction of IA by AA. Intracellular Trolox (a vitamin E analog, 10 µm) reduced IA by 61%and IK(V) by 39%. Like AA, intracellular Trolox caused a 10-mV left shift of IA steady-state inactivation but Trolox and AA did not cause a shift when coapplied. Extracellular Trolox (100 µm) had no effects on IA. H2O2 (80 µm) reduced both IA and IK(V) in a GSH- and ascorbate-sensitive manner and slowed the rate of inactivation of IA by a factor of 2. Coapplication of H2O2 with GSH and extracellular ascorbate caused ∼22 mV negative shifts of both steady-state inactivation and activation. We conclude that AA is extremely potent in affecting IA by oxidative modifications. Antioxidants can augment these effects, probably by catalysis of the underlying reactions between oxidants and IA channel proteins.
Introduction
There has been continuously growing interest in oxidative stress and its roles in the physiology and pathophysiology of immune defense, ischemia and neurodegenerative disease, such as Parkinson's disease (e.g. Barkats et al., 2006), Alzheimer's dementia (e.g. Behl et al., 1994) and multiple sclerosis (e.g. Ferretti et al., 2006). Reactive oxygen species modify membrane lipids as well as a variety of proteins, including membrane channels, affecting cellular functions in both detrimental and protective ways (Kourie, 1998).
Voltage-gated K+ currents were among the first ion channels to be recognized and investigated for their important roles in neuronal signaling (Hodgkin & Huxley, 1952). In particular, the voltage-gated transient K+ current (IA) contributes to the resting membrane potential by the so-called window current and, because of its fast activation, is primarily responsible for repolarization and the duration of the action potential, and repetitive firing (Connor & Stevens, 1971b,a). Via their effect on resting membrane potential, IA channels exert a strong influence on steady-state inactivation of Na+ channels and dendritic back-propagation of action potentials, underlying synaptic plasticity (Hoffman et al., 1997). Via action potential duration, IA channels strongly affect presynaptic Ca2+ influx and transmitter release (Pongs, 1999), affecting synaptic and network excitability (cf. Müller & Misgeld, 1990, 1991).
Ruppersberg et al. (1991) demonstrated that inactivation of A-type currents through Kv1.4 channels is dependent on the cellular redox state in a cysteine-dependent manner. Oxidation decreases the conductance of Kv1.3, Kv1.4, Kv1.5, Kv3.4 (Duprat et al., 1995) and Kv3.3 channels (Vega-Saenz de Miera & Rudy, 1992), while it enhances K+ currents through human ether-a-gogo-related gene K+ channels (Taglialatela et al., 1997). High concentrations of arachidonic acid (AA) (≥ 1 µm) directly modulate IA in CA1 hippocampal neurons (Keros & McBain, 1997; Colbert & Pan, 1999) and facilitate induction of synaptic long-term plasticity (Ramakers & Storm, 2002). We have demonstrated specific oxidative modulation of voltage-activated K+ currents in cultured hippocampal neurons by H2O2 and 1 pm AA (Bittner & Müller, 1999; Müller & Bittner, 2002).
Arachidonic acid is an important second messenger in a wide variety of cell types. In neurons, a receptor-dependent event (leading to Ca2+ influx or release of Ca2+ from intracellular stores) is required for phospholipase A2, phospholipase C or diacyl-glycerol lipase to release arachidonate from the phospholipids in the cell membrane. Metabolism of AA occurs extremely rapidly by lipoxygenase, cyclo-oxygenase or cytochrome P450 and can produce around 20 distinct, short-lived but extremely potent intermediates (e.g. prostaglandins, prostacyclins, thromboxanes, leukotrienes, hydroxyeicosatetraenoic acid and hydroperoxyeicosatetraenoic acid). For example, prostaglandin E2 has been shown to increase membrane excitability by inhibition of K+ currents (Chen & Bazan, 2005). AA is at the same time a short-lived free radical that contributes to oxidative stress and is a potent modulator of K+ channels in hippocampal culture (Bittner & Müller, 2002). Some of the effects of AA are mimicked by H2O2 but only at much higher concentrations (Müller & Bittner, 2002).
However, neuronal cultures are criticized for abnormal neuronal behavior that may result from developmental maturation under artificial conditions, leading many to favor acute brain slice preparations or in vivo recording. For example, inhibitory synapses in dissociated neuronal cultures exhibit abnormal physiology from postnatal day 6–15, continuing to show properties of early (postnatal day 1–5) postnatal synapses even after 13–21 days in vitro (Henneberger et al., 2005). Cortical oscillatory behavior in vivo does not require GABAA-ergic transmission and disappears at postnatal day 6–7 (Garaschuk et al., 2000) but develops much more slowly in cortical cultures only after days 9–15 in vitro and requires GABAA receptor activation (Opitz et al., 2002).
Brain slices are usually maintained in a 95% O2 atmosphere in order to avoid O2-dependent cell damage at a depth of 90–150 µm below both surfaces of the slice, as observed for an interface slice configuration at 20% O2 with histology (Bingmann & Kolde, 1982). Actually, with an O2 partial pressure of 600 mmHg (79%) in the perfusion, microelectrode measurements have shown steep gradients of O2 partial pressure in the bath adjacent to the slice surface, with an O2 pressure gradient inside brain tissue of 400-µm slices at 24 °C from 60 to 15 mmHg, i.e. in a normal physiological range for neurons only 50 µm below the surface and a hypoxic range in the center of the slice, with observations of vacuolization of cytoplasm even in 300-µm-thick slices (Bingmann & Kolde, 1982). The work of Bingmann & Kolde (1982), comprising data from 300–1000-µm-thick slices at temperatures from 24 to 35 °C, shows somewhat lower O2 pressure at the submerged side of slices in comparison to the gas interface side, indicating even less efficient O2 supply in the submerged configuration. In order to avoid tissue hypoxia, recordings from submerged slices are usually performed at temperatures of 24–32 °C, significantly below 37 °C (cf. Colbert & Pan, 1999; Garaschuk et al., 2000; Henneberger et al., 2005). This appears to be essential for healthy brain slice electrophysiology and histology, typically showing excellent agreement with in vivo findings.
In addition, in brain slice we can unambiguously identify CA1 pyramidal neurons. For all these reasons, here we investigated in rat hippocampal slice the modulation of voltage-dependent K+ currents by AA and H2O2 in CA1 pyramidal neurons. We report strong selective suppression of the transient A-current of CA1 neurons by AA at a very low concentration (1 pm) that is mimicked by H2O2 (80 µm). Surprisingly, unlike the situation in neuronal culture, antioxidants do not simply block the effects of AA and H2O2 on K+ channels but often enhance their effects.
Materials and methods
Horizontal hippocampus/entorhinal cortex slices (300 µm) were prepared from ether-anesthetized 14–21-day-old Wistar rats, using standard procedures. Tissue was sliced at ∼4 °C in artificial cerebrospinal fluid (in mm: NaCl, 129; NaH2PO4, 1.25; glucose, 10; MgSO4, 1.8; CaCl2, 1.6; KCl, 3; NaHCO3, 26, pH 7.4) continuously bubbled with 95% O2/5% CO2. Slices were then maintained in oxygenated artificial cerebrospinal fluid at room temperature (24 °C) for at least 1 h before recording.
Whole-cell patch-clamp recordings were obtained from CA1 pyramidal neurons at 24 °C in submerged acute brain slices under an upright microscope (Olympus BX 51) under visual guidance using infrared (IR) video microscopy (Alix et al., 2003). Borosilicate pipettes filled with intrapipette solution (in mm: KCl, 120; CaCl2, 1; HEPES, 10; EGTA, 11; MgCl2, 2; glucose, 20, pH 7.3) had initial open-pipette resistances of 3–6 mΩ. The unphysiologically high intracellular conentration of Cl– causes a depolarizing shift of the reversal potential of Cl– currents that reduces Cl– leak currents in the voltage range of activation of voltage-dependent K+ currents. Eicosatetraynoic acid (ETYA), ascorbic acid, glutathione (GSH) and Trolox were applied intracellularly, diluted in intrapipette solution. In some experiments ascorbic acid, Trolox or GSH were applied by bath perfusion. The latter compounds were added to freshly-made oxygenated artificial cerebrospinal fluid, supplemented with 0.001 mm tetrodotoxin. All drugs were from Sigma (Deisenhofen, Germany). AA and ETYA were stored as 1 m stock solutions in dimethylsulfoxide at −20 °C. Experimental solutions were prepared immediately before use. Control recordings with the same concentration of dimethylsulfoxide had no effects on either IA or on voltage-gated delayed rectifier K+ current [IK(V)]. Ascorbic acid was used from freshly made stock when needed and kept in a dark container for up to 5 days. GSH was stored as a 20 mm stock in intrapipette solution when used for intracellular application. During experimentation solutions were kept on ice in darkness. Voltage clamp was maintained in whole-cell mode with an EPC-9 amplifier controlled by pulse software (both HEKA Electronik, Lambrecht, Pfalz, Germany) and currents filtered at 1.3 kHz. Subtraction and curve fitting of K+ currents were performed by IgorPro (WaveMetrics Inc.). Data are given as means ± SEM in absolute values or percentage of control. Statistical analyses were performed with prism (GraphPad Software Inc.) using two-tailed unpaired Student's t-test. A probability of P < 0.05 was considered to be significant.


Results
Modulation of voltage-gated transient K+ current by arachidonic acid
In whole-cell patch-clamp recording from CA1 pyramidal neurons, total outward K+ currents were recorded after an 800-ms hyperpolarizing prepulse to −110 mV (to remove inactivation) and subsequent depolarization of the membrane to potentials between −80 and +50 mV in increments of 10 mV. When the prepulse was followed by a 50-ms interval at −20 mV, IA inactivated completely and isolated IK(V) were recorded during subsequent voltage steps (Fig. 1D, 2, for pulse protocols see insets in C). IA was isolated by subtracting delayed rectifier from mixed currents (Fig. 1D, 1), as shown in 1, 3. IA had a maximum amplitude of 0.5–4 nA at +30 mV that was reached within 4 ms after the beginning of the voltage pulse. IA inactivated completely with a time constant of 7.8 ± 1.5 ms (Fig. 1A, Table 1). The maximum amplitude of IA was quite stable over 15 min of whole-cell recording (Fig. 1C, Table 1). When 1 pm AA was included in the patch pipette, IA decreased over time, starting within 6 min after obtaining whole-cell configuration. After 15 min of intracellular AA application through the patch pipette IA was reduced by −41.8 ± 5.5% (n = 9; P < 0.01, Fig. 1B and C). Inclusion of AA in the patch pipette did not affect the inactivation time constant of IA (Table 1).
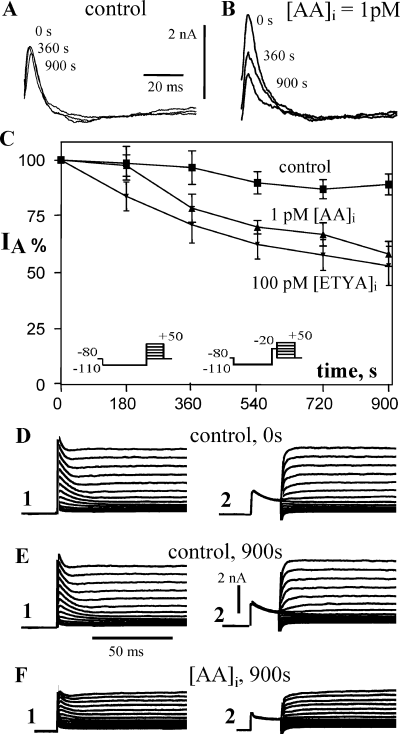
Suppression of voltage-gated transient K+ current (IA) by arachidonic acid (AA). (A–C) Intracellular application of 1 pm AA reduces the maximal transient K+ current (IA) over time after obtaining whole-cell configuration by −41.8 ± 5.5% (n = 9). The non-metabolizable AA analog eicosatetraynoic acid (ETYA) shows a similar effect on IA at 100-fold higher concentration (C). (D–F) Raw current traces for combined IA and voltage-gated delayed rectifier K+ current (1, pulse protocol: left inset in C), and for pure delayed rectifier currents after inactivation of IA by an interval at −20 mV for 50 ms (2, pulse protocol: right inset in C). Currents are shown for control immediately after obtaining whole-cell configuration (D, 0 s), after 900 s of recording (E, 900 s) and after 900 s of recording with 1 pm of AA in the patch pipette (F). Capacitative artifacts have been blanked out in this and the following figures.
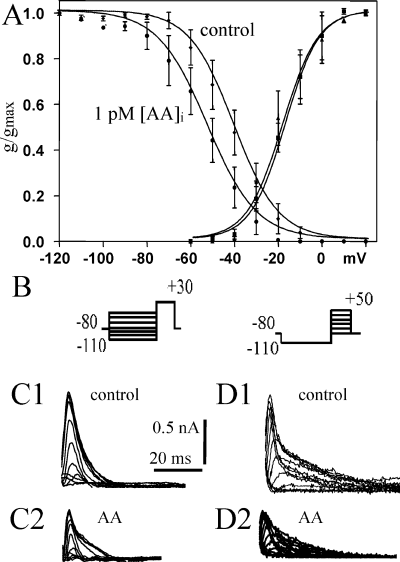
Intracellular arachidonic acid (AA) (1 pm) shifts steady-state inactivation to the left but does not affect voltage dependence of activation of voltage-gated transient K+ current. (A) Conductance–voltage relations and ‘Boltzmann’ fits for inactivation (left curves) and activation (right curves). (B) Pulse protocols for determining voltage dependence of steady-state inactivation (left) and activation (right). Representative recordings for inactivation (C) and activation (D).
| IA CA1 | n | Maximum amplitude(Δ% of control) | V50a (mV) | kactivation | V50i | kinactivation | τi | |||||
|---|---|---|---|---|---|---|---|---|---|---|---|---|
| At 0 min | At 15 min | At 0 min | At 15 min | At 0 min | At 15 min | At 0 min | At 15 min | At 0 min | At 15 min | |||
| Control | 9 | −10.9 ± 4.6 | −14.3 ± 0.3 | −18.1 ± 0.4 | 7.9 ± 0.3 | 7.8 ± 0.4 | −38.1 ± 0.7 | −36.7 ± 0.6 | 9.2 ± 0.5 | 9.3 ± 0.5 | 7.8 ± 1.5 | 8.5 ± 1.4 |
| +1 pm AA | 9 | −41.8 ± 5.5 | −18.1 ± 0.4 | −19.2 ± 0.9 | 7.8 ± 0.4 | 8.1 ± 0.8 | −41.4 ± 0.4 | −53.6 ± 0.6 | 10.2 ± 0.3 | 11.3 ± 0.6 | 8.1 ± 1.3 | 10.4 ± 1.7 |
| Control GSHin | 8 | −15.5 ± 7.2 | −20.1 ± 0.7 | −25.0 ± 1.2 | 11.5 ± 0.7 | 13.5 ± 1.1 | −54.6 ± 0.3 | −65.1 ± 0.5 | 6.4 ± 0.3 | 5.9 ± 0.4 | 8.5 ± 1.3 | 12.3 ± 2.0 |
| AA + GSHin | 6 | −61.6 ± 5.8 | −29.2 ± 0.9 | −21.5 ± 1.0 | 13.0 ± 0.9 | 12.3 ± 0.9 | −43.0 ± 0.8 | −58.7 ± 0.7 | 10.1 ± 0.7 | 12.3 ± 0.6 | 11.9 ± 2.5 | 21.3 ± 3.6 |
| Control asc.acidout | 5 | −59.1 ± 6.7 | −22.4 ± 0.9 | −26.6 ± 1.6 | 12.9 ± 0.8 | 16.3 ± 1.5 | −49.5 ± 0.3 | −56.5 ± 0.8 | 9.8 ± 0.3 | 9.5 ± 0.7 | 9.9 ± 1.0 | 15.8 ± 2.3 |
| AA + GSHin/asc.acidout | 4 | −23.6 ± 11.8 | −10.9 ± 0.8 | −18.9 ± 0.9 | 13.2 ± 0.7 | 13.8 ± 0.8 | −44.7 ± 0.6 | −56.0 ± 0.9 | 10.5 ± 0.5 | 10.7 ± 0.8 | 12.9 ± 4.9 | 18.3 ± 5.1 |
| Control Troloxin | 5 | −61.1 ± 2.7 | −21.3 ± 1.2 | −13.4 ± 1.0 | 13.5 ± 1.0 | 14.2 ± 0.9 | −44.8 ± 0.4 | −54.0 ± 0.1 | 9.9 ± 0.4 | 9.0 ± 0.7 | 4.5 ± 0.6 | 9.9 ± 1.4 |
| AA + Troloxin | 7 | −47.6 ± 12.2 | −19.5 ± 0.8 | −18.2 ± 1.0 | 11.7 ± 0.7 | 13.1 ± 0.9 | −50.2 ± 0.5 | −50.3 ± 0.7 | 11.3 ± 0.5 | 11.8 ± 0.7 | 8.4 ± 3.1 | 13.3 ± 3.7 |
| Control Troloxout | 4 | −6.6 ± 9.1 | −28.1 ± 1.4 | −32.5 ± 1.3 | 11.3 ± 1.3 | 12.8 ± 1.2 | −68.3 ± 0.8 | −68.4 ± 0.8 | 6.7 ± 0.7 | 8.5 ± 0.7 | 6.1 ± 0.8 | 7.5 ± 1.2 |
| AA + Troloxin,out | 4 | −26.8 ± 1.1 | −20.3 ± 2.1 | −25.5 ± 1.0 | 14.1 ± 1.8 | 13.2 ± 0.8 | −45.6 ± 0.6 | −58.0 ± 0.7 | 9.5 ± 0.5 | 12.0 ± 0.6 | 8.9 ± 0.9 | 10.7 ± 1.1 |
| +80 µm H2O2 | 7 | −79.7 ± 1.9 | −12.9 ± 0.8 | −20.8 ± 0.9 | 12.2 ± 0.7 | 14.9 ± 0.8 | −55.0 ± 0.6 | −63.6 ± 0.5 | 8.7 ± 0.5 | 9.0 ± 0.5 | 7.9 ± 1.6 | 13.5 ± 1.5 |
| H2O2 + GSHin | 4 | −34.8 ± 7.2 | −26.1 ± 1.2 | −17.2 ± 2.0 | 11.5 ± 1.1 | 16.6 ± 1.6 | −47.4 ± 0.4 | −50.2 ± 0.8 | 10.6 ± 0.4 | 11.6 ± 0.7 | 10.0 ± 3.3 | 19.5 ± 2.6 |
| H2O2 + GSHin/asc.acidout | 4 | −31.5 ± 4.9 | −11.8 ± 0.4 | −34.3 ± 1.4 | 10.5 ± 0.3 | 12.8 ± 1.2 | −44.9 ± 0.5 | −67.8 ± 0.6 | 9.1 ± 0.4 | 8.4 ± 0.5 | 5.7 ± 1.0 | 9.8 ± 1.0 |
- AA, arachidonic acid; GSH, glutathione. time = 0 (immediately after obtaining whole-cell configuration.
Like IA, IK(V) was quite stable under control conditions with a slight decrease of current amplitude over 15 min (−12.8 ± 2.3%, Fig. 2, cf. Table 2). AA in the patch pipette did not affect the delayed rectifier current IK(V) in any way (Fig. 2E, Table 2).
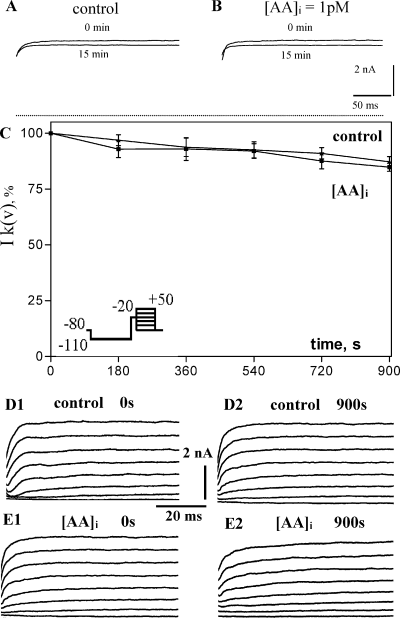
The voltage-gated delayed rectifier K+ current [IK(V)] is not affected by arachidonic acid (AA). (A and B) Maximal IK(V) recorded at 0 and 15 min of whole-cell recording shows a 15% decrease over time in control (A) as well as with 1 pm AA in the patch pipette (B). (C) Plot of IK(V) amplitude over time of whole-cell recording for control and for AA. (D and E) Original current recordings of IK(V) for several voltage steps in 10 mV increments from −20 to +50 mV (see inset in C) for control (D) and for AA at 0 s (D1 and E1) and 900 s (D2 and E2) of whole-cell recording.
| IK(V) CA1 | n | Max. amplitude(Δ% of control) | V50activation(0 min) | V50activation(15 min) | kactivation(0 min) | kactivation(15 min) |
|---|---|---|---|---|---|---|
| Control (2–6.8 nA) | 9 | −12.8 ± 2.3% | 6.3 ± 1.1 | 0.1 ± 1.0 | 18.5 ± 1.0 | 18.8 ± 0.9 |
| +1 pm AA | 9 | −15.2 ± 1.8% | 5.3 ± 0.9 | −2.8 ± 1.0 | 17.3 ± 0.8 | 18.6 ± 0.9 |
| Control GSHin | 8 | −20.8 ± 5.7 | 3.8 ± 0.8 | 1.2 ± 0.7 | 16.4 ± 0.7 | 16.2 ± 0.6 |
| AA + GSHin | 6 | −13.5 ± 4.6% | 0.7 ± 1.3 | −1.9 ± 0.9 | 19.1 ± 1.1 | 17.3 ± 0.8 |
| Control asc.acidout | 5 | −39.73 ± 7.3 | 3.0 ± 0.8 | 0.7 ± 0.7 | 16.4 ± 0.8 | 17.0 ± 0.8 |
| AA + GSHin/asc.acidout | 4 | −17.1 ± 1.3% | 4.4 ± 1.1 | 2.8 ± 1.0 | 18.4 ± 1.0 | 17.8 ± 0.9 |
| Control Troloxin | 5 | −39.4 ± 10.8 | 0.5 ± 0.9 | −4.5 ± 0.7 | 18.0 ± 0.8 | 17.1 ± 0.6 |
| AA + Troloxin | 7 | −20.8 ± 8.5% | −3.2 ± 0.9 | −1.2 ± 1.0 | 18.2 ± 0.8 | 19.4 ± 0.9 |
| Control Troloxout | 4 | −1.0 ± 5.7 | −2.3 ± 0.7 | −6.7 ± 0.8 | 17.7 ± 0.6 | 17.9 ± 0.7 |
| AA + Troloxin/Troloxout | 4 | −18.4 ± 10.6% | −3.3 ± 1.1 | −1.0 ± 1.0 | 19.3 ± 1.0 | 16.7 ± 0.9 |
| +80 µm H2O2 | 7 | −63.2 ± 5.1% | 1.4 ± 1.5 | −5.7 ± 1.5 | 11.3 ± 1.4 | 12.5 ± 1.3 |
| H2O2 + GSHin | 4 | −21.1 ± 5.3% | −3.3 ± 1.1 | −6.7 ± 1.2 | 19.2 ± 1.0 | 17.6 ± 1.0 |
| H2O2 + GSHin/asc.acidout | 4 | −23.0 ± 3.9% | 3.5 ± 0.8 | −8.2 ± 0.9 | 17.7 ± 0.7 | 17.7 ± 0.8 |
- AA, arachidonic acid; GSH, glutathione.
In order to test whether the effects of applied AA on IA were due to AA itself or one of its many bioactive metabolites, we employed the non-metabolizable analog ETYA. ETYA is not hydrolysed by cyclo-oxygenase, lipoxygenase or cytochrome P450 but it also blocks the activities of these enzymes. Intracellular ETYA (1 pm) was ineffective in reducing IA. Intracellular application of a 100-fold higher concentration of ETYA (100 pm) reduced IA to a similar extent as 1 pm AA (−47.1 ± 8.7%, n = 7, Fig. 1C). Like AA, ETYA did not affect IK(V) in any way (not shown).
In dissociated hippocampal cultures AA (10 pm intracellular) has also been shown to shift the voltage dependence of inactivation of IA (Bittner & Müller, 1999). The conductance–voltage plot of Fig. 3A (left curves) illustrates that AA shifted voltage dependence of steady-state inactivation to the left by 11 mV in CA1 pyramidal neurons in rat brain slice, in addition to the reduction of maximal conductance described above. AA did not affect the voltage dependence of activation (Fig. 3, curves on the right side).
Oxidative mechanisms in reduction of voltage-gated transient K+ current by arachidonic acid
Arachidonic acid and ETYA may affect protein function by binding-induced conformational changes. Alternatively, as both molecules can act as free radicals, they may oxidize certain amino acids. To test for an involvement of oxidative effects of AA we used three antioxidants, GSH, ascorbic acid and Trolox (a water-soluble analog of vitamin E or α-tocopherol), either alone or in different combinations. Figure 4B illustrates the somewhat surprising finding that, when GSH (20 mm) was included in the patch pipette, the AA effect on the maximal IA was not inhibited but actually enhanced (−61.6 ± 5.8% at 15 min). In addition, the reduction of IA was accelerated, as shown by the significant reduction of IA after only 3 min of whole-cell recording (*, −44.1 ± 9.3%, n = 6 for AA + GSHi as compared with −2.4 ± 4.8%, n = 9 for AA alone, 4, 1) and inactivation was significantly slowed (P < 0.01, Fig. 4C inset). GSH itself had no effect on IA or IK(V) (n = 6, Tables 1 and 2). The augmentation of the AA effect by GSH could be mediated by oxidation of GSH to oxidized glutathione (GSSG) and, more effectively, oxidation of the channel protein by GSSG, i.e. a catalytic effect of GSH (Nelson & Cox, 2005).
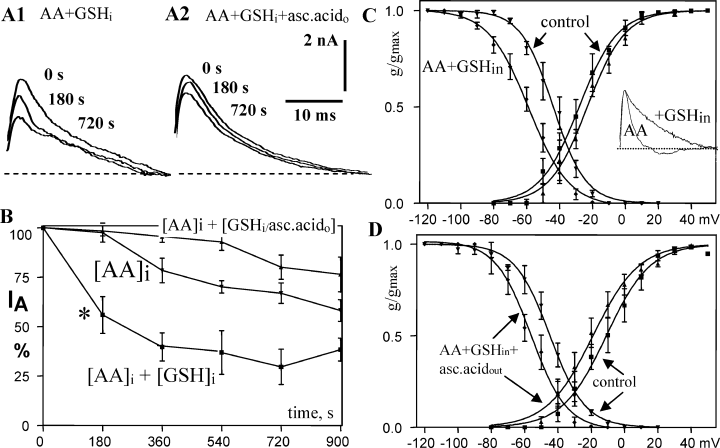
Interaction of arachidonic acid (AA) and antioxidants with voltage-gated transient K+ current (IA). (A and B) Glutathione (GSH)i enhances the AA effect on IA (A1 and B), particularly early after the beginning of recording/application (*), while ascorbic acid blocks the AA effect (A2 and B: [AA]i + [GSHi/asc.acido]). (C and D) GSHi and ascorbic acido do not prevent the AA-mediated shift in steady-state inactivation (C and D, control = 0 vs. 15 min, left curves) but ascorbic acid slightly reduces it (D, left curves) and also shifts the activation curve to more negative potential (D, right curves). AA + GSHi (but not AA alone) slow inactivation of IA, as demonstrated by an overlay of traces after scaling to the same amplitude (C, inset, trace = 40 ms).
In contrast to GSH, ascorbic acid (0.4 mm), an antioxidant that apparently crosses cell membranes easily, blocked reduction of IA when bath-applied in addition to AA + GSHi (Fig. 4A, 2, and B). In slices superfused with ascorbic acid only, IA steadily decreased during whole-cell recording over 15 min to 40.9 ± 6.7% and IK(V) to 60.3 ± 7.3% of initial current amplitude (n = 5), and tau of IA inactivation was also significantly slowed (P < 0.01, Table 1) indicating that ascorbic acid may also catalyse oxidative reactions with these channels, depending on the oxidative stress in the vicinity of the membrane.
The combination of GSHi and ascorbic acid did not prevent the AA-mediated shift in steady-state inactivation (Fig. 4C and D), suggesting that this shift is caused by a mechanism independent of reduction of maximal conductance. GSHi + AA, like AA alone, had no effect on voltage dependence of activation (Fig. 4C). The combination of GSH and ascorbic acid + AA caused a 6-mV shift of activation to more negative potentials that is statistically significant with 95% confidence (Fig. 4D).
Despite its water solubility Trolox, like its relative tocopherol, is assumed to primarily protect membrane lipids and transmembrane protein segments of oxidation. In slices superfused with Trolox (100 µm), both IA and IK(V) were completely stable during 15 min whole-cell recording (Tables 1 and 2). Intracellular application of Trolox strongly reduced IA by −61.1 ± 2.7%(Fig. 5A, 1, and B) and IK(V) by −39.4 ± 10.8%, and shifted steady-state inactivation of IA by −9 mV and activation of IA by +8 mV and of IK(V) by −4 mV (Tables 1 and 2). The inactivation time constant of IA was progressively slowed over 15 min during whole-cell recording from 4.5 to 9.9 ms (P < 0.01, Table 1). Figure 5B shows that intracellular application of AA together with Trolox, applied from both sides of the cell membrane or only from the intracellular side, did not enhance the early effect of Troloxi on IA (Fig. 5B, *). IA showed significant recovery (Fig. 5B) with prolonged recording time in the presence of Troloxi/o.
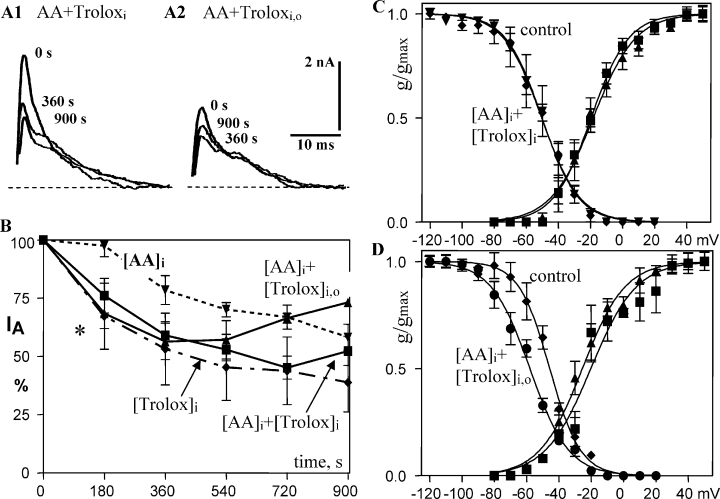
Interaction of arachidonic acid (AA) and antioxidants with voltage-gated transient K+ current (IA). (A and B) Intracellular application of the vitamin E analog Trolox (10 µm) with AA does not prevent reduction of IA (A1 and B) but Trolox, applied from both sides of the cell membrane, does significantly recover IA with prolonged recording time (A2 and B). Intracellular application of 10 µm Trolox by itself reduces IA similar to 1 pm AA (B). (C) Troloxi inhibits the AA shift of steady-state inactivation and vice versa (left curves, cf. Fig. 3A). There is no shift in voltage dependence of activation (right curves, control = 0 vs. 15 min). (D) In the presence of Trolox on both sides of the membrane plus AAi, steady-state inactivation shifts over 15 min recording time by −12 mV to a more negative potential, similar to the effect of AAi or of Troloxi.
Again, voltage-dependent inactivation showed responses independent of modulation of maximal conductance. Troloxi inhibited the AA shift of steady-state inactivation and vice versa (Fig. 5C). The voltage dependence of activation of IA was unchanged. Further, AAi in the presence of Trolox on both sides of the membrane shifted steady-state inactivation by −12 mV to a more negative potential (over 15 min), similar to the effect of AAi or of Troloxi alone. For the triple combination (AAi + Troloxi,o) there was no shift of voltage dependence of activation (Fig. 5D, curves on right side).
To evaluate the direct effects of oxidative modulation of IA (in the absence of AA), we applied the non-lipid oxidizing compound H2O2 via the patch pipette. Generally, 80 µm H2O2 mimicked the effect of 1 pm AA on the maximal amplitude of IA. The H2O2 effect was even stronger than that of AA (−79.6 ± 1.9%, P < 0.01, n = 6, Fig. 6A and E). Like AA, it also shifted the voltage dependence of inactivation to more negative potentials (−7 mV, Fig. 6B). Unlike AA, H2O2 also shifted the voltage dependence of activation to more negative potentials (−6 mV, Fig. 6B) and slowed inactivation of IA (P < 0.05, Table 1). The effects of H2O2 further support the proposal that modification of IA by AA is mediated primarily by oxidative reactions. We therefore also tested for effects of antioxidants on the effects of H2O2, expecting complex changes as described above for AA. The physiological antioxidant GSHi (20 mm) strongly reduced inhibition of maximal IA by H2O2 (−34.8 ± 7.2%, n = 4, Fig. 6A) and eliminated the H2O2-mediated shift of steady-state inactivation (Fig. 6C). While H2O2 shifted the voltage dependence of activation to the left, H2O2 in the presence of GSHi caused a shift to the right (+7 mV, Fig. 6C right curves). In addition, the slope of the conductance–voltage relationship was decreased (k = 14.9 ± 0.8 for H2O2 and k = 11.6 ± 0.7 for H2O2 + GSHi) and slowing of IA inactivation was enhanced (P < 0.001, Table 1).
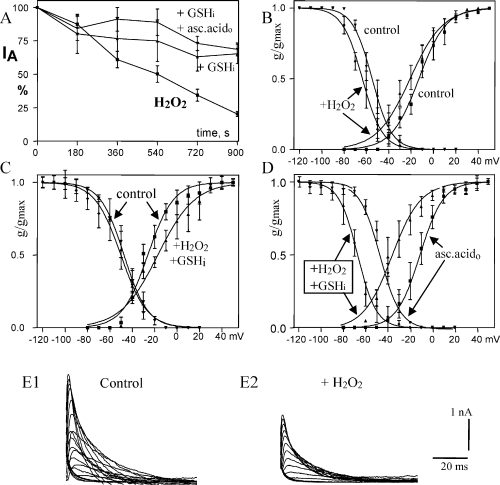
Effects of intracellular H2O2 (80 µm) and antioxidants on voltage-gated transient K+ current (IA). (A) H2O2 mimics the effect of arachidonic acid on maximal IA but this effect is not enhanced but inhibited by glutathione (GSHi) or GSHi + ascorbic acido (+ GSHi and + GSHi + asc.acido, respectively). (B) H2O2 shifts voltage–conductance relations of inactivation (left curves) and activation (right curves) to more negative potentials. (C) GSHi eliminates the H2O2-mediated shift in inactivation (left curves) but for activation causes a shift to a more positive potential and change in slope (right curve). (D) In the presence of ascorbic acido, GSHi + H2O2 shifts inactivation and activation of IA by −22 mV to more negative potentials. (E) Representative current traces of IA for determination of the voltage dependence of activation for control immediately after obtaining whole-cell configuration (E1) and after 15 min recording with H2O2 in the patch pipette (E2).
Addition of ascorbic acid to the artificial cerebrospinal fluid (0.4 mm) appeared, together with GSHi, to inhibit the H2O2 effect on maximal IA amplitude (−31.5 ± 4.9%, n = 4, Fig. 6A). In contrast, ascorbic acid did not support GSHi inhibition of the shifts of voltage dependence of inactivation and activation but even enhanced shifts caused by H2O2 by more than 150% (Fig. 6D, Table 1). Unlike with H2O2 + GSHi there was no significant change of slopes of voltage dependence of activation or inactivation (Fig. 6D, Table 1). IA inactivated much faster in the presence of ascorbic acid but tau still almost doubled from 5.7 to 9.8 ms during 15 min whole-cell recording with H2O2 + GSHi + ascorbic acido (P < 0.01, Table 1).
In agreement with the results reported for neurons in primary cultures, H2O2 also suppressed the delayed rectifier K+ current IK(V) in CA1 pyramidal neurons in brain slices (−63.2 ± 5.1%, n = 6, Fig. 7A and C, Table 2). H2O2 shifted the voltage dependence of activation to more negative potentials (−7 mV, Fig. 7B). GSHi and also GSHi + ascorbic acido inhibited reduction of IK(V) by H2O2 (−21.0 ± 5.3%, n = 4 and −23.0 ± 3.9%, n = 4, respectively, Fig. 7A and D).
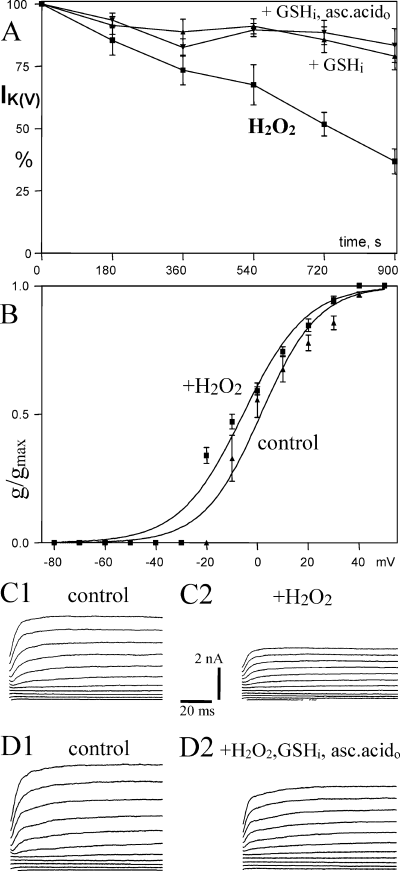
Effects of intracellular H2O2 (80 µm) and antioxidants on voltage-gated delayed rectifier K+ current [IK(V)]. (A) H2O2 suppresses the delayed rectifier K+ current IK(V) and this effect is inhibited by glutathione (GSHi) or GSHi + ascorbic acido (+ GSHi and + GSHi,asc.acido, respectively). (B) H2O2 shifts voltage dependence of activation of IK(V) to a more negative potential. (C) Representative traces of IK(V) for determination of voltage dependence of activation for control immediately after obtaining whole-cell configuration (C1 and D1) and after 15 min recording with H2O2 (C2) or H2O2 + GSHi in the patch pipette (D2). Recordings of D were obtained in the presence of ascorbic acido.
Discussion
Our experimental data characterize oxidative modulation of voltage-activated K+ currents in CA1 pyramidal neurons in rat hippocampal brain slice by the free fatty acid AA, H2O2 and antioxidants. An ultra low patch pipette concentration of AA (1 pm) consistently inhibits the maximal conductance of the transient K+ current IA by about 50% while not affecting the delayed rectifier current IK(V) (1, 2). This effect is not mimicked by the non-metabolizable AA analog ETYA (1 pm), except at a 100-fold higher concentration (100 pm). As ETYA inhibits the AA-metabolizing enzymes cyclo-oxygenase, lipoxygenase and cytochrome P450, these results suggest a direct specific effect of AA (1 pm) or ETYA (100 pm) on IA. This effect develops over 15 min of dialysis in agreement with diffusional exchange between the patch pipette and soma/proximal dendrites of a CA1 pyramidal neuron (cf. Pusch & Neher, 1988) with clear reduction of IA after 3 min for ETYA and 6 min for AA. The need for a higher concentration of ETYA is probably due to substitution of the four highly reactive carbon double bonds of AA with the much more stable triple bonds of ETYA.
In addition, AA causes a significant shift (−12 mV) of steady-state inactivation to more negative potentials. This AA shift will cause a further reduction of IA by 10–40% when IA is activated from a membrane potential of −60 to −50 mV (Fig. 3).
The effects of AA are probably mediated by at least two oxidation sites of the channel protein as the two effects, reduction of maximal conductance and shift of steady-state inactivation, are independently affected by ascorbic acid, trolox and H2O2. The oxidation sites appear to be intracellular, as intracellular AA and (membrane-impermeable) GSH have strong effects. Surprisingly, intracellular application of 20 mm GSH did not block the effect of AA in CA1 neurons from brain slice, as reported for hippocampal neurons in primary culture (Bittner & Müller, 1999; Müller & Bittner, 2002), but strongly enhanced it, particularly at 3 min of whole-cell recording (Fig. 4). It is possible that GSH is oxidized to GSSG that, in turn, more effectively oxidizes a cystein in the channel protein that is not accessible to GSSG in cultured neurons because of subunit composition or differential expression of other interacting proteins. In contrast, a combination of GSHi with extracellular application of ascorbic acid (0.4 mm) significantly inhibited the reduction of IA by AA. Shift of steady-state inactivation to more negative potentials was not affected by GSHi but was reduced to −7 mV by the combination of GSHi and ascorbic acid.
A qualitatively different profile of effects was seen with the vitamin E (α-tocopherol) analog Trolox. Like GSHi, Trolox applied from the inside (10 µm) or from the outside (100 µm) mimicked or enhanced, respectively, the early reduction of IA by AA but did not enhance the AA effect at later times or even reduced it when bath-applied (Fig. 5A and B). Intracellular but not extracellular application of Trolox by itself reduced IA (Fig. 5B, Table 1). The AA shift of steady-state inactivation was completely blocked by intracellular application of Trolox (and vice versa) but not by the combination of Troloxo and Troloxi. This further supports the reduction of maximal IA conductance and shift of steady-state inactivation being independent modifications of the channel protein. Two or more oxidation sites for shift of steady-state inactivation may explain the puzzling shift of steady-state inactivation with Trolox application from both sides of the membrane.
Enhancement of the AA effect by some antioxidants may be mediated by catalysing the underlying reactions between AA and other radicals in the slice tissue and channel protein. Antioxidants have some capacity to buffer oxidants but in this process they themselves become oxidants that may, in turn, more effectively oxidize certain targets. For example, GSH reductase becomes oxidized by the reduction of GSSG to GSH and, in turn, is reduced by oxidizing NADP+ to NADPH, thereby acting as a catalyst of the reaction between NADP+ and GSSG. Reduction of superoxide anions to H2O2 by superoxide dismutase gives an electroneutral molecule that much better permeates into lipid membranes (Nelson & Cox, 2005). Oxidation of channel proteins may well be facilitated by antioxidants in similar ways. Such a view is further supported by the effects of H2O2 on IA. Intracellular application of H2O2 (80 µm) reduced IA more effectively than AA and to a similar extent as AA together with GSHi (Fig. 6A, Table 1). In contrast to the effect of AA, GSHi effectively inhibited the effect of H2O2 on IA, as did the combination of GSHi + ascorbic acid.
Independent modulation of maximal conductance and steady-state inactivation of IA is further supported by a significantly weaker, in comparison to AA, shift of V50 with H2O2. Further, in the presence of ascorbic acid in the perfusion, H2O2 + GSH, but not AA + GSH, causes an enhanced shift of V50 to a more negative potential for both inactivation and activation of IA (6, 4).
Unlike AA, H2O2 also reduced the maximal conductance of the delayed rectifier current IK(V) in a GSHi-sensitive way (Fig. 7), further supporting the unique and highly specific interaction of AA with IA.
We conclude that reduction of IA by extremely low concentrations of intracellular AA or by H2O2 in hippocampal culture is not a developmental artifact of non-physiological culture conditions but is real in CA1 neurons that have developed in vivo. In view of antioxidants blocking the effects of AA in cultured neurons (Bittner & Müller, 1999; Müller & Bittner, 2002), the enhancing effects of several ‘antioxidative’ agents in brain slice were unexpected and suggest fundamental differences of oxidative regulation of the A-current in cultured hippocampal neurons compared with CA1 pyramidal neurons in brain slice. This may have implications for the relevance of excitotoxicity and oxidative stress research using neuronal cultures. Maintenance of slices with 95% O2 levels in the perfusion is apparently not a problem, as it results in normal to hypoxic tissue O2 levels (see Introduction and Bingmann & Kolde, 1982). Clearly, AA as well as H2O2, particularly in older age or in neurodegenerative disease (Auerbach & Segal, 1997), will strongly affect K+ currents and, via depolarization and inactivation of Na+ channels, dendritic excitability and spike-timing-dependent synaptic plasticity/learning (Giese et al., 1998). Antioxidative therapy may well have negative effects in this context.
Acknowledgements
Supported by Deutsche Forschungsgemeinschaft grant Mu 809/7-2 and NIH grant RR15636. We thank Dr C. William Shuttleworth for helpful comments on the manuscript.
Abbreviations
-
- AA
-
- arachidonic acid
-
- ETYA
-
- eicosatetraynoic acid
-
- GSH
-
- glutathione
-
- GSSG
-
- oxidized glutathione
-
- IA
-
- voltage-gated transient K+ current
-
- IK(V)
-
- voltage-gated delayed rectifier K+ current


