The comparable size and overlapping nature of upper limb distal and proximal muscle representations in the human motor cortex
Abstract
The purpose of this study was to determine the relative size and location of proximal and distal upper limb muscle representations in the human motor cortex. Motor-evoked potentials (MEPs) evoked by transcranial magnetic stimulation were recorded in the proximal muscle anterior deltoid (AD) and in the distal muscles extensor carpi radialis (ECR) and first dorsal interosseus (1DI). The coil was moved in steps of 1 cm along a grid drawn on a tight-fitting polyester cap placed on the subject's head. At each location, four stimuli were delivered at 1.2 times the active motor threshold (AMT), and MEPs averaged in real-time. The peak-to-peak amplitude of each muscle's mean MEP was measured at each stimulation site. The area of a muscle's representation was measured by a pixel-counting algorithm. The optimal point of each muscle's areal representation, which corresponds to the locus near which the largest MEPs are obtained, was determined by fitting a 3D Lorentzian function to the data points. The optimal point of distal muscles tended to be situated more laterally along the motor strip than that of proximal muscles. However, there was no statistically significant difference between the size of the areal representations and they overlapped considerably. Additionally, in another five subjects, using a small 45-mm coil placed in a hyper-focal orientation, maps were obtained at a stimulus intensity of 1.1–1.15 times the AMT of the muscle with the lowest threshold, usually the 1DI. Even in this very stringent condition, the mapped representations of the AD, ECR and 1DI overlapped, notwithstanding that sharp demarcations between borders were also apparent. These observations demonstrate that stimulus spread alone does not explain the overlap of muscle representations. These results show that commonly used proximal and distal upper-limb muscles, taken individually, are controlled by motor cortical territories of approximately equal size that significantly overlap despite differences in the location of their optimal points.
Introduction
In a previous study we demonstrated that when human subjects point to a target, activation of shoulder, elbow and wrist muscles involve, at least in part, common motor cortical circuits (Devanne et al., 2002). Our neuro-behavioural results are consistent with a large body of kinematic, neuroimaging, neuroanatomical and neurophysiological observations, which indicate that task-related arm muscles are controlled in an integrated manner (Capaday, 2004). For example, during pointing movements made by monkeys to different targets, a large proportion of motor cortex (MCx) neurons are clustered into groups related to distinct muscle synergies having different functional roles, such as extending the limb (Holdefer & Miller, 2002). The most striking observation made in our study (Devanne et al., 2002) was that the input/output (I/O) curves − a measure of excitability of the corticospinal pathway (Devanne et al., 1997) − of the wrist muscle extensor carpi radialis (ECR) was markedly enhanced by activation of the shoulder muscle anterior deltoid (AD). The results obtained from measures of intracortical inhibition, ECR H-reflexes and the differential effects of threshold magnetic vs. threshold anodal stimulation showed that the enhancement of the ECR I/O curve was intracortical in origin (Devanne et al., 2002). By contrast, the I/O curve of the intrinsic finger muscle first dorsal interosseus (1DI) was unaffected by activity in more proximal muscles. We thus suggested that activation of shoulder, elbow and wrist muscles during pointing involves at least in part common motor cortical circuits; whereas the motor cortical circuits involved in activation of the 1DI appear, at least during pointing, to act independently.
In that study the spatial relation between the motor cortical representations of these three muscles was not mapped. If common motor cortical circuits underlie our observations, the representations of shoulder, elbow and wrist muscles should at least in part overlap. Attempts at characterizing proximal and distal muscle representations in man were made using magnetic stimulation (e.g. Wassermann et al., 1992). However, comparison between muscles was difficult because the motor threshold of proximal muscles is relatively high, thus requiring high-intensity stimuli to map the areal representation. For example, Wassermann et al. (1992) using magnetic stimulation reported that the threshold of the resting AD was on average more than 70% of the maximum stimulator output, whereas other authors were unable to activate this muscle when at rest (Amassian et al., 1995; Devanne et al., 2002). Additionally, no previous mapping study determined to what extent stimulus spread contributed to the derived map characteristics. Here we report the results of a detailed mapping study of representative muscles acting at the shoulder (AD), wrist (ECR) and index finger (1DI). In the event, we found that the areal representations of these muscles are similar in size and overlap significantly.
Materials and methods
Seventeen healthy right-handed subjects (mean age ± SEM, 28.4 ± 1.4 years) participated in the study. All subjects gave their free and informed consent to participate in the study in accordance with the declaration of Helsinki. The experimental protocol was approved by the Lille Hospital Ethics Committee.
EMG recordings
Pairs of surface Ag–AgCl electrodes were placed over the belly of muscles acting at different joints. Recordings were obtained from the 1DI, the ECR and the AD. The electrodes were attached to the skin by O-rings of double-sided adhesive film. The diameter of the recording surface of the AD electrodes was larger (9 mm) than that of ECR and 1DI electrodes (1 mm). The electrodes were connected to optically isolated preamplifiers. A large reference electrode connected to the common input of the preamplifiers was placed around the wrist. The EMG signals were amplified, high-passed at 10 Hz and low-passed at 1 kHz prior to sampling at 2 kHz by an A/D converter. The same signals were also separately amplified, high-pass filtered at 10 Hz, rectified and low-passed at 100 Hz before sampling at 2 kHz. The mean level of background EMG activity was measured from the rectified signals over a 50-ms time segment just prior to stimulation. For each muscle, comparison of responses obtained in the different tasks was done for matched levels of background EMG activity. The level of maximal EMG activity of each muscle was determined while the subject exerted an isometric maximal voluntary contraction (MVC).
Mapping areal representations with transcranial magnetic stimulation (TMS)
Magnetic stimuli were applied over the scalp using a MagStim 200 electromagnetic stimulator with a figure-of-eight coil (Type 9925). The diameter of each winding was 70 mm. In five subjects a smaller coil having 45-mm windings was used. The coil was used in the ‘hyper-focal’ configuration, i.e. with only the junction of the windings in contact with the skull. The subject wore a snugly fitting polyester cap on which a grid of 100 cm2 was drawn. The intersection points of the grid lines were spaced 1 cm apart and served as a visual reference against which the coil was positioned by the experimenter. The junction of the coil was held tangential to the skull with the handle directed in the posterior direction. The coordinates of each intersection point on the grid were measured relative to the vertex. No corrections were made to the linear grid measurements to account for the convexity of the head. Distortions of distance measures were the same for all representations mapped. The medio-lateral coordinate was measured as the distance from a reference line connecting the nasion to the inion passing through the vertex. The antero-posterior coordinated was measured as the distance from the interaural line passing through the vertex. The coordinate system was numbered such that medio-lateral coordinates were negative on the left hemisphere and positive on the right. The antero-posterior coordinates were positive in going toward the nose and negative toward the occiput.
Experimental protocol
Subjects were comfortably seated with their forearm placed on an arm-rest. The focal point, defined as the lowest threshold site giving a response specifically in the intended muscle at rest, was found for the two distal muscles, ECR and 1DI, but not for the AD. Once the focal point was identified, the active motor threshold (AMT) was then determined. The AMT was defined as the magnetic stimulus intensity just necessary to evoke a visually discernable above-background motor-evoked potential (MEP) in about 50% of trials when the target muscle was voluntarily activated at 10% of MVC. In all subjects, two or three iterations of the threshold determination procedure were done to ensure consistent values.
The representation of the AD was mapped while subjects tonically flexed their arm (AD active) and maintained the more distal forearm and hand muscles at rest. The ECR was mapped while the wrist was tonically extended (ECR active) and shoulder, elbow and hand muscles relaxed. In a similar manner, the areal representation of the 1DI was mapped while the index finger was abducted. In all cases, the joint angle required to activate a given muscle at 10% MVC was determined. The required joint angle was thereafter indicated to subjects by a large protractor with a movable dial. Particular care was taken to ensure that only one of the three muscles of interest was contracted in each task, whilst the others were completely relaxed. This was done by continuously monitoring the EMG signals on a multichannel oscilloscope and audio monitors. During the tasks, four magnetic stimuli were delivered at each site with interstimulus intervals randomly varying between 3 and 5 s. The magnetic stimulus intensity was adjusted to 1.2 × AMT of the target muscle in 12 subjects. In the five remaining subjects, using the smaller coil, the stimulus intensity was adjusted to 1.1 × the AMT of the muscle with the lowest threshold. The MEPs were averaged in real-time. The muscle representations were determined in random order. For each subject, the muscle representations were determined in a single experimental session.
Data analysis and curve fitting
 (1)
(1)For every subject, a contour plot was drawn to measure the area of each muscle's representation. The border of the contour plot corresponded to the minimal discernable MEP. The contour plot was drawn on a reference grid. A script was written in VisionBuilder (LabView, National Instruments, Austin, USA), which counted the number of pixels included in the contour plot. The area of the contour plot in cm2 was calculated using the scale factor relating pixels to centimetres.
We compared the slope parameters a and b obtained from the Lorentzian function between muscles using a one-way anova. For a given muscle map, the Student's t-test was used to compare the slope parameters a vs. b, and to compare the surface area of cortical representation between two muscles (AD vs. ECR and AD vs. 1DI). A one-way anova was used to determine differences between the coordinates (x0, y0) of the optimal points. When the distribution of variables was not normal, or the variances unequal, the non-parametric Mann–Whitney rank sum test or the Kruskal–Wallis one-factor anova on ranks was used, as appropriate.
Results
Surface area of representations
The AMTs of the AD, ECR and 1DI expressed as a percentage of maximal stimulator output were, respectively, 39.1 ± 1.1%, 34.4 ± 1.6% and 36.4 ± 1.9% (mean ± SEM throughout the paper). These values are not significantly different (anova, P = 0.06). Figure 1 illustrates examples of MEPs and their spatial distribution obtained from the AD, ECR and 1DI in two different subjects. For subject 1, MEPs were obtained from the AD in 18/33 loci and in 12/27 for ECR (Fig. 1A). For subject 2, MEPs were obtained in the AD in 20/34 loci, while in the 1DI MEPs were obtained in only in 14/27 loci (Fig. 1B). The data of these two subjects suggest that the response probability of proximal muscle MEPs was greater than that of distal muscles. The areal representation of the AD muscle was in fact larger than that of the ECR in 4/8 subjects, and in 2/4 it was larger than that of the 1DI (Fig. 4). However, the average size of the areal representation of each muscle was not statistically different across subjects (Fig. 4).
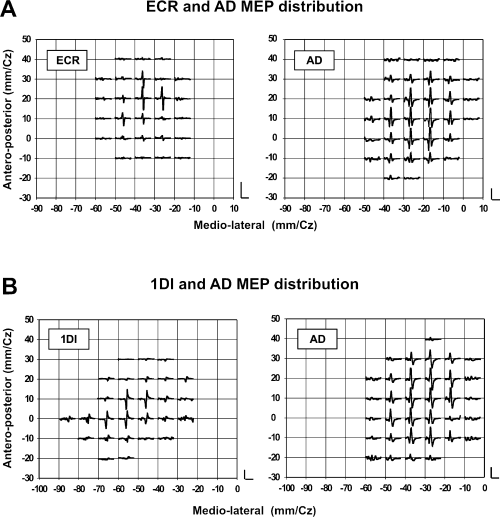
(A) Examples, in one subject, of the spatial distribution of extensor carpi radialis (ECR) and anterior deltoid (AD) motor-evoked potentials (MEPs) are shown in the upper panel. The mean EMG levels during the mapping were 17.5 ± 1.5 µV for ECR and 68 ± 5 µV for AD. The vertical and horizontal calibration bars in this panel represent 1 mV and 25 ms, respectively. Note the overlap between the representations of these two muscles and the fact that AD MEPs were obtained from more scalp sites than ECR MEPs. The stimulus intensity was 1.2 × AMT in all cases. (B) Examples of the spatial distribution of first dorsal interosseus (1DI) and AD MEPs, taken from a different subject, are shown in the lower panel. The mean EMG levels during the mapping were 90 ± 6 µV for 1DI and 39 ± µV for AD. The horizontal calibration bars for each graph in this panel are 25 ms and the vertical calibration bars are 1 mV in the left graph and 500 µV in the right graph.
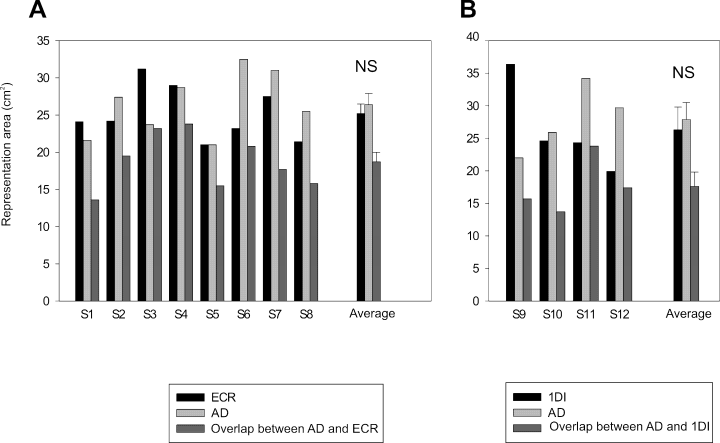
(A) Histogram of the areal representations and overlap of the extensor carpi radialis (ECR) and anterior deltoid (AD) measured in eight subjects. (B) Similarly, the areal representation and overlap of first dorsal interosseus (1DI) and AD measured in four other subjects. For each muscle the average value (± SEM) of its areal representation across subjects is shown on the right side of each graph; ‘NS’ indicates a non-significant statistical difference.
Figure 2 shows contour plots of the AD and ECR representations obtained from the data in Fig. 1A. The areas of the AD and ECR contours were 26.4 cm2 and 21.2 cm2, respectively. The two representations overlapped by 18.7 cm2 as shown in the lower portion of the figures, where the areal representations are superimposed on a scaled model of the subject's skull. In Fig. 3, the contours of the AD and 1DI representations, taken from the data in Fig. 1B, are shown as well as the overlap (13.7 cm2) between them. The area of the AD representation in this subject was 25.9 cm2 and that of the 1DI was 24.6 cm2. This result was typical; the mean areas of representation were in fact very similar for the three muscles. In the eight subjects tested (Fig. 4A), the mean representation area of the ECR was 25.2 ± 1.3 cm2 and that of the AD was 26.4 ± 1.5 cm2, the difference was not statistically significant (P = 0.55). Similarly, there was no statistical difference (P = 0.72) in the size of the areal representation of the AD (27.9 ± 2.6 cm2) and 1DI (26.3 ± 3.5 cm2) in the other four subjects (Fig. 4B).
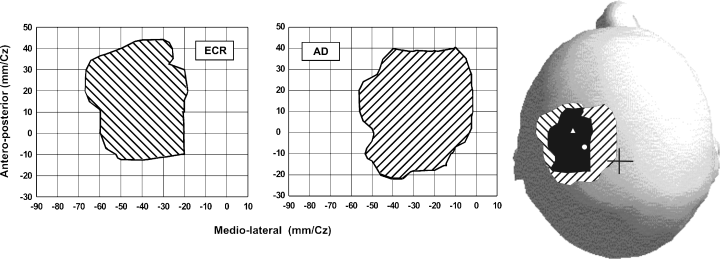
Contour plots of the extensor carpi radialis (ECR) and anterior deltoid (AD) representations taken from the subject in Fig. 1. In the lower part of the figure the contour plots are drawn on a scaled model of the subject's skull. The overlap between the two representations is shown in black. The position of the vertex is indicated by a cross. The position of the optimal point of the AD is indicated by a white circle and that of the ECR by a triangle.
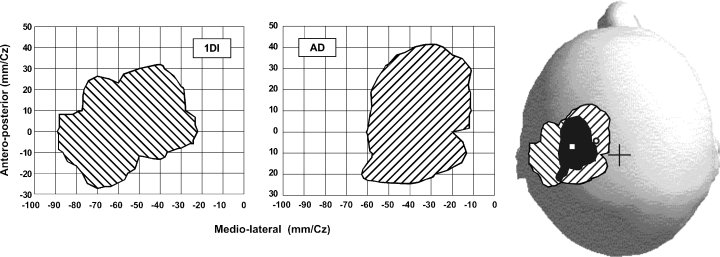
Contour plots of the first dorsal interosseus (1DI) and anterior deltoid (AD) representations taken from the subject in Fig. 1. In the lower part of the figure the contour plots are drawn on a scaled model of the subject's skull. The overlap between the two representations is shown in black. A cross indicates the position of the vertex. The position of the optimal point of the AD is indicated by a white circle and that of the 1DI by a square.
Overlap of cortical maps
As described in the preceding paragraph, the AD, ECR and 1DI representations overlapped in all subjects. For the AD and ECR, the shared areal representation was on average 18.7 ± 1.3 cm2; while that of the AD and 1DI was on average 17.6 ± 2.2 cm2. These values were not significantly different (P = 0.65). Expressed as a percentage of the total representation, i.e. the sum of all representations, the shared representation of the ECR and AD ranged between 43.0% and 71.0% (mean, 57.4 ± 3.4%). The overlap between AD and 1DI was a little lower, ranging between 35.6% and 65.0% (mean, 47.6 ± 7.1%).
Location of the optimal point
Fitting of the Lorentzian function to the data points allowed calculation of the coordinates of the optimal point of each muscle's representation [x0 and y0 in Eq. (1)], i.e. the site at which the MEP was greatest. Two examples of the 3D data plots fitted by a Lorentzian function are shown in Fig. 5. Although we did not use polar coordinates, as did some authors to eliminate the discrepancies due to skull morphology between subjects, the calculated locus of the optimal point of each muscle was in fact relatively constant from one subject to another. On average, as shown in Fig. 6A, the medio-lateral location of the optimal point of the 1DI relative to the vertex was −52.6 ± 3.8 mm, that of the ECR was located more medially at −48.7 ± 2.6 mm, and that of the AD yet more medially at −40.9 ± 2.4 mm. However, the only statistically significant difference was found between the optimal point of the 1DI and that of the AD in the medio-lateral direction (anova, P = 0.011). The same test applied to the antero-posterior location of the optimal points relative to the vertex showed no statistical differences (AD, 8.8 ± 2.4 mm; ECR, 10.2 ± 2.3 mm; 1DI, 12.3 ± 5.0 mm).
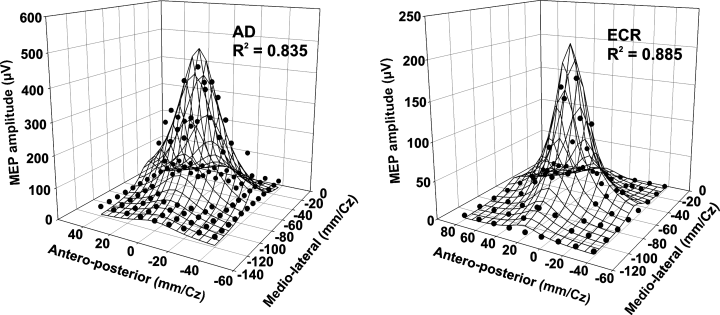
Two examples of the 3D Lorentzian function fitted to the data points. Note that the estimated coordinates of the optimal point [x0 and y0 in Eq. (1)] of each muscle's representation is within the area from which motor-evoked potentials (MEPs) were evoked and very close to the site at which the largest response was obtained experimentally. The total variance accounted for by fitting the Lorentzian function to the data points is given by the R2 value.
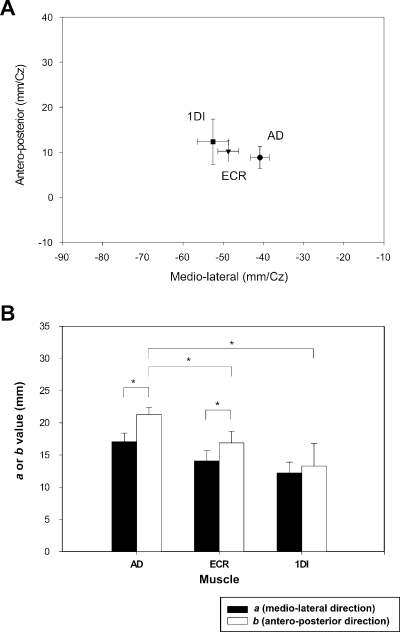
(A) Plot of the mean value (± SEM) of the optimal point (x0 and y0) for each muscle averaged across subjects. The only statistically significant difference was found between the optimal point of the first dorsal interosseus (1DI) and that of the anterior deltoid (AD) in the medio-lateral direction. (B) Histogram representing the values of the two slope parameters, a and b, of the Lorentzian function. Significant differences (P < 0.05) are indicated by asterisks.
Shape of the fitted Lorentzian functions
The two slope parameters, a and b, gave an indication of the steepness of the 3D surfaces in the medio-lateral and antero-posterior directions, respectively. A between-muscles comparison of these parameters did not reveal a significant difference (anova, P = 0.14) of steepness in the medio-lateral direction (Fig. 6B). In the antero-posterior direction the steepness of the AD muscle's 3D surface was significantly less than that of the ECR (Dunn's post hoc test, P = 0.028) and 1DI (Dunn's post hoc test, P = 0.01) (Fig. 6B). In other words, the gradient of the 3D surfaces in the medio-lateral direction was similar between muscles, whereas for the AD the gradient in the antero-posterior direction was less steep than for the two other muscles. Some significant differences also appeared when a within-muscle comparison was made. The parameter a was lower than b for the AD (respectively, 17.1 ± 1.3 and 21.3 ± 1.1; P = 0.023), as well as for ECR (a = 14.1 ± 1.6, b = 16.9 ± 1.8; P = 0.046). For 1DI, there was no difference between the slope parameters (12.2 ± 1 vs. 13.3 ± 3.5). The difference observed between the two slope parameters shows that MEPs of the AD and ECR decreased more rapidly in the medio-lateral than in the antero-posterior direction.
Low threshold hyper-focal mappings
In an additional five subjects the areal representations of the AD, ECR and 1DI were determined with a small figure-of-eight coil in the ‘hyper-focal’ configuration. The stimulus intensity was set at 1.1–1.15 times the AMT of the muscle having the lowest threshold, usually the 1DI. Contour plots of the areal representation of the AD and 1DI measured in one subject are shown in Fig. 7A. It is clear that the areal representations overlap considerably, by 8.5 cm2 in this example. The overlap represents 82% of the 1DI representation and 68% of that of the AD. It can also be seen that the distance between the optimal points of the AD and 1DI was less than 1 cm. More importantly, a stimulus applied at the 1DI optimal point elicited a substantial response in the AD (Fig. 7B). Figure 7C shows the effects of moving the coil away from the 1DI optimal point on 1DI and AD MEPs. Moving the coil by 1 cm laterally from the 1DI optimal point decreased the 1DI MEP by 58%. A further lateral movement of the coil by 1 cm nearly abolished the 1DI MEP. By contrast, AD MEPs were relatively constant, despite the fact that the coil was moved further away from its optimal point than it was from that of the 1DI. Of equal importance was that the AMT of the 1DI was 40% of stimulator output and that of the AD was 44%. Thus, the responses shown in Fig. 7C were obtained with a stimulus intensity that was very near AMT for the AD (i.e. 46%).
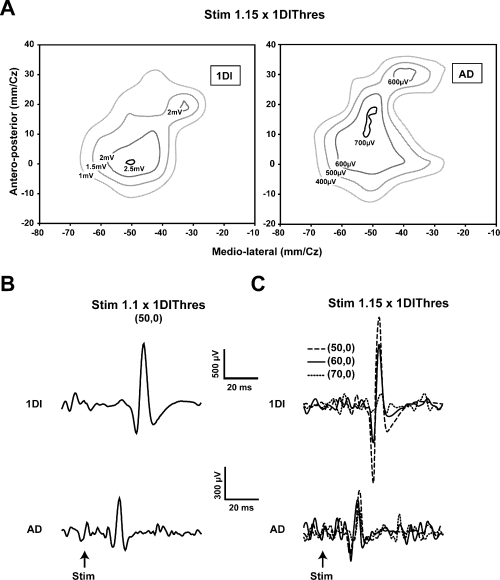
Evidence showing that current spread does not explain the overlap of representations. (A) Contour plots of the first dorsal interosseus (1DI) and anterior deltoid (AD) in a single subject obtained at 1.15 × AMT of the 1DI. Note the slightly larger representation of the AD and the considerable overlap of the two representations. Note also that the optimal points are within 10 mm of each other in the antero-posterior direction and essentially coincident in the medio-lateral direction. (B) When the stimulus is reduced to 1.1 × AMT of the 1DI and the stimulus applied at the 1DI optimal point, MEPs are elicited in both the 1DI and AD. Note that in this case the stimulus is at the AD threshold. (C) Movement of the coil laterally in steps of 10 mm reduces the 1DI MEPs significantly, whereas the AD MEPs are relatively more constant. The mean EMG level in the 1DI during the mapping was 30 ± 2 mV and that of the AD was 26 ± mV. Further details are given in the text.
Discussion
The main new finding reported here is that, contrary to often encountered descriptions of human motor cortical organization, the areal representations of commonly used proximal and distal muscles are similar in size and overlap considerably despite differences in the location of their optimal points. The comparable areal representation of the single muscles AD, ECR and 1DI does not imply that the areal representation of the shoulder, wrist and hand area are of similar size. There are about 22 muscles in the arm; nine muscles move the shoulder and five the wrist (Alexander, 1992). By contrast, about 29 intrinsic and extrinsic muscles move the hand (Alexander, 1992). It is therefore not surprising that the hand area occupies a larger motor cortical territory than that of the shoulder or wrist (Penfield & Rasmussen, 1950). What our results suggest is that commonly used shoulder, wrist and intrinsic hand muscles, taken singly, are represented in areas of similar size in the human MCx.
It is also important to consider that TMS-derived motor cortical maps provide the relative size of a representation, not the actual cortical tissue area devoted to that representation. Depending on the stimulus intensity, the method may overestimate the size of the representations. For example, as shown in Fig. 8, a decrease of stimulus intensity in the radial direction from 1.1 × threshold to 1.0 × threshold occurs over about 1 cm on either side of the coil centre (Barker, 1999; Jalinous, 2004). Thus, responses may be obtained with the coil centre situated medio-laterally up to 1 cm away from the border of a representation. However, this stimulus spread effect applies to all mapped representations, as depicted in Fig. 8.
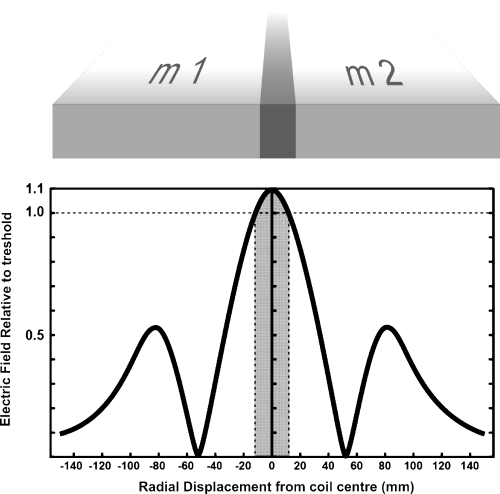
This figure explains that with near-threshold stimuli the overlap due to stimulus spread is minimal. The figure shows a 2D representation of the electric field intensity as would occur at the border of two muscle representations (m1 and m2) in the MCx. The large central peak, where induced tissue current is maximal, occurs at the junction of a figure-of-eight coil and falls off steeply with radial distance from the coil centre. For our large coil the stimulus remains above threshold over about 12 mm on either side of the central junction (greyed zone). This is much less than the overlap in, for example, the medio-lateral direction measured with the small coil (e.g. see Fig. 7). The side lobes occur at the edges of the coil and are well below threshold. Note that the activation function is related to the spatial derivative of the electric field, this variable is also spatially restricted to the greyed zone. The electric field shown is for a Magstim type 9925 coil (Jalinous, 2004).
A recent study of the motor cortical representation of the medial deltoid (MD) in elite volleyball players reinforces the idea that TMS provides measures of the relative size of muscle representations (Tyc et al., 2005). With the same experimental and analytical methods utilized here, Tyc et al. showed that the AD representation is about 70% larger in the elite volleyball players compared with that of a control group composed of runners. Furthermore, the MD representation was larger in the dominant vs. the non-dominant hemisphere of the volleyball players (Tyc et al., 2005).
The present results differ from those of Wassermann et al. (1992) and Wilson et al. (1993). Both studies report a larger representation for distal vs. proximal muscles, and the former a nearly complete overlap of representations. In the study of Wassermann et al. (1992) the mapping was done using the maximal stimulator output, with the subjects at rest. Thus, stimulus spread or activation of cortico-cortical inhibitory processes cannot be excluded. Consistent with the present results, Schulze-Bonhage et al. (1998) reported overlap of the AD and 1DI representations, despite differences in the location of their optimal points. Neither the size of the representations nor their overlap was measured. However, it may be inferred from their Fig. 2 that the areal representations were of similar size and they seem to nearly completely overlap, ours do not.
In the remainder of this section we discuss whether stimulus spread alone explains the overlap of areal representations and the functional significance of our findings.
On the overlap of areal representations
As discussed above, while the relative sizes of areal representations are relatively independent of stimulus intensity, the overlap of muscle representations is not. As shown schematically in Fig. 8, the amount of overlap measured is directly related to the intensity of the stimulus relative to threshold. The greater the stimulus-to-threshold ratio the more apparent overlap will be measured. For a near-threshold stimulus, little apparent overlap would be measured (Fig. 8). We derived maps using a stimulus of 1.1–1.2 × AMT, defined relative to the muscle with the lowest AMT. Taking into account that the AMTs of the three muscles studied were nearly the same, it follows that the overlap we observed is not significantly due to stimulus spread, but a genuine feature of human motor cortical organization. Additionally, inspection of the data presented in Fig. 1 and the location of the maximal MEP for each muscle shown in 2, 3 reveals that the locus of maximal response was in the overlap zone. For example, the locus of the maximal ECR and AD MEP are nearly coincident (Fig. 1A). The near-threshold maps shown in Fig. 7 reinforce the point. The representation of the AD in that subject was in fact larger and overlapped than that of the 1DI, despite the fact that the stimulus was very near the AD AMT and 15% above the 1DI AMT. There was in addition a sharp demarcation of the border between representations, which was also reported by Schulze-Bonhage et al. (1998). We also found that the overlap between the AD and ECR (18.7 cm2) was not significantly different from that between the AD and 1DI (17.6 cm2), despite the fact that the AD optimal point is further from that of the 1DI than that of the ECR. Taken together, these observations are not consistent with the idea that the overlap is simply due to stimulus spread. The most parsimonious explanation is that these muscles share common motor cortical territories. An ingenious experiment by Amassian et al. (1995) further supports our interpretation. In their experiment, they located two scalp sites at which TMS activated the abductor pollicis brevis (APB) and the deltoid, one medial and the other lateral. Some 20 min after inflating, above arterial pressure, a cuff placed around the forearm stimulation of the lateral site failed to evoke a response in either muscle. But stimulation of the medial site elicited a larger response in the deltoid and none from the APB. This experiment demonstrates as the authors put it ‘… the unlikelihood that physical spread to a common medial site explains the wide deltoid representation’. The results of high-resolution fMRI, PET and MEG experiments also support the idea of a spatially extended and overlapping nature of muscle representations in the human MCx (reviewed by Grafton et al., 2000). However, in these studies co-activation of several muscles during task performance cannot be excluded. Thus, activated cortical areas may not correspond to a single muscle's representation. In the present study, particular care was taken to ensure that activity was restricted to the intended muscle. In summary, the overlap of muscle representations appears to be a genuine feature of human motor cortical organization. In commenting on their rendition of the motor homunculus, Penfield & Rasmussen (1950) wrote ‘A figurine of this sort cannot give an accurate indication of the specific joints in which movements take place, for in most cases movement appears at more than one joint simultaneously’. While a number of mechanisms likely underlie this observation, the overlap of muscle representations is among them.
Microstimulation-based mapping experiments in animals demonstrated that a given muscle is represented in a multitude of non-contiguous loci and in various combinations with other muscles (e.g. Armstrong & Drew, 1985; Donoghue et al., 1992). TMS likely activates many such loci, simultaneously making for a more coarse-grained map whose contiguous appearance is further reinforced by the rendering procedures used in human mapping studies. Nonetheless, the data shown in 1, 7 are consistent with the microstimulation-derived maps in animals; large responses in muscles acting at different joints may be obtained by low-threshold stimulation of the same cortical locus. In the cat, it was shown that such observations are not due to spread of stimulus current, or the result of conduction along intracortical axonal branches, to a single focus of representation (Schneider et al., 2001). Our results are in fact rather similar to those obtained in animals. Perusal of MCx maps derived by microstimulation shows a large number of independent finger zones, whilst others are intermingled with wrist, elbow and even shoulder zones (e.g. Gould et al., 1986; Donoghue et al., 1992; Park et al., 2001). In particular, Park et al. (2001) found in the forelimb area of the MCx of rhesus macaques a central core in which distal muscles are represented (finger, hand, wrist), surrounded by a ‘horseshoe’-shaped zone in which proximal muscles (shoulder, elbow) are represented. In between these two zones they found a relatively large zone in which distal and proximal muscles are represented. They suggested that this zone contains neurons that specify functional synergies of distal and proximal muscles. The zone of overlap between the AD and ECR representations found in this study may in fact contain such neural circuits specifying functional synergies and explains why the I/O curve of the AD is enhanced when the ECR is co-active (Devanne et al., 2002). Our results also partly reconcile classic mapping studies (e.g. Penfield & Rasmussen, 1950) with the current perspective of motor cortical organization (reviewed by Sanes & Schieber, 2001; Schieber, 2001; Capaday, 2004). Despite considerable overlap of representations, the optimal point of the AD is on average more medially situated along the motor strip than those of the more distal muscles ECR and 1DI. A similar somatotopic progression was also demonstrated by Wassermann et al. (1992) and by the stereotactic mapping study of Krings et al. (1998). However, in our study only the location of the AD and 1DI optimal points differed significantly. This suggests the existence of relatively independent finger zones and may explain why during, at least during pointing, the I/O curve of the 1DI is not affected by activity in more proximal muscles (Devanne et al., 2002). Thus, the classic notion that proximal muscles are represented more medially along the motor strip than distal muscles is not without merit, but the overlap of representations must be emphasized. It is also important to consider that experiments using spike-triggered averaging of rectified EMG activity in monkeys (McKiernan et al., 1998) showed that over 45% of recorded cortico-motoneuronal cells facilitated at least one proximal muscle (elbow or shoulder) and at least one distal muscle (wrist, digit and intrinsic hand muscles). On the assumption that this is also the case in humans, it is difficult to see how discrete non-overlapping representations can be obtained.
Functional implications
Turton & Lemon (1999) stressed the idea that during natural movements the motor cortical systems of proximal and distal muscles must cooperate, and Amassian et al. (1995) suggested that the overlap of representations is part of the neural substrate for such interactions. Indeed, we have recently shown that motor cortical circuits controlling shoulder muscles are in part functionally coupled with those that control more distal muscles, such as the wrist and elbow (Devanne et al., 2002). Maps of muscle representations in the MCx are essentially static descriptions that reflect, among other things, the conditions of the experiment. No conclusions about how the neural circuitry of the MCx is actually used, or the strength of corticospinal connections, can be inferred from them. For example, despite the fact that TMS does not readily activate the AD muscle at rest (Amassian et al., 1995; Devanne et al., 2002), responses of single motor units to TMS show that the size of the short latency, presumably monosynaptic, peak of the post-stimulus time histogram is similar for motor units of the AD and those of intrinsic hand muscles (Colebatch et al., 1990). The similar areal representations of the AD and 1DI reported here may be part of the explanation. Similarly, the large AD representation seems relevant in explaining the accuracy of human pointing and reaching movements (Lacquaniti & Soechting, 1982). A positioning error at the shoulder leads to a larger angular error between hand and target than a comparable positioning error of the index finger. The large representation of the AD would suggest that the efficacy of motor cortical control of the AD may be comparable to that of finger muscles. More importantly, the shoulder is involved either as a base of postural support for movements of the forearm and hand, or in their transport. The large representation of the AD and its overlap with forearm and hand muscles is likely a neural substrate of such motor coordinations. Perusal of simian motor cortical maps obtained by microstimulation shows a large number of zones in which wrist, elbow and shoulder representations are intermingled (e.g. Gould et al., 1986; Donoghue et al., 1992). The number of motor cortical sites from which shoulder muscles were activated was nearly equal to those from which wrist muscles were activated (Donoghue et al., 1992). Park et al. (2001) demonstrated in rhesus monkeys a specific motor cortical region containing neurons that represent functional synergies of distal and proximal muscles (Park et al., 2001).
Conclusion
The results presented here are consistent with the Jackson–Walshe perspective on the functional organization of the MCx, viz. that the MCx represents complex patterns of overlapping and graded movement/muscle representations (see Graziano et al., 2002; Capaday, 2004). The overlap of muscle representations is consistent with and provides a basis for the idea that the upper limb is controlled in an integrated manner based on the selection of movement-related muscle synergies (Capaday, 2004).
Acknowledgements
The authors thank A. Turlure, V. Tiffreau, P. Ronchon, S. Mordon, F. Roy, P. Vachon and G. Charette for their technical assistance. Dr A. Belhaj-Saïf provided constructive comments and suggestions on a draft of the manuscript. This work was supported by the Association Française contre les Myopathies (AFM) and by the Canadian Institutes of Health Research (CIHR).
Abbreviations
-
- 1DI
-
- first dorsal interosseus
-
- AD
-
- anterior deltoid
-
- AMT
-
- active motor threshold
-
- APB
-
- abductor pollicis brevis
-
- ECR
-
- extensor carpi radialis
-
- I/O
-
- input/output
-
- MCx
-
- motor cortex
-
- MD
-
- medial deltoid
-
- MEP
-
- motor-evoked potential
-
- MVC
-
- maximal voluntary contraction
-
- TMS
-
- transcranial magnetic stimulation


