Taxon-related diversity patterns from the continental shelf to the slope: a case study on nematodes from the Western Indian Ocean
Abstract
A study was carried out across the continental shelf and slope in the Western Indian Ocean along the Kenyan margin to unravel depth-related species diversity patterns portrayed by different nematode families. Sediment samples were collected along four bathymetric transects at 20, 50, 200, 500, 1000 and 2000 m. Three nematode families were selected for species analysis, based on their general occurrence with relatively high numbers and diversity from shelf to slope. All three families exhibited a distinctly different shelf and slope nematode species community. However, all three families also had a significant proportion of species that displayed a eurybathic distribution. Coincidentally, Microlaimidae, the least species-rich family had the most eurybathic species (75%) compared to Comesomatidae (39%) and Chromadoridae (32%). Total number of species per depth zone along the sampled area (gamma diversity) was three to four times the average number of species (alpha) per station. The difference was more pronounced at the slope than at the shelf. The species turnover was also higher at the slope than at the shelf stations. Each of the three families had a different diversity pattern: Comesomatidae showed a peak at mid-depth, Chromadoridae increased with depth, and Microlaimidae showed no prominent change with depth. When the three families were combined, the shelf maintained a lower diversity compared to the slope (both local and regional). There was no consistency between genus and species diversity patterns with depth, indicating that genus diversity data may not be a proxy for species diversity. At the lowest taxonomic level (species), the slope showed a higher diversity than the shelf, whereas at higher (genus) taxonomic level the diversity was comparable between the slope and the shelf. The number of species encountered increased with the number of samples analysed and did not reach asymptote, meaning that the area was still under-sampled. This situation points to the possibility of an even higher regional diversity.
Introduction
The high deep-sea species diversity in the benthos has been recognized since the work of Hessler & Sanders (1967). Evidence for this high diversity in different taxonomic groups is continually emerging for different areas worldwide (e.g.Brandt et al. 2007a; Janussen & Tendal 2007). However, the spatial patterns in diversity, and the processes that generate and maintain them are still largely unknown (Gage, 1997; Grant 2000; Snelgrove & Smith 2002; Ellingsen & Gray 2002; Gallucci et al. 2008). Furthermore, there is still an ongoing controversy about how the slope diversity relates to the shelf diversity (Gray et al. 1997; Gray 2000, 2002; Gage, 2004). Whereas local diversity of several benthic taxa often shows increased values on the slope compared to on the shelf (Boucher & Lambshead 1995; Gray 1997; Gray et al. 1997; Rex & Etter 2010), regional diversity may be much lower along the slope compared to the shelf (Lambshead & Boucher 2003).
Several hypotheses have been put forward to explain the generation and maintenance of the high local deep-sea species diversity (e.g.Thistle 1979; Grassle & Maciolek 1992; Grassle & Morse-Porteous 1987; Houston 1994). Recently, Gallucci et al. (2008) provided experimental evidence to show that, while biogenic patchiness and disturbance created by megafaunal organisms may influence the structure and diversity of deep-sea nematode assemblages, they cannot account for the maintenance of the remarkably high levels of species coexistence. The authors conclude that evolutionary history as proposed by Sanders (1968) may be a major process maintaining high diversity.
Large-scale regional diversity in the deep sea is suggested to be influenced by large-scale processes such as hydrodynamics, glaciation processes, and connectivity of different ocean basins (Grassle & Maciolek 1992; Rex et al. 1993; Gage, 1997; Thistle 1979; Culver & Buzas 2000). Species invasions and associated changes in regional diversity in the deep sea have been suggested to result from alterations in oceanographic conditions such as changes in isotherms and ice cover (Smith et al. 1998). However, the concept of high regional diversity in the deep sea was challenged by Lambshead & Boucher (2003), who argued that local patches of high diversity in the deep sea are repeated over large areas with the same species, so that regional diversity is rather moderate.
Deep-sea diversity has been shown not only to increase but also to decrease with increasing depth (Rex 1981; Gray 1997; Levin et al. 2001). Overall, there seems to be no general pattern applicable to different taxa, or even within the same taxon, in different geographical regions. In some deep-sea studies, diversity has been shown to follow a unimodal or parabolic trend along the depth gradient, where species diversity increases with water depth up to mid-slope depths and then decreases again towards the abyssal and hadal depth (Rex et al. 1997; Rex & Etter 2010). Such diversity patterns have been observed for deep-sea nematodes (Etter & Grassle 1992; Boucher & Lambshead 1995; Muthumbi et al. 2004) and harpacticoid copepods [ES (30)] (Baguley et al. 2006) in different parts of the oceans. However, data that were collected in a standardized way that allow comparisons of shelf and slope communities within the same region are rather rare (Gray 1994; Danovaro et al. 2010). Furthermore, in most deep-sea studies, nematode identifications have been done up to genus level (e.g.Vanaverbeke et al.1997a,b; Vanreusel et al. 2000; Muthumbi et al. 2004; Ingels et al. 2009) and only a few studies are based on identifications to species level (Soetaert et al. 1991; Fonseca & Soltwedel, 2009; Danovaro et al. 2008; Gambi et al. 2003; Lambshead et al. 2003), understandably because of the amount of work and complexity involved in species identification. Additionally, most deep-sea studies on nematodes have been done in the Atlantic and Pacific Oceans and none has been done in the Indian Ocean except for Muthumbi et al. (2004).
To identify patterns in diversity in relation to water depth or, more precisely, to identify the major shifts from the shelf to the slope, and the extent to which these patterns differ between related taxonomic groups, we investigated the species diversity in three nematode families from the Kenyan shelf to mid-slope depths in the Western Indian Ocean. Three families were selected based on their general distribution in this area, with comparable abundances from the shelf to the slope, and on their representation by several genera. We report here on nematode species diversity patterns along a depth transect from 20 to 2000 m off the Kenyan Coast. All nematodes were identified up to genus level (Muthumbi et al. 2004), while all specimens from the three selected dominant families (Comesomatidae 10%, Chromadoridae 7.1% and Microlaimidae 4.6%) were identified to species level. We illustrated various aspects of species distribution (community assemblage, species diversity (α, β, γ Hill’s N0, N1) and species accumulation curves) in order to unravel any patterns in species composition and diversity that there might be in relation to bathymetry, genus diversity and relative abundance. We identified the following hypotheses that were tested based on the available dataset: (i) Species composition of each of the studied families represented in the shelf nematode communities differs from those of the upper slope communities. (ii) The diversity (local as well as regional) is higher on the slope compared to the shelf. (iii) The observed depth-related patterns are similar for different taxonomic levels (species, genus or family), and for different taxa at the same taxonomic level (comparison of patterns within the three main families). (iv) The observed patterns in diversity are related to the relative importance of the investigated taxa.
Description of the study site and sampling procedure
The study was carried out in the Western Indian Ocean off the Kenyan Coast. Four depth transects were sampled over a geographical distance of 600 km in the Western Indian Ocean (WIO) at Kiwayu (K), Tana (T), Sabaki (S) and Gazi (G) during the northeast and southeast monsoon periods. At each transect, four depths (stations) were sampled from the continental shelf (50 m) and continental slope (500, 1000 and 2000 m) (Fig. 1). In some transects, samples were also taken at continental shelf-depths of 20 and 200 m. Sampling methods and sample processing is as in Muthumbi et al. (2004). Sediment samples were taken using a modified box core. At each station, one to three replicate box cores were taken and from each box core, two sub-samples were taken using a plastic core of 2.1 cm diameter and pooled. The samples were fixed in 4% formalin. In the laboratory samples were processed for meiofauna analysis using a 32-μm sieve as the lower limit. For further details we refer the reader to Muthumbi et al. (2004).
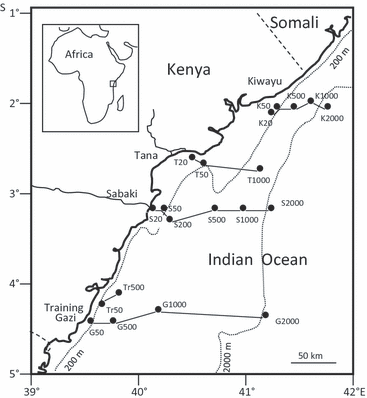
Map of the study site (Western Indian Ocean along the Kenyan Coast).
Nematode genus diversity along the Kenyan Coast between 20 and 2000 m showed a parabolic trend, where maximum diversity was observed at mid-depth (500 m) and decreased slightly towards the shallow and the deeper ends (Muthumbi et al. 2004). The mid-depth coincided with an oxygen minimum that resulted from a low oxygenated intermediate water mass flowing from the Red Sea into the WIO through the highly productive Arabian Sea, rather than to high productivity in the area (Muthumbi et al. 2004). Semeneh et al. (1995) observed a low nutrient concentration and low phytoplankton uptake in the water column, indicating that the area is generally oligotrophic. Nematode density and diversity were both structured by depth gradients and not by latitudinal variation in this area (Muthumbi et al. 2004). There were also no differences observed in environmental characteristics between the four transects. Thus, latitudinal variations were not investigated in this study, as bathymetric gradients were most prominent, whereas latitudinal differences were not expressed at this scale. Rex & Etter (2010) also concluded that in studies that include both horizontal and vertical components of faunal change, most variation in species composition is depth-related.
Methods
Sample analysis
At least 150 nematodes were picked out at random from each replicate sample, mounted on microscopic slides according to the method of Seinhorst (1956) and identified to genus level. A total of 10,159 nematodes were identified to genus level (Muthumbi et al. 2004). Of the 10,159 nematodes identified, 2239 individuals that belonged to three families Comesomatidae (1074), Chromadoridae (692) and Microlaimidae (473) were identified to species level. Species descriptions were published in Muthumbi & Vincx (1997, 1998a,b, 1999) and Muthumbi et al. (1997). Each of these three families was represented by more than one genus at different water depths but with varying abundances.
Data analysis
Data was analysed using PRIMER5 software (Plymouth Marine Laboratory; Clarke & Gorley 2001). Species assemblage similarities/dissimilarities were calculated as Bray–Curtis indices for groups of stations based on depth. Hill’s diversity numbers (Hill’s N0, N1) were calculated as measures of species diversity. Species accumulation curves were generated separately for each family by depth. Alpha (α), the average diversity of all samples per depth, beta (β), the species turnover between samples or replicates at each depth (γ/α), and gamma (γ), the total number of species at each depth (counts of species), were calculated according to Whittaker (1960).
Analysis of similarities (ANOSIM) on untransformed nematode abundances was used to identify significant differences in composition between shelf and slope communities for the three families. The similarity in species composition in samples from the same depth and dissimilarity in samples from different depths was analysed for each family separately using SIMPER (analysis on presence/absence data).
STATISTICA was used to test for significant differences in diversity measures between depths (ANOVA). The assumption of homogeneity was tested by the Levene’s test, and the Tukey HSD test was applied for post hoc comparisons.
Results
(Dis)similarities between shelf and slope communities
In the study area, Comesomatidae was represented by 12 genera and 44 species, Chromadoridae by 19 genera and 80 species, and Microlaimidae by 8 genera and 27 species. Although all three families were abundant from shelf to slope, their change in relative abundances with depth displayed a unique pattern for each family (Fig. 2). Comesomatidae had a maximum abundance of 15% at mid-depth (500 m) and decreased towards the shallow (10%) and deeper slope (4%) stations (Fig. 2a). Chromadoridae had the opposite trend in distribution, with a high relative abundance (9%) at the shallow shelf (20 m) and the deep slope station (2000 m), but a minimum of 5.5% at 500 m (Fig. 2b). Microlaimidae had more or less similar relative abundances (3–4%) at all depths, except at 50 m, which recorded the maximum relative abundance of 8%, mainly because of the high abundance of Microlaimus (Fig. 2c).
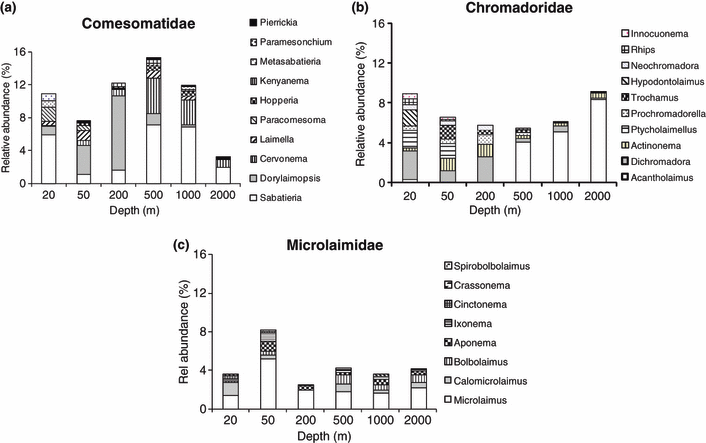
Overall relative abundance of genera per depth: (a) Comesomatidae; (b) Chromadoridae; (c) Microlaimidae.
There was a clear shift in nematode community composition at genus level from the shelf to the slope, especially within the Comesomatidae and the Chromadoridae (Fig. 2). Particular genera that had high relative abundances at 20, 50 and 200 m tended to have lower abundances at 1000 and 2000 m, or even disappeared. For instance, in Comesomatidae, the genus Dorylaimopsis was absent at depths below 200 m and in Chromadoridae, the genus Ptycholaimellus was absent in depths below 50 m. The existence of a shelf and a slope nematode community was also confirmed at species level by an ANOSIM (Table 1). In general, most of the ANOSIM pair-wise comparisons between stations within the shelf (20–200 m) and stations within the slope (500–2000 m) had low R-values and the P-values were not significant. On the other hand, comparisons between the shelf stations and the slope stations showed high R-values and significant P-values (<0.05), confirming differences in the nematode species assemblage between the two bathymetric zones at species level for the three families.
| Sample similarities between depth (R-values and P%) | |||||||
|---|---|---|---|---|---|---|---|
| Comesomatidae | Chromadoridae | Microlaimidae | |||||
| Overall | R = 0.554 | P = 0.1% | R = 0.336 | P = 0.1% | R = 0.211 | P = 0.1% | |
| Depth | Comparisons between shelf stations | ||||||
| 20 | 50 | 0.22 | 6.1 | 0.085 | 21 | −0.61 | 68.4 |
| 20 | 200 | 0.91 | 0.8 | 0.438 | 2.4 | −0.097 | 79.4 |
| 50 | 200 | 0.09 | 17.1 | 0.044 | 31.5 | 0.059 | 29.1 |
| Comparisons between shelf and slope stations | |||||||
| 20 | 500 | 0.97 | 0.1 | 0.409 | 0.7 | 0.334 | 0.3 |
| 20 | 1000 | 0.97 | 0.2 | 0.592 | 0.3 | 0.352 | 1.6 |
| 20 | 2000 | 0.53 | 0.1 | 0.93 | 0.1 | 0.533 | 0.5 |
| 50 | 500 | 0.84 | 0.1 | 0.398 | 0.1 | 0.277 | 0.1 |
| 50 | 1000 | 0.77 | 0.1 | 0.475 | 0.1 | 0.216 | 0.4 |
| 50 | 2000 | 0.53 | 0.1 | 0.69 | 0.1 | 0.356 | 0.1 |
| 200 | 500 | 0.93 | 0.1 | 0.431 | 0.2 | 0.413 | 0.1 |
| 200 | 1000 | 1.0 | 0.1 | 0.444 | 0.2 | 0.323 | 1.1 |
| 200 | 2000 | 0.51 | 0.1 | 0.883 | 0.1 | 0.577 | 0.2 |
| Comparisons between slope stations | |||||||
| 500 | 1000 | 0.069 | 19.3 | −0.011 | 49 | 0.091 | 86 |
| 500 | 2000 | 0.42 | 0.1 | 0.057 | 14.9 | −0.021 | 62.8 |
| 1000 | 2000 | 0.22 | 0.4 | 0.06 | 19.1 | 0.093 | 10.9 |
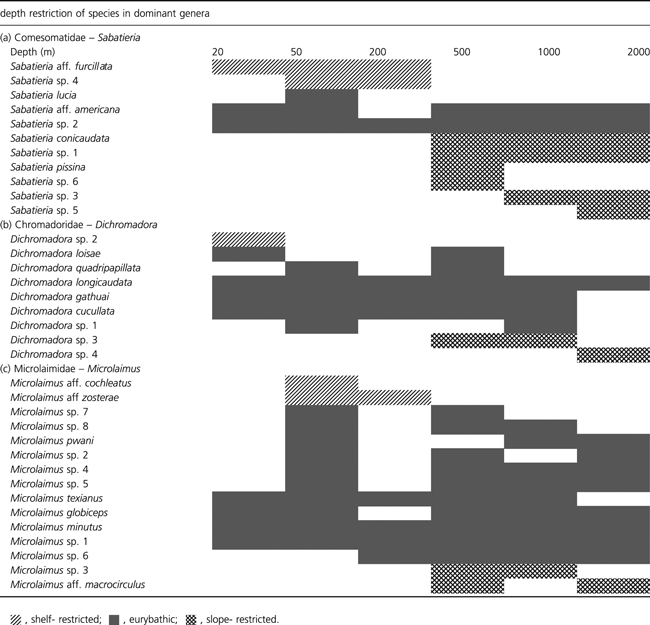
The genera Sabatieria (Comesomatidae), Dichromadora (Chromadoridae) and Microlaimus (Microlaimidae) were found at all depths, although in varying proportions. Comparisons of the species distribution for the three eurybathic genera revealed that while several species of these genera may be eurybathic, several other species were restricted either to the shelf or to the slope, and a small proportion occurred only at particular depths (Table 2). Two species in the genus Sabatieria were restricted to the shelf, six species to the slope and three had no restrictions (Table 2a). In the genus Dichromadora, only one species was restricted to the shelf and two to the slope, whereas the remaining six had no restrictions (Table 2b). In the genus Microlaimus, only two species were restricted to the shelf, two to the slope and the remaining 11 species had no restrictions (Table 2c). In the family Microlaimidae, a higher number of species (75%) had no bathymetric restrictions, compared to the other two families (Comesomatidae 39% and Chromadoridae 32%). Coincidentally, the Microlaimidae family, which had the highest proportion of eurybathic species, also had the lowest number of species.
SIMPER analysis revealed that all three families showed a relatively low similarity at species level within samples from the same depth (Table 3). However, the average similarity was slightly higher in the Comesomatidae (mean = 34%) compared to the Chromadoridae (mean = 23%) and Microlaimidae (mean = 26%). The dissimilarity between samples from different depths was more than 50% for the three families (62–97% in Comesomatidae, 79–98% in Chromadoridae and 68–90% in Microlaimidae) (Table 4). Dissimilarities between samples at different depths were quite high within the shelf (68–91%) and within the slope (62–82%) but the differences were even higher between shelf and slope depths (86–98%).
| depth (m) | % similarity between replicate samples (same depth) | ||
|---|---|---|---|
| Comesomatidae | Chromadoridae | Microlaimidae | |
| 20 | 35 | 26 | 30 |
| 50 | 28 | 17 | 22 |
| 200 | 35 | 32 | 29 |
| 500 | 47 | 17 | 23 |
| 1000 | 37 | 18 | 23 |
| 2000 | 22 | 28 | 30 |
| Mean | 34 | 23 | 26 |
| depth (m) | dissimilarity of samples between depths | ||||
|---|---|---|---|---|---|
| Comesomatidae | 20 | 50 | 200 | 500 | 1000 |
| 50 | 77 | ||||
| 200 | 91 | 79 | |||
| 500 | 95 | 92 | 86 | ||
| 1000 | 95 | 94 | 87 | 62 | |
| 2000 | 97 | 96 | 92 | 80 | 76 |
| Chromadoridae | |||||
| 50 | 86 | ||||
| 200 | 89 | 85 | |||
| 500 | 93 | 95 | 94 | ||
| 1000 | 96 | 97 | 93 | 83 | |
| 2000 | 98 | 98 | 97 | 81 | 79 |
| Microlaimidae | |||||
| 50 | 72 | ||||
| 200 | 68 | 77 | |||
| 500 | 87 | 85 | 90 | ||
| 1000 | 88 | 85 | 87 | 79 | |
| 2000 | 89 | 87 | 92 | 73 | 75 |
Comparison of nematode diversity between the shelf and the slope
To investigate the pattern in local diversity between shelf and slope, we calculated alpha (α) diversity as the average number of species per depth, and gamma (γ) as the count of all species present at each depth. Both α and γ were plotted against depth (Fig. 3). In the families Comesomatidae and Chromadoridae both α and γ were lower in the shelf stations compared to the slope stations. An ANOVA confirmed the significant differences (P < 0.05) in species richness (N0) between depths for both families (df = 5 and 57, Comesomatidae: F10,7 and Chromadoridae : F3,69) but not for the Microlaimidae (F1,10), although different patterns were found for both families based on a post hoc comparison. In all three families, γ diversity was in general at least three to four times higher than α, and the difference was more pronounced at the slope compared to the shelf. When species from the three families were combined, γ was still three to four times higher than α, and the pattern was more consistent along the slope than at the shelf, which showed a lower γ-value (Fig. 3d). The overall species turnover (γ/α) was higher in Chromadoridae (4.5) than in Microlaimidae (4.1) and Comesomatidae (3.8), which suggests a higher regional diversity of the former taxa compared to the latter two. This agrees with the generally lower similarity between station groups observed in Chromadoridae (mean: 23%) compared to Microlaimidae (mean: 26%) and Comesomatidae (mean: 34%) (Table 3). There is further a lower average species turnover at the shelf (2.8–4.5) compared to the slope (4.7–5.2) (Table 5).
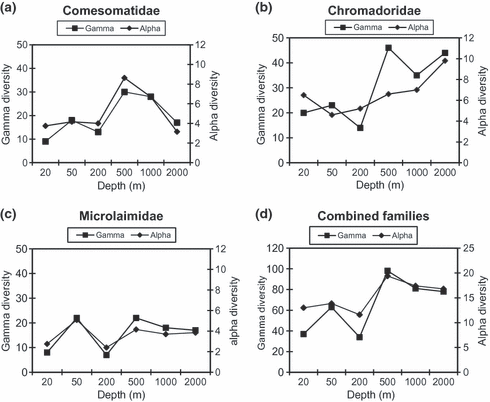
Number of species (alpha and gamma) per family in relation to depth: (a) Comesomatidae; (b) Chromadoridae; (c) Microlaimidae; (d) all three families combined.
| depth (m) | species turnover (γ/α) | |||
|---|---|---|---|---|
| Comesomatidae | Chromadoridae | Microlaimidae | mean | |
| 20 | 2.4 | 3.1 | 2.9 | 2.8 |
| 50 | 4.3 | 5.0 | 4.3 | 4.5 |
| 200 | 3.3 | 2.7 | 2.9 | 3.0 |
| 500 | 3.5 | 7.0 | 5.3 | 5.2 |
| 1000 | 4.2 | 5.0 | 4.9 | 4.7 |
| 2000 | 5.4 | 4.5 | 4.4 | 4.8 |
| Mean | 3.8 | 4.5 | 4.1 | 4.2 |
Species diversity (Hill’s N1) calculated as the average over all samples per depth was plotted against depth for each family separately (Fig. 4a–c) and for the three families combined (Fig. 4d). In general, most of the shelf stations recorded lower diversity than the slope stations in the three families, except at 50 m, where the Microlaimidae recorded the highest N1 value (4.2). Nematode species diversity varied with depth and revealed unique patterns within each family. In Comesomatidae, the highest diversity was observed at 500 m (N1 = 6.2) and decreased towards both the shelf (20, 50 and 200 m) and the deeper slope (2000 m) stations (Fig. 4a). In Chromadoridae, species diversity increased gradually from the shelf (20, 50, 200 m) towards the slope and recorded maximum diversity (N1 = 8) at 2000 m (Fig. 4b). An ANOVA and post hoc comparison confirmed the significant higher diversity at 500 and 2000 m, respectively, for the Comesomatidae (F3,41) and Chromadoridae (F4,109). On the other hand, Microlaimidae had a more or less similar diversity (N1 = 4) at all depths (F1,012, P > 0.05). When the three families were combined (Fig. 4d) the average diversity at the shelf (20, 50 and 200 m) stations remained low (N1 = 2.8–3.8), whereas the diversity at the slope stations remained high (N1 = 5.0) and did not vary with depth.
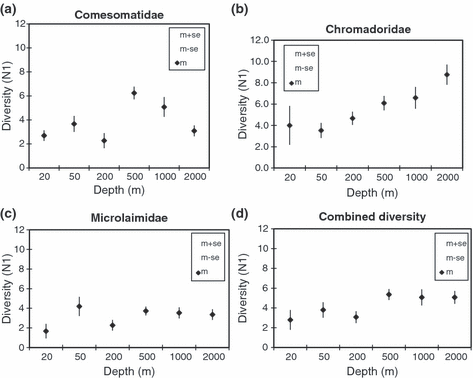
Species diversity (N1 ± SE) distribution with depth: (a) Comesomatidae; (b) Chromadoridae; (c) Microlaimidae; (d) all three families combined.
Species accumulation curves were constructed against the number of samples for each depth and each family (Fig. 5a–c). Figure 5d shows the species accumulation curves for all depths combined for each family and for all three families together. Species curves reached an asymptote at about six or seven samples at most depths. In general, the curves for the shelf stations were lower than for the slope stations, apart from the 50-m samples in the Microlaimidae. Over all depths (Fig. 5d), the Microlaimidae and Comesomatidae curves were approaching an asymptote, but the curve for Chromadoridae was far from it. The combination of all three families in one curve also did not reach an asymptote (Fig. 5d).
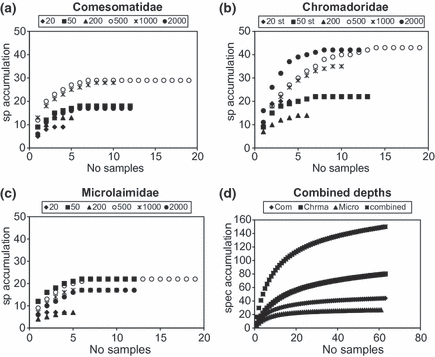
Species accumulation curve per depth (20, 50, 200, 500, 1000, 2000 m): (a) Comesomatidae; (b) Chromadoridae; (c) Microlaimidae; (d) all three families combined.
Depth-related patterns compared for different taxonomic levels
The total number of genera per depth (γ) accounted for only 1/3–1/2 of the total number of species at each depth for all three families (Fig. 6). However, the ratio (genera/species) varied between the shelf and the slope stations, as the number of genera did not increase to the same extent from shelf to slope as the number of species. The Microlaimidae (Fig. 6c) differed from the two other families in the sense that the change of number of genera and species with depth was very similar, apart from the 20 m station, which had relatively lower number of species (relative to number of genera). In the families Comesomatidae and Chromadoridae, there was no apparent change in the total number of genera with depth, whereas the number of species was relatively higher at the slope compared to the shelf. When the three families were combined, the number of genera was also comparable, whereas the number of species remained lower at the shelf compared to the slope (Fig. 6d). Figure 6 clearly demonstrates that bathymetric patterns differed between species and genera diversity within each of the families studied. Although the species diversity was higher at the slope stations compared to the shelf, the genus diversity displayed different patterns in the different families (Fig. 6).
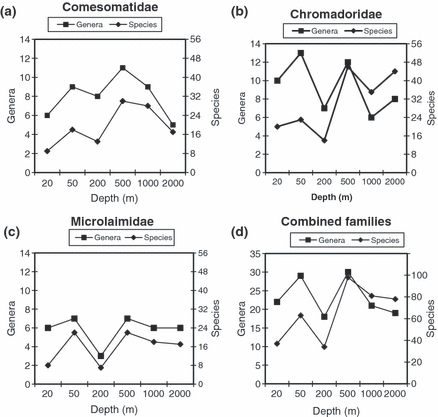
Pattern in gamma diversity (species and genus) with depth for the three families: (a) Comesomatidae; (b) Chromadoridae; (c) Microlaimidae; (d) all three families combined.
Association between diversity and numerical representation (number of individuals and relative abundance)
When the species richness (N0) per sample was plotted for each family against relative abundances (Fig. 7), a strong linear relation for Microlaimidae and Chromadoridae, and to a lesser extent for the Comesomatidae, was observed. Hill’s N1 did not show a strong linear regression with the relative abundances for the Comesomatidae (Fig. 7d), but there was a strong correlation for the Chromadoridae and Microlaimidae. The same patterns were found for plots against number of individuals (not shown here), as a higher number of individuals translated into a higher species diversity.
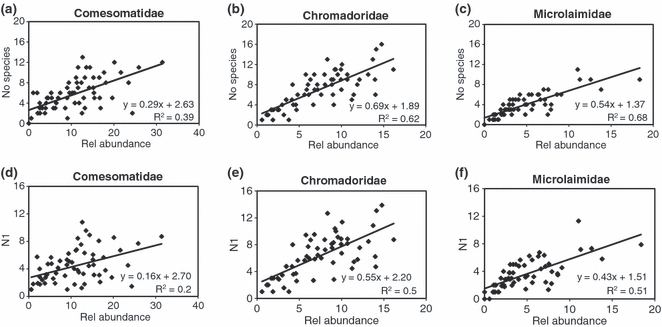
Species richness (S) for (a) Comesomatidae; (b) Chromadoridae; (c) Microlaimidae. Hill’s N1 diversity for (d) Comesomatidae; (e) Chromadoridae; (f) Microlaimidae, in relation to relative abundance.
Discussion
Community structure: differences between shelf and slope
Each of the families portrayed a unique pattern in terms of shifts in relative abundances from the shelf to the slope. The uniqueness of Comesomatidae was exemplified by the higher relative abundance of the family at the upper slope (500 and 1000 m) due to the high abundance of the genera Sabatieria and Cervonema. Sabatieria showed the highest abundances at 500 and 1000 m, although it was also prominent at 20 m. The upper slope was a zone of minimum oxygen along the depth profile (Muthumbi et al. 2004) and this might explain the high abundance of Sabatieria, which is known to tolerate low oxygen conditions (Modig & Ólafsson 1998; Steyaert et al. 1999; Franco et al. 2008; Soetaert & Heip 1995). In the Chromadoridae the typical deep-sea genus Acantholaimus (Soetaert & Heip 1995), which has been found to dominate slope stations in most areas around the world (Vanreusel et al. 2010), was responsible for the increase in relative abundance of the family in the stations beyond 200 m. The high relative abundance of this family in the shelf stations was due to several genera (Dichromadora, Actinonema, Ptycholaimellus and Hypodontolaimus).
The fact that many genera and species were restricted to either shelf or slope led to a clear separation in composition of both depth zones, especially in the Comesomatidae and the Chromadoridae. However, the reason why the shelf break between 200 and 500 m served as a clear barrier in the distribution of several genera or species remains unclear. It is unlikely that processes associated with low dissolved oxygen play a role, as there was already a distinctly sub-surface low level of dissolved oxygen in the water column observed at 200 m, which increased slightly at 500 m and then decreased gradually to a minimum (OMZ) at 1000 m (Duineveld et al. 1997). Rex & Etter (2010) in their review concluded that the most pronounced turnover occurs at the shelf–slope transition, and that there is a general lack of evidence to identify the exact causes.
On the other hand, several species do show a wide bathymetric distribution from the shelf to 2000 m depth. Across-shelf upper-slope distribution has been observed before for several nematode species, albeit in the Antarctic (Brandt et al. 2007b), where eurybathy seems more general and where the shelf extends up to 500 m or deeper. However, nothing is known about cryptic speciation in deep-sea nematodes and it is likely there is a strong population genetic structure, like that observed in other deep-sea organisms with wide bathymetric distribution such as the molluscs Nuculoma similis and Deminucula atacellana (Etter et al. 2005). Coincidentally, in the WIO region the family Microlaimidae, which portrayed the highest proportion of eurybathic species and genera, was also the least species-rich family, whereas the Comesomatidae and Chromadoridae, which had a higher proportion of depth-restricted species, contained a high number of species.
Bathymetric patterns in species diversity
Nematode species richness (alpha and gamma) displayed a unimodal response with depth in the Comesomatidae; both diversity measures increased with increasing water depth for the Chromadoridae and there was no change with depth for the Microlaimidae. The diversity trend in the Comesomatidae is similar to the pattern displayed by the nematode genus diversity from the same area (Muthumbi et al. 2004), where high diversity was observed at mid (500 m) depth and reduced towards the shallower or deeper stations. A unimodal response has also been observed in several deep-sea macro- and megafauna studies (Rex 1983; Gage et al. 2000; Rex & Etter 2010). In other areas worldwide, nematodes have been found to either increase or decrease in diversity with increasing water depth. Danovaro et al. (2008) observed a decrease in nematode diversity in the Mediterranean Sea from 1000 to 4000 m water depth. However, the Mediterranean is an oligotrophic sea where deeper areas show low nematode densities, and hence also a low nematode diversity. Along the North Carolina continental shelf and slope (50–2500 m) Tietjen (1976) also found a decrease in nematode diversity with increasing depth, which he attributed to a decrease in the micro-habitats in the clayey-silt sediments, compared to the sandy shelf sediments in the area. On the other hand, no obvious depth-related trend in diversity was observed by Renaud et al. (2006) for nematodes or macrofauna from the Arctic Sea, or by Soetaert et al. (1991) for nematodes from a West Mediterranean Bay (Calvi). It seems that patterns in deep-sea diversity vary from one group to the other and from one locality to the other. When a unimodal response has been observed, the peak of the curve occurs at different depths for different areas (Peterson & Lambshead 1995; Stuart & Rex 2009). This observation suggests that depth-related processes, structuring diversity are different in different areas (Peterson & Lambshead 1995) and they are more a reflection of local conditions than an expression of any fundamental response to depth (Gage et al. 2000). The observation that in a relatively small region such as in this study, the species diversity response to depth varies from one family to the other, also points to the potential importance of differences in adaptive properties of the different families, such as feeding, metabolism, dispersal capacity or body shape. However, little evidence on biological capacities of specific deep-sea nematodes is available yet.
In the WIO in general, both alpha and gamma diversity, and the species turnover (beta) were higher at the slope stations than at the shelf station. Two of the three families showed an increase in species diversity from the shelf to slope at alpha, beta and gamma level, although the peak in diversity differed between both families. While the number of species per station (alpha) increased from the shelf to the slope, the increase in the number of species per depth (gamma) was even more pronounced, indicating that different slope samples from the same depths showed a greater difference in terms of species composition compared to shelf stations. This could be seen by the lower average species turnover (γ/α ratio) at the shelf compared to the slope. A high dissimilarity within stations which reflected a high turnover of species between replicate samples was also observed for nematodes in the Arctic (Fonseca & Soltwedel 2009), and in the Mediterranean deep sea (Danovaro et al. 2008).
Species accumulation curves were earlier used to illustrate regional diversity patterns (Renaud et al. 2006) and to reveal heterogeneity between sub-samples (Ugland et al. 2005). Species accumulation curves for different depths showed here an asymptote after six or seven samples, which means that all species present in a station were sampled; however, none of the curves for the combined depths has reached an asymptote yet. This suggests that the area may have been under-sampled and that further sampling could yield even more species. This also confirmed the possibly higher regional diversity at the slope compared to the shelf. This is in contrast with some earlier studies that suggested a high local diversity but a low regional diversity in the deep sea compared to the shallower areas (Gray 1994; Lambshead & Boucher 2003). A comparative study on the macrofauna from the continental margin off Scotland also demonstrated a lower diversity in the shelf station compared to the slope stations (Gage et al. 2000), but for benthic Cnidaria the highest diversity was observed in the upper 100 m shelf area, while deep bathyal and abyssal depths were similar in species richness (Altuna 2007). Clearly, there is a variation in species diversity between slope and shelf and the trend varies from one group to the other, and for the taxonomic level considered.
Depth-related patterns for different taxonomic groups
In nematode studies, genera data are often used as a proxy for the present biodiversity. In general, genera data captures most of the macro-ecological patterns in the deep sea such as those related to habitat, depth and food input (Vanreusel et al. 2010). However, many deep-sea genera such as Acantholaimus, and also Halalaimus and Thalassomonhystera, are characterized by a high number of congeneric species. In the three selected families the high degree of congenerity along the slope was observed especially for the Chromadoridae (largely explained by the genus Acantholaimus, for which more than 20 different species were distinguished). Although genus diversity was not as high as the diversity at the species level, both taxonomic levels displayed to some extent similar diversity trends (Fig. 6). However, the increase in diversity beyond 200 m depth, as observed at species level for the Chromadoridae and Comesomatidae, was not prominent or was even absent at genus level. In this respect, genus diversity data remain a valuable proxy for community comparison, but do not provide true biodiversity estimates. Nonetheless, by application of the next generation sequencing techniques it is likely that even morphological species identification does not capture the present genetic diversity, and suffers from the same risks of underestimation. It has already been discussed how different taxonomic groups respond differently to bathymetric gradients. The high degree of eurybathy at genus and species level in the Microlaimidae seems to go hand in hand with the lack of depth-related patterns in diversity and relative abundances of this family. The Comesomatidae in their turn are most abundant and species rich at 500 m, conforming to a parabolic pattern, but also a clear shift in composition at the genus level is also apparent at this depth through the dominance of Sabatieria. The Chromadoridae also change in composition from 500 m onwards with the appearance of the species-rich genus Acantholaimus, which remains dominant and even increases in dominance with increasing water depth, in contrast to Sabatieria, which only peaked at 500–1000 m water depth. It is likely that this deviating depth-related response has to do with the different life strategies and adaptations within each of the families. Microlaimidae are usually associated with well oxygenated sandy sediments (Lee et al. 2001; Muthumbi et al. 2004) but may also be considered early colonizers (Lee et al. 2001) having small body size and a high turnover. However, the most abundant genus in the family, Microlaimus, is rather a generalist, being overall, present with little speciation pressure. Sabatieria is always prominent in oxygen-stressed conditions such as in the WIO margin, where oxygen minima are observed between 500 and 1000 m water depth (Muthumbi et al. 2004). The success of Acantholaimus is more difficult to understand. Its almost exclusive appearance beyond the shelf break, its almost unrivalled congeneric diversity and its increasing importance with increasing depth make it a typical deep-sea taxon benefiting in one way or another from the low food input (in quality and quantity) and the associated specific conditions.
Species diversity versus abundance
Lambshead & Boucher (2003) hypothesized that where declining abundance was due to declining productivity, species richness and ecological diversity should mirror the basic abundance pattern. If this is true, it would be expected that taxa with higher abundances will have more species. The margin along the Kenyan coast is generally oligotrophic, although there is slightly higher productivity in the northern than in the southern area due to upwelling (Kromkamp et al. 1995). Consequently, nematode densities were slightly higher in the shallow stations in the northern transect, Kiwayu (Muthumbi et al. 2004). Comparison of the number of species and relative abundance revealed a close coupling in such a way that when abundance was high, alpha diversity was also high. This means that the addition of new individuals within a taxon results in the addition of new genera/species. Taxa that are better represented in terms of relative numbers can be expected to be more diverse than those that are poorly represented. However, such comparisons may hold within taxa when comparing different sites but not when comparing different taxa. Although the Comesomatidae had the highest number of individuals and the highest relative abundance among the three families studied here, this family had only 44 species, compared to 80 species in the Chromadoridae. This correlation was not found in all environments and certainly not for all taxa. In the deep-sea Atacama trench, Shannon diversity and species richness decreased towards hadal depths, and the decline was more evident at genus than at species level, although in general the trench had a higher abundance compared to the slope (Gambi et al. 2003). In the Antarctic deep sea, gastropods showed no relationship between abundance and diversity (Schwabe et al. 2007). Other factors therefore seem to be involved in shaping the diversity patterns.
Conclusion
It is clear from this comparison that the observed shifts in community composition and diversity between shelf and slope are not equally expressed for different taxonomic groups and different taxonomic levels. Why exactly the shelf break provides a barrier in distribution for many nematode taxa (both genera and species) remains unclear, and knowing that a significant proportion of the present species still remains eurybathic. However, for the latter population, genetic analysis across shelf breaks within the same geographical regions should provide insight into the true connectivity between shelf and slope sediments for permanent benthic taxa such as nematodes.
In general the species diversity, both alpha and gamma, and also the species turnover (β), was higher at slope than at shelf stations. The species accumulation curves did not reach an asymptote for most of the families, suggesting an under-sampling of the area. Genus diversity was much lower than the diversity at species level and this difference was much more prominent at the slope than at the shelf. The above evidence indicates that genus diversity estimates are not a proxy for species diversity.
There also seems to be a relationship between the species diversity and the occurrence of a taxon, but how consistent this relationship is (which diversity indices and at what taxonomic levels) needs to be investigated further for different taxa and oceanic regions.


