Spatial pattern of coastal fish assemblages in different habitats in North-western Mediterranean
Abstract
Variability of fish assemblages across habitat structures can depend on spatial scales. A hierarchical sampling design was used to assess the spatial variability of temperate fish assemblages in different habitats and at multiple scales. Underwater visual censuses were carried out along the coasts of Elba Island (NW Mediterranean) on Posidonia oceanica beds, rocky algal reefs and sandy habitat at three spatial scales, namely tens of metres (individual replicates), hundreds of metres (sites) and tens of kilometres (locations). At the assemblage level, there was a clear relationship between fish and habitat type and the observed habitat-related differences were largely dependent on species identity. Fish assemblages on P. oceanica beds and rocky reefs shared a high number of species, whereas overlap with sandy assemblages was negligible. Multivariate analyses revealed significant differences in fish assemblages among habitats, although there was also a significant habitat × site interaction. These differences relied mainly upon assemblage composition and species richness. Assemblages on rocky reefs and P. oceanica meadows usually harboured a higher number of species and individuals compared with sandy assemblages. Nevertheless, the patterns of habitat-related differences in species richness and, especially, in the total number of fish, changed significantly from site to site. Eight species showed significant differences over habitats, but they were not consistent due to the interaction of habitat with site. Predictability of fish at both assemblage and population levels decreased with the scale of observation, and the spatial pattern of fish observed at the smallest scale was likely dependent on factors other than habitat type.
Problem
The study of the distribution patterns of organisms relative to the habitats available to them is of central importance in ecology (Bell et al. 1990). Each species perceives the environment on a unique range of scales and thus responds to variability individually (Levin 1992). Indeed, the majority of species show a patchy distribution on a range of spatial scales as a result of different evolutionary processes operating at those different scales (Levin 1992).
An important issue in the study of the relationships between species and their environment is how the observational scale may affect the inferred pattern (e.g.Andrew & Mapstone 1987; Wiens 1989; Chesson 1998; Sale 1998). Patterns observed at a specific scale may originate from a number of ecological factors, including arrangements and composition of habitats, resource availability, predation and competition (Wiens 1989; Jones 1991). The potential interaction of such a large number of factors suggests investigating relationships (e.g. fish-habitat associations) of interest on a hierarchy of scales. This approach would make it possible to identify the relevant scales of natural variability, and to propose and test explanatory models for the observed patterns (Underwood & Chapman 1996; Hewitt et al. 2007).
The analysis of patterns at multiple, simultaneous scales can contribute to establishing the extent to which small-scale processes can be generalised (Underwood & Petraitis 1993) and whether local processes may be scaled up to produce patterns on wider scales (Wootton 2001). Nevertheless, Terlizzi et al. (2007) suggested caution in generalising results obtained in small-scale experiments to broader spatial extents, stressing the need to adopt multi-scale approaches in spatial pattern analyses.
Several studies have documented a high degree of spatial and temporal variation in the structure of fish assemblages on seagrass beds (Francour 1997; Jackson et al. 2001; Moranta et al. 2006), rocky reefs (García-Charton & Pérez-Ruzafa 2001; García-Charton et al. 2004) and sandy habitats (Gray et al. 1996; Guidetti 2000). The broad-scale distribution pattern of fish could be influenced primarily by oceanographic factors, such as seawater circulation and currents, which can greatly influence larval dispersal distance. At small spatial scales (from kilometres to metres), the composition and structure of fish assemblages are mostly linked to their relationships with habitat types, both in coral reefs (Roberts & Ormond 1987; Holbrook et al. 2000; McClanahan & Arthur 2001) and in temperate rocky reef systems (Guidetti 2000; García-Charton & Pérez-Ruzafa 2001; Letourneur et al. 2003).
The effects of habitat, which is inherently a spatial entity involving patchiness and heterogeneity, cannot be evaluated without an understanding of variability at different spatial scales (Kotliar & Wiens 1990; Underwood & Chapman 1996; Underwood et al. 2000). Indeed, identification of the most relevant scale of spatial variation in reef fish is a preliminary step for formulating hypotheses on the role of the factors involved (Jones 1988).
In the Mediterranean Sea, several investigations have been performed on fish assemblages associated with infralittoral habitats such as rocky reefs (Harmelin 1987; La Mesa & Vacchi 1999; Letourneur et al. 2003), Posidonia oceanica (L.) Delile seagrass beds (Bell & Harmelin-Vivien 1982; Harmelin-Vivien & Francour 1992; Francour 1997) and unvegetated sandy substrates (Macpherson 1994). Very few researchers have compared fish assemblages in different inshore habitats (Francour 1994; Guidetti 2000; Tunesi et al. 2006).
Our aim was to conduct a mensurative, observational study (sensuHurlbert 1984) to assess spatial patterns in fish assemblages inhabiting three shallow inshore habitats in the North-western Mediterranean, namely P. oceanica meadows, rocky algal reefs and sandy habitat. More specifically, we wished to quantify the degree of spatial variability in the structure of fish assemblage (species composition and relative abundances) at different spatial scales using a hierarchical sampling design. Fish sampling was performed over spatial scales spanning three orders of magnitude, namely tens of metres (replicates), hundreds of metres (sites) and tens of kilometres (locations). Univariate and multivariate analyses were thus used (i) to explore the relationship between fish assemblage structure and habitat type, (ii) to test the hypothesis that there are significant differences in fish assemblages among the investigated habitats and that these differences are dependent on spatial scale, and (iii) to identify the scales mostly contributing to the observed spatial variability.
Material and Methods
Study area
The study area is located along the coasts of Elba, the largest island of the Tuscany Archipelago (Italy, NW Mediterranean). The island has a highly indented coastline. The northern coast is characterized by wide stretches of sand, interspersed with smaller rocky areas. On the eastern side, from north to south, gently sloping sandy shores are replaced by very steep rocky cliffs. On the southern side, deep inlets covered predominantly by sand alternate with rocky promontories, where the sea bottom slopes sharply. Moving westward, the coastline is more uniform, and narrow rocky reefs are interspersed with large sandy areas. Posidonia oceanica meadows are widespread along the island coasts, both on soft and hard bottoms, from 5 m (often close to the coastline) down to 40 m depth.
Sampling procedure
Spatial and habitat-related patterns of fishes were examined in three habitats, i.e. rocky algal reefs, Posidonia oceanica meadows and unvegetated sandy bottoms, by means of a hierarchical sampling design focused on three spatial scales. Five locations (Capo Calvo, Lacona, Fetovaia, Capo D’Enfola and Capo Castello), separated by at least 20 km of coastline, were selected for sampling (Fig. 1). At each location, two randomly located sites (separated by hundreds of metres) were sampled. At each site, 10 replicated sampling units (tens of metres apart) were haphazardly sampled per habitat in a depth range of 4–16 m.
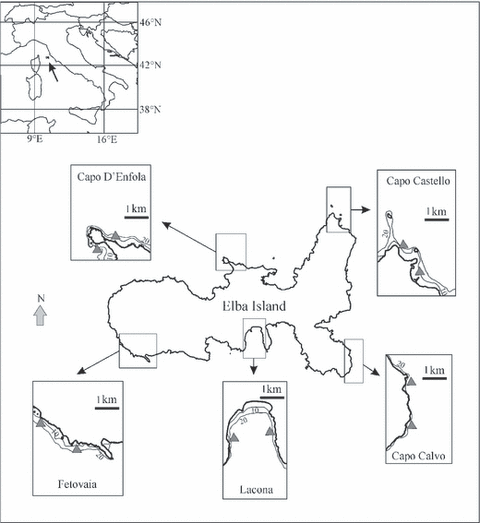
Location of the study area (Elba Island) in the North-western Mediterranean and position of the five sampling locations. Grey triangles indicate sampling sites.
Fish counts were carried out during May 2006 by visual censuses which are, to date, the most commonly used technique for studying littoral fish communities, due to their minimal environmental impact (Harmelin-Vivien et al. 1985).
Visual censuses were carried out between 10:00 h and 16:00 h and with good sea-weather conditions. Qualitative and quantitative data on fish assemblages were collected by means of the ‘stationary points’ method (Bohnsack & Bannerot 1986), which was preferred to the ‘transect’ method as only small patches of homogeneous habitats were present at some sites. At each stationary point, a circle 10 m in diameter (78.5 m2 total surface area) was surveyed. Before beginning the fish census, a 5-m rope was laid out on the bottom as an aid in estimating the circle boundary. Each sample began by counting fish in the water column and was completed by searching cryptobenthic and highly sedentary species on the sea floor. The sampling time (usually 5–10 min) was chosen to be able to adequately scan the sampling area in a complex habitat and to reduce bias resulting from some species being attracted to or escaping from divers. Abundance of fishes was estimated by counting single specimens to a maximum of 10 individuals, and schools larger than 10 individuals were assigned to six abundance classes (11–30, 31–50, 51–100, 101–200, 201–500, >500 individuals). The midpoint of each abundance class gave estimates of fish density (Harmelin-Vivien et al. 1985; Francour 1997).
Statistical analyses
To evaluate the potential relationship between multivariate variation in density of fish assemblages and the investigated habitats, we made a constrained ordination (with habitat as constrained factor) using a canonical analysis of principal coordinates (CAP; Anderson & Robinson 2003; Anderson & Willis 2003). Canonical correlations were tested using 4999 random permutations of the raw data. To reduce differences in scale among the original variables, data were transformed to x’ = ln(x + 1). Distinctness of groups was investigated using leave-one-out allocation success (Anderson & Robinson 2003). Product-moment correlations of the 59 species variables (the total number of species recorded) with the canonical discriminant axes were calculated and only those with an absolute correlation of >0.20 were considered meaningful and were included in the biplot.
Spatial patterns of fishes were investigated using a nested sampling design with three factors [Location (five levels, random), Site (two levels, random, nested in Location) and Habitat (three levels, fixed, crossed with the other factors)], and 10 replicate observation units per combination of factors. The complete dataset included 59 species variables and 300 observation units. The response of the multivariate fish assemblages to the 3-factor experimental design was examined using multivariate analysis of variance based on permutations (PERMANOVA) (Anderson 2001a; McArdle & Anderson 2001). Multivariate analysis was carried out with a full model, using 4999 random permutations of appropriate units (Anderson 2001b). Bray–Curtis dissimilarities were calculated on ln(x + 1)-transformed data to reduce weighting given to abundant species. Multivariate pseudo-variance components, which can be considered analogues of the univariate ANOVA estimators (Searle et al. 1992), were calculated for each term in the model. Multivariate pseudo-variance components were expressed as actual variance but also as percentages to determine their relative contribution to the observed patterns of distribution. To obtain information on how different elements of assemblages (i.e. abundant versus uncommon species) could influence the estimated pseudo-variance components, these estimates were also calculated on presence/absence data. Each term found to be significant in the analysis was investigated with appropriate pairwise comparisons, using 4999 random permutations to obtain P-values.
Three-way nested analysis of variance (ANOVA) was applied to assess spatial patterns for the single species, the total species richness and the total number of fish. Only those species with frequency of occurrence >10% were taken into account. Variance components were estimated for each random source of variation in ANOVAs. Negative estimates of variance were set to zero and all the remaining values were recalculated according to the procedure described by Fletcher & Underwood (2002). Prior to running analyses, homogeneity of variances was tested by Cochran’s test; whenever necessary, data were transformed and newly tested. When transformation did not produce homogeneous variances, a setting of α = 0.01 was used to compensate for the increased likelihood of type 1 error (Underwood 1981). Post-hoc multiple comparisons were made using the Student–Newman–Keuls’ (SNK) test.
Multivariate analyses were performed using the PRIMER computer programme (version 6, Plymouth Marine Laboratory, UK). ANOVA tests were computed by GMAV5 software (University of Sydney, Australia).
Results
General description of fish assemblages
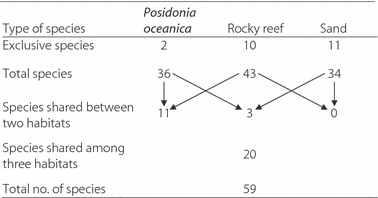
Overall, 59 fish species belonging to 24 families were recorded. Fish assemblages were dominated by Labridae and Sparidae (13 and 11 species, respectively), and the remaining families were each represented by four or fewer species. The total species richness increased from sandy habitat to Posidonia oceanica beds and rocky reefs (Table 1). Sandy substrate hosted conversely the highest number of exclusive species, followed by rocky reefs and P. oceanica meadows. Fish assemblages on seagrass beds and rocky habitat shared a considerable number of species, whereas their overlap with the sandy assemblages was very low.
Multivariate analyses
Fish assemblages differed significantly among habitat types, with squared canonical correlations δ21 = 0.92 (axis 1) and δ22 = 0.78 (axis 2) (P < 0.001). Along the first canonical axis there was an evident separation of fish assemblages on rocky reefs and those on Posidonia oceanica beds, whereas the second axis separated the assemblages on sandy bottoms from the other habitat types (Fig. 2A). Results of the leave-one-out allocation success (percentage of points correctly allocated to each group: P. oceanica = 100%; rocky reef = 100%; sand = 80%) indicated that assemblages inhabiting rocky habitat and P. oceanica beds were less variable and easier to predict than those associated with sandy substrate.
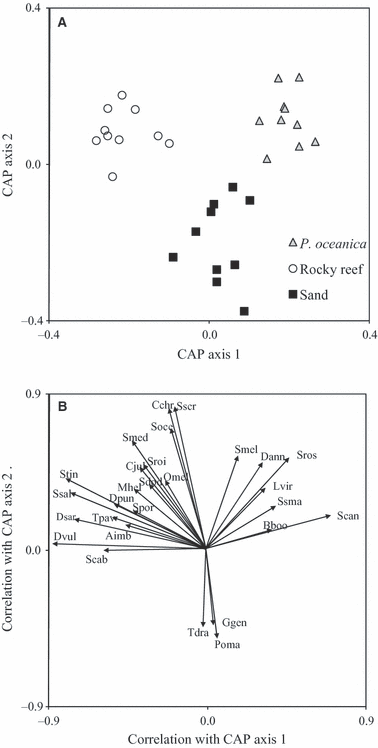
Canonical analysis of principal coordinates (CAP) plot based on the Bray–Curtis dissimilarities on ln(x + 1)-transformed data comparing fish assemblages composition and structure among habitats. The canonical axes that best discriminate assemblages at the three habitats and correlation coefficients of species variables with these axes are given in panels (A) and (B), respectively. Aimb, Apogon imberbis; Bboo, Boops boops; Cchr, Chromis chromis; Cjul, Coris julis; Dann, Diplodus annularis; Dpun, Diplodus puntazzo; Dsar, Diplodus sargus; Dvul, Diplodus vulgaris; Ggen, Gobius geniporus; Lvir, Labrus viridis; Mhel, Muraena helena; Omel, Oblada melanura; Poma, Pomatoschistus sp.; Ssal, Sarpa salpa; Spor, Scorpaena porcus; Scab, Serranus cabrilla; Sscr, Serranus scriba; Ssma, Spicara smaris; Scan, Spondyliosoma cantharus; Sdod, Symphodus doderleini; Smel, Symphodus melanocercus; Smed, Symphodus mediterraneus; Soce, Symphodus ocellatus; Sroi, Symphodus roissali; Sros, Symphodus rostratus; Stin, Symphodus tinca; Tpav, Thalassoma pavo; Tdra, Trachinus draco.
The habitat-related differences observed in the structure of assemblages relied upon a variety of fish. Species having positive correlations with both canonical axes (i.e. arrows pointing to the upper right of the CAP plot, Fig. 2B), such as Symphodus melanocercus, Diplodus annularis, Labrus viridis, Spicara smaris, Symphodus rostratus and Spondyliosoma cantharus, were usually associated with P. oceanica meadows. Conversely, a suite of species plotted in the upper left of the plot (e.g. Symphodus tinca, Symphodus mediterraneus, Symphodus roissali, Symphodus ocellatus, Diplodus puntazzo, Diplodus sargus, Coris julis, Muraena helena and Sarpa salpa), suggesting a preference for rocky reef habitats. Finally, assemblages on sandy habitats were characterized by few species (namely Trachinus draco, Gobius geniporus and Pomatoschistus sp.), exhibiting a negative correlation with the second axis (i.e. arrows pointing to the lower side of the plot, Fig. 2B).
Results from PERMANOVA indicated that there were significant differences in fish assemblages among the investigated habitats, although the pattern of differences varied from site to site (Table 2). No significant variability was observed at the scale of location. At each site, all the pairwise comparisons between habitats were significant, although at different levels of significance. The greatest multivariate variability occurred at the smallest investigated scale (i.e. at the level of individual stationary points or residual). The next greatest contribution was accounted for by the interaction between habitat and site, followed by the factor site. Results from PERMANOVA on presence/absence data were substantially similar to those obtained by analysing abundance data (Table 2).
| source | df | MS | F | estimate of variance component |
|---|---|---|---|---|
| (a) | ||||
| habitat = H | 2 | 69721.0 | 11.27*** | 635.34 |
| location = L | 4 | 6901.8 | 1.18ns | 17.21 (0.6) |
| site (L) = S(L) | 5 | 5869.1 | 2.61*** | 120.59 (4.4) |
| L × H | 8 | 6187.1 | 1.24ns | 60.94 (2.3) |
| S(L) × H | 10 | 4968.2 | 2.21*** | 271.69 (10.0) |
| residual | 270 | 2251.3 | 2251.33 (82.7) | |
| total | 299 | |||
| (b) | ||||
| habitat = H | 2 | 70664.0 | 12.23*** | 648.86 |
| location = L | 4 | 6832.9 | 1.56ns | 40.99 (1.6) |
| site (L) = S(L) | 5 | 4373.1 | 2.06*** | 75.07 (3.0) |
| L × H | 8 | 5777.8 | 1.30ns | 66.94 (2.6) |
| S(L) × H | 10 | 4439.0 | 2.09*** | 231.78 (9.1) |
| residual | 270 | 2121.1 | 2121.15 (83.7) | |
| total | 299 | |||
- P values were obtained using 4999 random permutations of appropriate units. Estimates of multivariate pseudo-variance components (Ev) (the respective percentage contributions are placed in parentheses) are given for each term in the model. ***P < 0.001; ns = not significant.
Univariate analyses
Total number of fish was significantly affected by habitat, although the pattern of differences varied from site to site (Table 3). Total number of fish was usually higher in rocky reefs and Posidonia oceanica beds than in sandy habitat, although these differences were not always significant (Fig. 3). Species richness showed significant variation across habitats, but there was also a significant interaction between habitat and site (Table 3). Assemblages on rocky reefs and sandy habitat almost always had the highest and lowest species richness, respectively (Fig. 3). Species richness was always higher in rocky reefs than in sandy habitat, whereas significant differences between P. oceanica and sandy habitat and between P. oceanica and rocky reefs were recorded at nine and five sites, respectively. The greatest component of variation was that among individual stationary points (i.e. the residual variability), followed by that contributed by the interaction of site with habitat (Table 3).
| source | habitat (H) | location (L) | site (L) = S(L) | H × L | S(L) × H | residual | transformation | ||||
|---|---|---|---|---|---|---|---|---|---|---|---|
| df | 2 | 4 | 5 | 8 | 10 | 270 | |||||
| F | F | Ev | F | Ev | F | Ev | F | Ev | Ev | ||
| total species richness | 55.42*** | 3.80ns | 2.8 | 0.77ns | 0.0a | 1.30ns | 2.6 | 1.98* | 8.5 | 86.1 | None |
| total no. of fish | 10.93** | 3.73ns | 2.9 | 0.87ns | 0.0a | 0.51ns | 0.0a | 4.29*** | 18.6 | 78.5 | Noneb |
| Chromis chromis | 6.02c | 2.46ns | 2.5 | 1.39ns | 1.0 | 0.75ns | 0.0a | 4.22*** | 20.8 | 75.7 | Noneb |
| Coris julis | 9.61** | 1.33ns | 1.9 | 4.61*** | 8.8 | 1.72ns | 6.3 | 2.41** | 10.3 | 72.8 | ln(x + 1) |
| Diplodus annularis | 12.23** | 2.10ns | 1.5 | 0.95ns | 0.0a | 0.50ns | 0.0a | 2.20* | 6.6 | 91.9 | ln(x + 1) |
| Diplodus sargus | 17.75** | 0.14ns | 0.0a | 4.12** | 4.6 | 0.39ns | 0.0a | 2.38c | 6.5 | 88.9 | Noneb |
| Diplodus vulgaris | 35.34*** | 0.63ns | 0.0a | 4.24** | 7.4 | 1.46ns | 2.6 | 1.29ns | 2.6 | 87.4 | ln(x + 1) |
| Spondyliosoma cantharus | 22.56*** | 3.48ns | 3.5 | 0.97ns | 0.0a | 0.43ns | 0.0a | 2.58** | 8.1 | 88.4 | Noneb |
| Symphodus ocellatus | 6.97c | 3.99ns | 4.4 | 1.19ns | 0.5 | 0.28ns | 0.0a | 5.52*** | 20.6 | 74.5 | Noneb |
| Symphodus rostratus | 9.95** | 3.76ns | 3.9 | 0.95ns | 0.0a | 2.84ns | 6.2 | 0.83ns | 0.0a | 89.9 | Noneb |
| Symphodus tinca | 37.27*** | 3.88ns | 3.1 | 0.77ns | 0.0a | 3.58* | 5.3 | 0.59ns | 0.0a | 91.6 | ln(x + 1) |
- Ev, estimates of variance component (as percentage contributions); ns, not significant.
- aNegative values were set to zero according to Fletcher & Underwood (2002).
- bNo transformation produced homogeneous variances.
- cP < 0.05 but not significant because it is higher than the setting value of α = 0.01.
- *P < 0.05; **P < 0.01; ***P < 0.001.
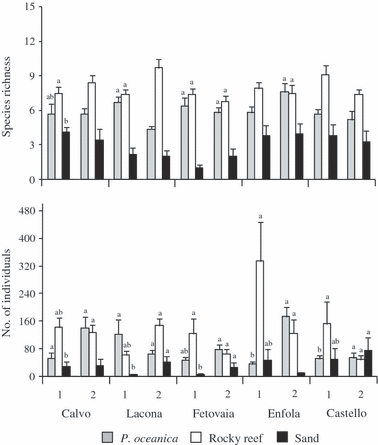
Means (+SE) of the total species richness and the total number of individuals at each habitat, location and site (n = 10 replicates per site). 1 = site 1; 2 = site 2. Results from SNK test about the interaction of habitat with sites are indicated by letters above each bar. Within each site, habitats which differ significantly (P < 0.05) do not share a letter.
Abundance patterns of 16 species were analysed by ANOVA. Seven species (i.e. Boops boops, Sarpa salpa, Serranus cabrilla, Serranus scriba, Spicara smaris, Symphodus mediterraneus and Symphodus melanocercus) showed no significant differences across main and interaction factors. Eight species were not homogeneously distributed over the investigated habitats, as demonstrated by the significant differences detected with ANOVA (Table 3 and Fig. 4). The pattern of differences across habitats of Coris julis, Diplodus annularis, Chromis chromis, Symphodus ocellatus and Symphodus cantharus was not consistent, due to the significant interaction with site. A significant small scale (between sites, within location) variability was observed in some species, such as C. julis, Diplodus sargus, Diplodus vulgaris and S. cantharus. Conversely, no one species showed significant variability at the scale of location. The main contribution to the total variation was always accounted for by residual variability (among stationary points). The second greatest component of variation was contributed in the majority of species by the interaction of sites or location with habitat (Table 3).
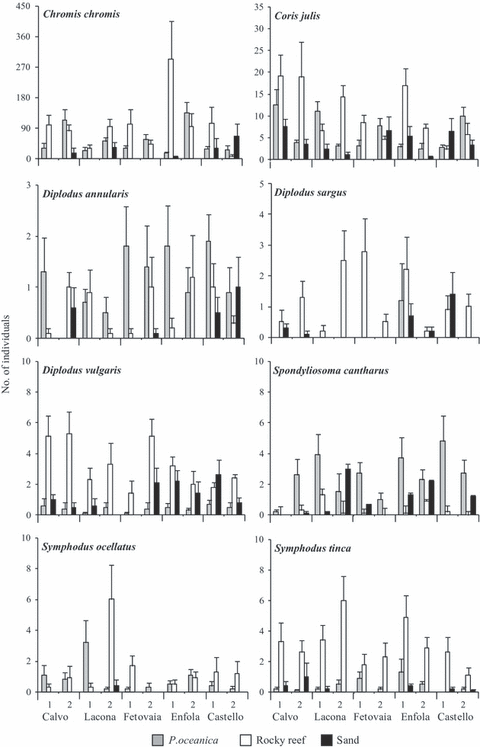
Means (+SE) of the number of individuals for the most common species at each habitat, location and site (n = 10 replicates per site). 1 = site 1; 2 = site 2. Eight of 16 species compared by ANOVA are not included as they did not differ significantly for any factors investigated.
Discussion
Results from multivariate analyses identified significant differences in composition and structure of fish assemblages among Posidonia oceanica meadows, rocky reefs and sandy habitat, such that some species were more often (or exclusively) recorded over a specific habitat. Most of the species–habitat associations reported below have been well documented in other Mediterranean areas. For instance, some labrids (Symphodus melanocercus, Symphodus rostratus and Labrus viridis) and sparids (Diplodus annularis and Spondyliosoma cantharus) are typical inhabitants of seagrass beds (e.g.Francour 1997; Tunesi et al. 1997; Guidetti 2000), whereas others (Coris julis, Symphodus tinca, Diplodus sargus and Diplodus vulgaris) are generalist species, dwelling preferentially on rocky algal reefs but also on Posidonia oceanica and sandy habitat (Guidetti 2000; Tunesi et al. 2006). Sandy fish assemblages were mainly characterized by Gobius geniporus, Trachinus draco and Pomatoschistus sp., which accounted for 82% of fish sampled exclusively in this habitat. Indeed, these latter species are considered sand specialists, specifically adapted to living in or above sediment (Miller 1986; Tortonese 1986).
The preference of several fish species for vegetated habitats (seagrasses and rocky algal reefs) is likely driven by specific food and shelter requirements (Rozas & Odum 1988). Fish assemblages on P. oceanica beds and rocky reefs showed a large overlap in species composition, whereas they were quite different from the fish fauna recorded on sandy bottoms, as documented by other authors (Jenkins & Wheatley 1998; Guidetti 2000). In the present study, the highest and lowest numbers of exclusive species were observed on sandy substrate and P. oceanica meadows, respectively, whereas Guidetti (2000) recorded more exclusive species on P. oceanica than on sandy and rocky habitats.
It is worth noting that the habitat-related differences in fish assemblages presented above are derived from data collected during daytime censuses. A different pattern of differences might originate from data collected at night, as previously demonstrated by other authors on P. oceanica meadows (Bell & Harmelin-Vivien 1982) and rocky reefs (Azzurro et al. 2007).
Overall, each of the investigated habitats seems to be important for a suite of littoral fish species. Our results and those from the literature (Jenkins & Wheatley 1998; Guidetti 2000) stress the importance of both vegetated and unvegetated habitats in sustaining the biodiversity of coastal fish assemblages and highlight the need for their careful management.
Working at multiple scales is highly recommended to understand spatial patterns of fish of different species, which perceive and respond to their environment in very different ways. The first explicit measurements of the effects of habitat on fish species at different spatial scales were made in coral reef environment (e.g.Doherty 1987; Fowler et al. 1992; Tolimieri 1998). More recent studies have analysed spatial variability of fishes across multiple scales using structured hierarchical designs, both in tropical (Gust et al. 2001; Chittaro 2004; Núñez-Lara et al. 2005) and in temperate areas (Curley et al. 2002; Anderson & Millar 2004; García-Charton et al. 2004; Micheli et al. 2005; Moranta et al. 2006). Some investigations indicated that spatial variability of the entire assemblage was either largely independent of the spatial scale examined (Anderson & Millar 2004; Chittaro 2004) or occurred only at some of the investigated scales (Moranta et al. 2006). Other studies on temperate reef fish assemblages reported significant differences over almost the entire range of scales (see reviews by Jones 1988 and Kingsford 1998). In the present work, the greatest variability in composition and structure of fish assemblages was observed at the smallest investigated spatial scale, which was among individual stationary points. Significant differences were detected among sites (hundreds of metres apart), whilst no significant variation was observed at the largest scale (i.e. among locations). It is not an easy task to draw up generalisations about fish spatial pattern by analysis of present and literature data, due to differences in the investigated spatial scales, habitats, assemblage composition and data analyses. Nevertheless, a very low predictability for fish assemblage structure at the level of individual replicates can be considered one of the few common patterns between freshwater (Gray et al. 2009) and marine environments (Curley et al. 2002; Anderson & Millar 2004). Single sampling units of tens of square metres, such as transects or stationary points, may be not large enough to cover the wide array of mobility characterising coastal fish species.
Multivariate analysis of abundance data does not allow us to distinguish among the contribution of assemblage composition, species richness and species density in shaping the patterns of variability across habitats and at different spatial scales. This issue was partially addressed by applying PERMANOVA on a presence/absence dataset and a nested ANOVA on species richness. Analyses of the two types of multivariate datasets gave the same patterns of variability, suggesting that fish assemblages differed among habitats and from site to site mostly in relation to species richness and assemblage composition.
The important role of species richness in distinguishing among assemblages of different habitats was also confirmed by the outcome of the univariate analysis. Species richness on rocky reefs was usually higher than that on P. oceanica meadows, which in turn was higher than that on sandy habitat. Similarly, the number of individuals recorded on rocky reefs and P. oceanica meadows was usually higher compared to sandy habitat.
It is not surprising that structurally complex habitats such as P. oceanica beds and rocky reefs, which harbour a wide range of shelter and food opportunities, may sustain a higher number of species and individuals compared to flat and unvegetated sandy seashores. A large body of the literature indicates that both species richness and density of fishes are positively affected by habitat complexity (Macpherson 1994; Guidetti 2000; García-Charton & Pérez-Ruzafa 2001).
Patterns of habitat-related differences in species richness and, especially, in the total number of fish, were more predictable at larger scales, that is, among locations separated by tens of kilometres, whereas they changed significantly from site to site. The variability among sites (separated by hundreds of metres) in fish total density detected at Elba Island was in the lower range of those (from a few metres to hundreds of kilometres) reported elsewhere (Gust et al. 2001; Anderson & Millar 2004; Chittaro 2004; Moranta et al. 2006).
Patterns of variation of the whole assemblages arose from the patchy distribution observed at the level of single species. Many other studies describing fish assemblages in tropical and temperate areas (Holbrook et al. 2000; Gust et al. 2001; García-Charton et al. 2004) highlighted the influence of habitat in determining patchiness at small to medium spatial scales. In the present investigation, the significant small scale (between sites) variability in density exhibited by some species was likely in relation to factors other than habitat. Both competitive and predator–prey interactions have been proven to be causal mechanisms behind the spatial variability of coral reef fish at a comparable scale, namely from tens to hundreds of metres (Carr & Hixon 1995; Steele et al. 1998). A number of life history traits, such as mobility, demersal or pelagic aptitude and schooling behaviour, may be involved in determining the spatial pattern of single fish species (García-Charton et al. 2000 and references therein). In fact, the way each fish species perceives and responds to the environmental variability may be influenced by its mobility and position in the water column. The spatial scale at which strictly benthic and sedentary fish perceive differences in some habitat features should be smaller in comparison with pelagic and highly mobile species. Unfortunately, the present data do not allow us to ascertain which process was responsible for the spatial variability observed at the level of assemblage and of single species. More functional and/or process-oriented studies need to be undertaken to address this question exhaustively. What can be inferred from the present data is that species with similar characteristics of mobility and position in the water column (e.g. nektonic fish such as sparids or nektobenthic fish such as Symphodus spp.) may exhibit very different patterns of spatial variability.
In conclusion, our results indicate that a considerable amount of variability in composition and structure of fish assemblages is driven by habitat. Predictability of assemblage composition and structure decreases with the scale of observation and, at the smallest scale, factors other than habitat type are likely responsible for shaping fish density patterns. To date, a lot of evidence suggests that the greatest amount of spatial variability in fish assemblages seems to occur among individual replicate units. Such a pervasive nature of small-scale spatial variation would have important implications for planning cost-effective experimental and sampling designs. Future investigation on fish distribution patterns along the coasts of Elba Island would benefit from increasing the number of replicates at the level of site but decreasing replication at larger spatial scale (i.e. location).


