Changes in biomass structure and trophic status of the plankton communities in a highly dynamic ecosystem (Gulf of Venice, Northern Adriatic Sea)
Abstract
The changes in the plankton biomass structure in relation to nutrient inputs were studied in the Gulf of Venice (Northern Adriatic Sea), an area characterized by a very marked trophic state variability. The investigation was carried out at two stations, in March, May and July 2005 and 2006, considering the whole water column. The size structure (from picoplankton to mesozooplankton) of both autotrophs and heterotrophs was analysed. Signals of diluted waters and nutrient inputs were more marked in 2005 than in 2006. In 2005, the total plankton biomass was almost double (87 ± 37 μg·C·l−1) that in 2006 (44 ± 26 μg·C·l−1). The variations were determined mainly by phytoplankton, with a 70% decrease, and a shift from a community dominated by microphytoplankton (49 ± 12%) in 2005 to one dominated by bacteria (43 ± 11%) in 2006 was observed. The relationship between the heterotrophic (H) and autotrophic (A) biomass indicated a rapid decline of the H/A ratio with increasing phytoplankton biomass. This study, although temporally limited, is consistent with the results reported for other marine environments and it seems to confirm the importance of nutrient inputs in structuring the biomass of plankton community.
Problem
The structure of marine planktonic food webs is controlled by ‘bottom-up’ (availability of resources) and ‘top-down’ (grazing, predation) processes. The strength of the match between these two types of processes can influence the fluxes of biogenic carbon among organisms and the biomass export (Legendre & Rivkin 2002). The size structure of the plankton community and the strength of the coupling between the control processes have a strict interrelationship (Legendre et al. 1999). The biomass distribution in the different planktonic compartments is, indeed, mainly related to the growing conditions, resulting from the balance between production and loss processes (Strom 2002; Irigoien et al. 2005). In the Mediterranean waters it has been shown that changes in the biomass distribution of marine plankton communities, both between autotrophs and heterotrophs and among different size classes, occur in relation to increasing water trophic status (Duarte et al. 2000). Although these changes may be the result of differences in nutrient supply, grazing pressure or a combination of both factors, the increased nutrient inputs lead to a shift in the biomass distribution by increasing the biomass of autotrophs more than that of heterotrophs (Gasol et al. 1997; Duarte et al. 2000). Changes in the balance between autotroph and heterotroph biomass have important implications for the processes (e.g. bacterial carbon demand and community respiration versus primary production) that rule the ecosystem functioning.
Within this conceptual context, the goal of the present study was to investigate the changes in the planktonic biomass structure in relation to nutrient inputs in the Gulf of Venice (Northern Adriatic Sea). The Gulf of Venice is considered a mesotrophic area, but it is actually characterized by a marked variability in nutrient inputs and trophic status, at relatively short temporal and spatial scales. The variability of the area has been already assessed in previous papers, mainly concerning the trophic status, the phytoplankton (Bernardi Aubry et al. 2006a,b; Pugnetti et al. 2006; Bazzoni et al. in press) and the mesozooplankton (Camatti et al. 2002).
The whole planktonic compartment, from picoplankton to mesozooplankton, is analysed here for the first time. The focus is on the biomass distribution in the plankton communities and on the proportion of autotroph and heterotroph biomass. Our aim was to evaluate the overall response of the plankton community by comparing 2 years (2005 and 2006) characterized by different average nutrient inputs. We tested the hypothesis that nutrient variations should influence the autotrophic versus heterotrophic composition of the whole system, by inducing a change in the planktonic autotroph/heterotroph biomass ratio, so that the most oligotrophic conditions should result in heterotrophic biomass exceeding that of autotroph biomass.
Study Area
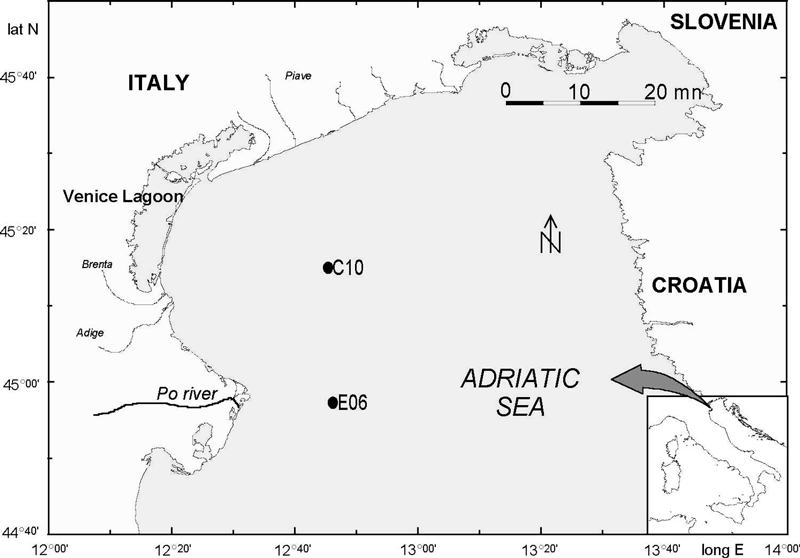
The Gulf of Venice (Fig. 1) is a shallow system (maximum depth: 45 m) located in the northwestern part of the Northern Adriatic Sea. It is characterized by a high variability of the trophic gradient, at relatively short spatial and temporal scales. This area encompasses a highly dynamic transition zone between mesotrophic and oligotrophic waters. Indeed, it is characterized by the inputs of several rivers, of which the Po, the main Italian river, is the major contributor of total freshwater and nutrient inputs. On the other hand, it is also influenced by the highly saline and oligotrophic waters from the southern Adriatic basin (Franco & Michelato 1992). Complex hydrodynamics and the seasonal alternation of vertical mixing and stratification make this system highly heterogeneous (Boicourt et al. 1999).

The Gulf of Venice with the location of the two sampling stations (C10 and E06).
The largest discharge of the Po river (around 4000 m3·s−1, with exceptional maxima up to 9000 m3·s−1), is generally observed in late spring and autumn, with an elevated year to year variability. The average salinity ranges between 35.6 and 38.4 PSU (Bernardi Aubry et al. 2006a; Pugnetti et al. 2006). The concentration of inorganic nutrients can be highly variable: e.g. dissolved inorganic nitrogen generally ranges from 1 to 8 μm, with a maximum of 50 μm, and phosphate generally ranges from 0.01 and 0.1 μm, with a maximum of 1 μm (Pugnetti et al. 2004a,b, 2006; Bernardi Aubry et al. 2006a,b). High N/P values, far above the Redfield ratio, are considered intrinsic characteristics of the Northern Adriatic (Degobbis & Gilmartin 1990; Harding et al. 1999); however, variations of nutrient availability, and alternating P and N limitation, may occur rapidly, in relation to sudden changes in the Po River discharge and to phytoplankton uptake (Degobbis et al. 2000, 2005).
The phytoplankton is mainly made up by diatoms and nanoflagellates. An intense late-winter diatom bloom (mainly Skeletonema marinoi), minor and variable peaks from spring to summer, and a decline during autumn, up to the winter minima, characterize the annual cycle of phytoplankton (Bernardi Aubry et al. 2006a). Quantitative, rather than qualitative, variations of the phytoplankton community define the trophic gradient of the area at the spatial scale (Bernardi Aubry et al. 2006a).
Autotrophic picoplankton also represents a consistent component of the phytoplankton in the Gulf of Venice, with an inverse exponential relation between its relative contribution and total phytoplankton (Bernardi Aubry et al. 2006b). Mesozooplankton maxima are observed in late spring and summer. Copepods, in particular calanoids (mainly Acartia clausi and Paracalanus parvus), are the dominant components, while cladocerans attain their highest abundance in summer with Penilia avirostris (Camatti et al. 2002).
Material and Methods
The investigation was carried out within the framework of the INTERREG III Program, Sub-Project OBAS (Biological Oceanography of the Northern Adriatic) on board the R/V G. Dallaporta, at two stations (stations C10 and E06, Fig. 1) which, from previous studies, can both be considered fairly representative of the hydrological and trophic features and variability of the area (Pugnetti et al. 2004a,b, 2006; Bernardi Aubry et al. 2006a,b). One of the two (st. C10) is a long-term research station of the Northern Adriatic site, recently included in the Italian Long-Term Ecological Research Network (Matteucci et al. 2007; Pugnetti et al. 2007).
Six cruises were carried out in March, May and July 2005 and 2006.
Discrete samples, at five depths along the water column (surface, 1, 5, 15 m and near-bottom layer) were gathered with a Niskin bottle for the analysis of phytoplankton community, bacteria, nanoheterotrophs and microzooplankton. Mesozooplankton samples were collected by vertical hauls, from the bottom to the surface, using a 200-μm mesh plankton net.
The aim of this work is circumscribed to the analysis of the biomass structure of the planktonic system and of its possible changes in relation to nutrient inputs. To accomplish this, we selected to focus on the comparison between the two study years (2005 and 2006), considering the water column as a whole, by calculating the depth integrated averages of the plankton data, and the whole study area, which we consider to be well represented by both stations. The depth variations of the plankton biomass, the differences between the two stations, as well as the taxonomic composition of the plankton community, are not considered here, being beyond of the central aim of the paper itself.
During each sampling, temperature and salinity were measured (Idronaut Ocean Seven 316 Multiprobe) and discrete samples were gathered for dissolved macronutrients analysis (Grasshof et al. 1983). The Po River discharge data were supplied by ARPA Emilia Romagna (Bologna, Italy).
Water column plankton biomass was determined by numerical integration of the data gathered at each depth.
To estimate the autotrophic picoplankton (0.2–2 μm: APP) abundance, water samples were preserved with pre-filtered buffered formaldehyde and kept at 4 °C. Duplicate slides were prepared by filtering 5–10 ml from each sample onto 0.2-μm pore size Nucleopore black membranes. The cell counts were made using a Zeiss Axiovert 35 microscope, equipped with a HBO 100 W light. A BP 450–490 exciter filter, an FT 510 chromatic beam splitter and an LP 520 barrier filter were used. APP was determined by natural pigment fluorescence. About 400 cells were counted on at least 20 randomly selected fields, for each slide, at a final 1000× magnification. Cell sizes of about 50% randomly selected individuals were measured by Image analysis, using Image Pro Express (Media Cybernetics). Most APP cells were coccoid- or rod-shaped; therefore, to determine their carbon biomass, cell volume was calculated by approximation to a sphere or to a rotation cylinder. For Synechococcus spp., dominant in this study, there are a number of published factors to convert biomass to carbon, ranging from 85 to 400 fg·C·μm−3, and the actual values are supposed to be even higher (Li 1986). We followed the indications of Tamigeaux et al. (1995) for coastal area and for cells comparable with ours. The coefficients here applied were, therefore, 0.250 fg·μm−3 for Synechococcus spp. and 220 fg·μm−3 for eukaryotes.
Samples (10 ml) to estimate heterotrophic picoplankton (HPP) were fixed with 2% final concentration borate-buffered formalin (pre-filtered through a 0.2-μm Acrodisc filter) and stained for 15 min with 4’6 diamidino-2-phenylindole (DAPI, Sigma) at 1 μg·ml−1 final concentration (Porter & Feig 1980). Subsamples were filtered in triplicate onto 0.2-μm black-stained polycarbonate filters (Nucleopore) and preserved at −20 °C. Filters were mounted on microscope slides, between layers of non-fluorescent immersion oil (Olympus), and counted under a UV filter set (BP 330–385 nm), using an Olympus BX 60 F5 epifluorescence microscope at 1000×. At least 20 random fields and a minimum of 300 cells were counted for each filter. Each Heterotrophic Bacterial Abundance (HBA) value represents the mean of triplicate samples with a coefficient of variation lower than 5%. Bacterial abundance was converted into carbon equivalents using the conversion factor of 20 fgC·cell−1 (Lee & Fuhrman 1987). For nanoplankton (2–20 μm) analyses, water samples were preserved with glutaraldehyde (10% final concentration) and stained with DAPI at 1 μg·ml−1 final concentration. Then, duplicated slides were prepared by filtering 20 ml from each sample onto black pre-stained Nucleopore polycarbonate filters (0.8 μm pore size, 25 mm diameter). The cell counts were made using a Zeiss Axiovert 35 microscope, equipped with a HBO 100 W light. A BP 450–490 exciter filter, an FT 510 chromatic beam splitter and an LP 520 barrier filter were used for autotrophic nanoplankton (ANP). A BP 365/12 exciter filter, an FT 395 chromatic beam splitter and an LP 397 barrier filter were used for heterotrophic nanoplankton (HNP). Cell size measurements were carried out individually to attribute each cell to the appropriate size class. Cell volume was calculated on about 200 cells (selected randomly on a variable number of microscopic fields) from a two-dimensional cell image, by considering appropriate geometric forms. The resulting volumes were transformed into organic carbon values as indicated by Edler (1979), by multiplying cell volume by 0.14.
The samples for the determination of microphytoplankton (>20 μm, autotrophic microplankton – AMP) were fixed with hexamethylenetetramine-neutralized formaldehyde to a final concentration of 4% and examined with an inverted microscope Zeiss Axiovert 35, equipped with phase contrast at a final 400× magnification. Subsamples (5–50 ml) were allowed to settle for 12–48 h and then examined (Utermöhl 1958). A variable transect number was observed until at least 200 cells were counted for each sample (Zingone et al. 1990). The appropriate cell size (>20 μm) was measured directly. The biovolume of AMP was determined according to Strathman (1967) and the carbon was obtained by multiplying cell or plasma volume by 0.11 for diatoms and by 0.13 for dinoflagellates (Smetacek 1975).
To determine abundance and biomass of microzooplankton (HMP), 2-l samples were fixed with hexamethylenetetramine-buffered formaldehyde at a final concentration of 1.5%. Samples were concentrated to 200 ml by sedimentation (Dolan et al. 2000) in a first step. At least 50 ml of the pre-concentrated samples were settled in sedimentation chambers according to Utermöhl (1958) and examined with a Zeiss IM135 inverted microscope at 200×. The species or genera found were measured and grouped according to size and standardized geometrical forms. Individual cell volume was transformed into carbon content using the conversion factor of 14 pg·C·μm−3 for formaldehyde-fixed samples from Putt & Stoecker (1989) and the formula of 444.5 pg·C (lorica volume in μm−3 × 0.053 pg·C) per cell for tintinnids (Verity & Langdon 1984).
For the determination of mesozooplankton (MesoZ), samples were preserved in 4% borax-buffered formaldehyde until laboratory analysis. Quantitative analyses were performed under a Zeiss dissecting microscope on sub-samples of the original samples, according to ICRAM protocol (ICRAM 2001). Mesozooplankton organic carbon was determined with a Perkin-Elmer 2400 CHN elemental analyser: sub-samples were filtered onto precombusted GF/F glass fibre filters and exposed to HCl vapours for 24 h (Hedges & Stern 1984) to remove the inorganic carbon.
Results
The average Po River discharge during 2005–2006 (865 ± 500 m3·s−1) was much lower than the previous decade (1995–2004: 1544 ± 1090 m3·s−1). Higher salinity, lower nutrient and chlorophyll a concentrations (Table 1) in the two study years were recorded in comparison with the three most recent years (1999–2001) for which these data are available at both stations (Pugnetti et al. 2004b; Bernardi Aubry et al. 2006b). During the sampling periods, signals of diluted waters and nutrient inputs were observed, when considering the surface layer, and these were more marked in 2005 than in 2006 (Table 1).
| 1999–2001 | 2005–2006 | |
|---|---|---|
| average Po River discharge (m3·s−1) | 1715 ± 1230 | 865 ± 500 |
| salinity | 36.2 ± 2.4 | 37.7 ± 0.1 |
| anomaly of density (γt) | 26.3 ± 2.4 | 27.7 ± 2 |
| dissolved inorganic nitrogen (μm) | 4.5 ± 7.4 | 2.0 ± 2.5 |
| phosphates (μm) | 0.1 ± 0.1 | 0.07 ± 0.04 |
| chlorophyll aμg·l−1 | 1.3 ± 1.1 | 1.1 ± 1.5 |
| 2005 | 2006 | |
| salinity | 35.9 ± 2.0 | 37.8 ± 0.4 |
| anomaly of density (γt) | 25.9 ± 3.3 | 27.4 ± 2.2 |
| dissolved inorganic nitrogen (μm) | 3.1 ± 2.9 | 1.1 ± 0.6 |
| phosphates (μm) | 0.1 ± 0.05 | 0.06 ± 0.02 |
| chlorophyll aμg·l−1 | 2.3 ± 3.1 | 0.7 ± 1.0 |
The average total plankton biomass in the area (Table 2) was almost twice as large in 2005 (87.0 ±36.5 μg·C·l−1) as in 2006 (43.5 ± 25.6 μg·C·l−1). The average biomass decrease from 2005 to 2006 was 30% and 70%, respectively, in the heterotrophic (from 43.0 ±16.2 to 30.6 ± 5.0 μg·C·l−1) and autotrophic compartments (from 44.0 ± 23.8 to 12.9 ± 21.1 μg·C·l−1).
| μg·C·l−1 | 2005 | 2006 |
|---|---|---|
| APP | 2.1 ± 1.4 | 2.9 ± 1.0 |
| ANP | 2.7 ± 2.4 | 0.8 ± 0.8 |
| AMP | 26.7 ± 22.1 | 9.2 ± 19.7 |
| total autotrophs | 44.0 ± 23.8 | 12.9 ± 21.1 |
| HPP | 13.1 ± 3.0 | 16.8 ± 3.8 |
| HNP | 15.5 ± 10.4 | 3.1 ± 1.2 |
| HMP | 7.6 ± 5.3 | 3.6 ± 3.5 |
| MesoZ | 6.8 ± 4.5 | 7.1 ± 3.6 |
| total heterotrophs | 43.0 ± 16.2 | 30.6 ± 5.0 |
| total plankton | 87.0 ± 36.5 | 43.5 ± 25.6 |
- APP = autotrophic picoplankton; ANP = autotrophic nanoplankton; AMP = autotrophic microplankton; HPP = heterotrophic picoplankton; HNP = heterotrophic nanoplankton; HMP = microzooplankton; MesoZ = mesozooplankton.
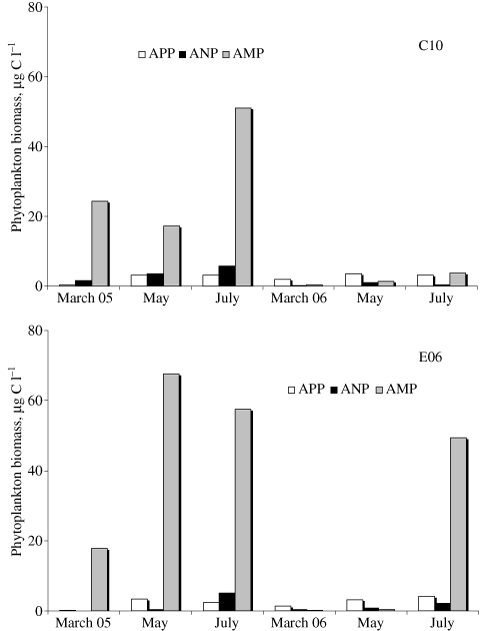
At both stations, phytoplankton biomass (Fig. 2 and Table 2) was characterized by the dominance of microphytoplankton in 2005 (average: 88 ± 9%) and of picophytoplankton in 2006 (average: 56 ± 27%). The peak of microphytoplankton observed at st. E06 in July 2006 (Fig. 2) could not be associated with any variation in nutrient inputs and it was determined by the presence of large-sized diatoms only at the near-bottom layer.

Variation of phytoplankton biomass (average data integrated along the water column) at the two stations. APP: autotrophic picoplankton, ANP: autotrophic nanoplankton, AMP: autotrophic microplankton.
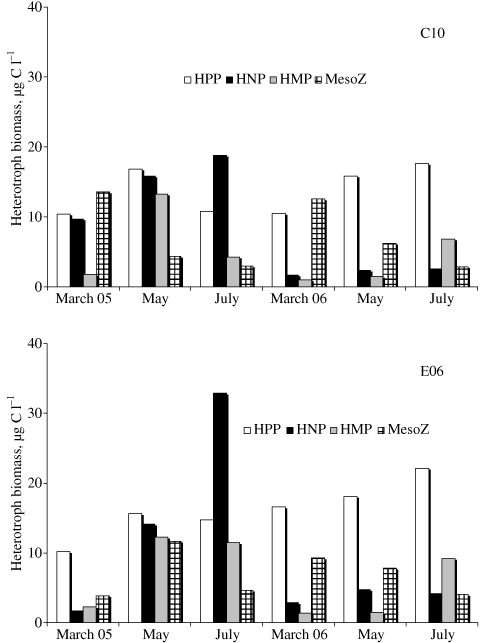
The heterotrophic compartment (Fig. 3 and Table 2) was represented mainly by bacteria and nanoflagellates in 2005 (average: 66 ± 10%), by bacteria and mesozooplankton (average: 80 ± 10%) in 2006. On average, the biomass of nanoflagellates and microzooplankton showed a clear decrease in 2006, whereas bacteria and, to a lesser extent, mesozooplankton increased (Fig. 3 and Table 2).

Variation of planktonic heterotrophic biomass (average data integrated along the water column) at the two stations. HPP: heterotrophic picoplankton, HNP: heterotrophic nanoplankton, HMP: microzooplankton, MesoZ: mesozooplankton.
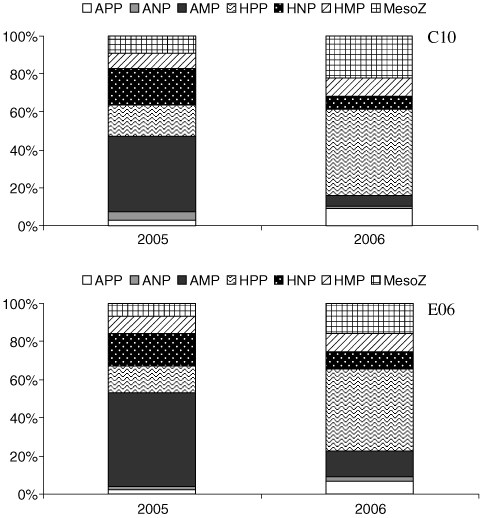
Considering the average carbon partitioning in 2005 and 2006, a shift from a microphytoplankton-dominated community to a bacteria-dominated one could be evidenced at both stations (Fig. 4).

Average percentage plankton biomass in the 2 years, at the two stations. APP: autotrophic picoplankton, ANP: autotrophic nanoplankton, AMP: autotrophic microplankton, HPP: heterotrophic picoplankton, HNP: heterotrophic nanoplankton, HMP: microzooplankton, MesoZ: mesozooplankton.
The heterotroph/autotroph biomass ratio (H/A) ranged between 0.6 and 15. The lowest ratio (<1) was recorded in correspondence with the highest phytoplankton biomass that occurred when microphytoplankton dominated. On average the H/A was around 1.0 in 2005 and it increased up to 7.0 in 2006. The non-linear relationship between H/A and the total autotroph biomass (Fig. 5) indicates a rapid decline of H/A with increasing phytoplankton biomass.

Relation between the heterotroph and autotroph (H/A) biomass ratio and total phytoplankton biomass.
Discussion
In marine environments there appears to be a relation between the trophic state and the heterotrophic/autotrophic biomass ratio (Gasol et al. 1997; Duarte et al. 2000). Oligotrophic plankton communities show heterotrophic biomass exceeding that of autotrophs. The highest turnover rates of the autotrophic pool, low phytoplankton biomass and a tight coupling between phytoplankton control processes (resource availability versus grazing) are considered the combined factors that allow the existence of an inverted trophic pyramid. By contrast, in eutrophic areas the proportion of autotrophs increases much more than that of heterotrophs, thus leading to a dominance of phytoplankton biomass. A shift from consumer regulation of phytoplankton biomass to resource regulation seems therefore to follow the increase of the trophic status of marine ecosystems (Agustìet al. 1992; Legendre & Rassoulzadegan 1999; Legendre & Rivkin 2002). The occurrence of phytoplankton blooms can be related to an improvement of growth conditions, resulting from a disturbance in the balance between resource availability and predation (Irigoien et al. 2005).
The structure of the food webs and the biomass partitioning between autotrophs and heterotrophs have important consequences for the biogeochemistry of marine environments (Rivkin & Legendre 2002). The different structure of the planktonic compartment has important implications for ecosystem functions: the proportion of autotrophs and heterotrophs reflects also the prevalent autotrophic (primary production) or heterotrophic (bacterial production, community respiration) processes.
The main goal of this paper was to test the hypothesis that nutrient variations should influence the plankton autotroph/heterotroph biomass ratio. We analysed the biomass distribution in the planktonic compartment in an ecosystem (the Gulf of Venice) that is characterized by an elevated trophic variability. Notwithstanding this variability, the Gulf of Venice is considered mainly meso-eutrophic, due to the important inputs of nutrients from the major Italian river. However, the two years of study represented quite an exception to these typical trophic conditions, being characterized by low river discharge and nutrient inputs. The two years could, however, be differentiated on the basis of nutrient availability, this being higher in 2005. The comparison between the plankton community structures in the two years provides indications supporting the hypothesis that the relative biomass distribution between heterotrophs and autotrophs is regulated by nutrient supply, which controls the phytoplankton biomass. Indeed, the microphytoplankton dominated the plankton community at highest nutrient inputs, whereas there was a marked prevalence of heterotrophs under the most oligotrophic conditions.
Studies carried out in the nearby Gulf of Trieste (Fonda Umani & Beran 2003; Fonda Umani et al. 2005) demonstrated both the importance of microzooplankton grazing, as the most important loss term of primary production, and the efficient matching between phytoplankton growth and consumption. In that area the development of phytoplankton blooms could occur only in periods of grazing release by micro- or mesozooplankton. A tight coupling between primary production and phytoplankton biomass losses has been observed also in the Gulf of Venice (Pugnetti et al. 2004a,b; Bazzoni et al. in press). The matching between production and losses confirms the existence of an efficient biological control and suggests the prevalence of a multivorous food web (Legendre & Rassoulzadegan 1999; Legendre et al. 1999).
In this context, nutrients appear a key factor in structuring the pelagic compartment in the Gulf of Venice, allowing phytoplankton growth rates to exceed grazing losses. As already observed in other marine environments (Gasol et al. 1997; Duarte et al. 2000), in the Gulf of Venice, nutrient variations had a much greater influence on the autotrophic than on the heterotrophic community: both compartments decreased in 2006, but phytoplankton biomass was reduced much more (on average 70%) than heterotrophs (on average 30%).
The overall effect of decreased nutrient inputs resulted in a shift from a microphytoplankton- to a bacteria-dominated community. This biomass shift suggests also the occurrence of a different function of the system, characterized, respectively, by biomass accumulation and export, and recycling and respiration (Legendre & Rassoulzadegan 1996;Legendre & Rivkin 2002).
Although temporally limited to a period of two years, characterized by quite low nutrient inputs, our results are consistent with those reported for other marine environments and seem to confirm the hypothesis of the importance of nutrient inputs in structuring the whole plankton community and the main functional processes in the Northern Adriatic Sea.
Acknowledgements
This research was carried out within the framework of the initiative INTERREG III (Italy-Slovenia), project OBAS (Biological Oceanography of the Northern Adriatic Sea). We acknowledge the crew of the R/V G. Dallaporta for their helpful assistance in the sampling activities. The Po river discharge data were kindly supplied by ARPA Emilia Romagna (Bologna, Italy).


