The lack of floral synthesis and emission of isoeugenol in Petunia axillaris subsp. parodii is due to a mutation in the isoeugenol synthase gene
Summary
Floral scent has been extensively investigated in plants of the South American genus Petunia. Flowers of Petunia integrifolia emit mostly benzaldehyde, while flowers of Petunia axillaris subsp. axillaris emit a mixture of volatile benzenoid and phenylpropanoid compounds that include isoeugenol and eugenol. Flowers of the artificial hybrid Petunia hybrida, a cross between P. integrifolia and P. axillaris, emit a similar spectrum of volatiles as P. axillaris subsp. axillaris. However, the flowers of P. axillaris subsp. parodii emit neither isoeugenol nor eugenol but contain high levels of dihydroconiferyl acetate in the petals, the main scent-synthesizing and scent-emitting organs. We recently showed that both isoeugenol and eugenol in P. hybrida are biosynthesized from coniferyl acetate in reactions catalyzed by isoeugenol synthase (PhIGS1) and eugenol synthase (PhEGS1), respectively, via a quinone methide-like intermediate. Here we show that P. axillaris subsp. parodii has a functional EGS gene that is expressed in flowers, but its IGS gene contains a frame-shift mutation that renders it inactive. Despite the presence of active EGS enzyme in P. axillaris subsp. parodii, in the absence of IGS activity the coniferyl acetate substrate is converted by an as yet unknown enzyme to dihydroconiferyl acetate. By contrast, suppressing the expression of PhIGS1 in P. hybrida by RNA interference also leads to a decrease in isoeugenol biosynthesis, but instead of the accumulation of dihydroconiferyl acetate, the flowers synthesize higher levels of eugenol.
Introduction
Many plant species produce and emit from their flowers a mixture of scent compounds to attract pollinators. Floral bouquets are usually a blend of aromatic compounds. Plants have evolved their floral scent to maximize their reproductive potential under specific ecological conditions and with specific pollinators. It appears likely that individual chemical components of these scents allow pollinators, most often insects, to distinguish between even closely related plant species (Ando et al., 2001). Analysis of the variation in floral scents among genetically closely related plant species may lead to a better understanding of the mechanisms underlying the generation of scent diversity. For example, the flowers of the California annual Clarkia breweri emit a mixture of volatiles that includes linalool, while a closely related species, Clarkia concinna, does not emit this compound. Notably, the genomes of both species contain a gene for linalool synthase but the gene is highly expressed in flowers of C. breweri and not in flowers of C. concinna. The emission of linalool from C. breweri flowers (and additional scent compounds, which contain eugenol and isoeugenol, missing from the C. concinna flowers) correlated with the attraction of a hawkmoth pollinator that does not regularly visit C. concinna flowers.
The coevolution of scent and pollinators has also been studied in the South American genus Petunia. Petunia integrifolia flowers are pigmented, emit mostly benzaldehyde, and are pollinated by bees. Flowers of the related species Petunia axillaris are white, emit a mixture of several benzenoids and phenylpropenes, and are pollinated by various species of hawkmoth (Hoballah et al., 2005, 2007). Moreover, some variation in scent composition among different accessions of P. axillaris was noted, and in particular it was observed that the flowers of the subspecies P. axillaris parodii did not emit eugenol and isoeugenol, while P. axillaris axillaris flowers did (Hoballah et al., 2005).
Flowers of several lines of the artificial hybrid species Petunia hybrida, a cross between P. integrifolia and P. axillaris, have been examined for volatile emission. It has been found that they emit a similar spectrum of volatiles as Petunia axillaris subsp. axillaris (Verdonk et al., 2005; Sagae et al., 2008). In particular, most P. hybrida cultivars emit varying amounts of eugenol and isoeugenol. The synthesis of isoeugenol and eugenol was recently elucidated in P. hybrida cv. Mitchell. It was shown that isoeugenol was formed by the action of isoeugenol synthase 1 (PhIGS1) using coniferyl acetate as the substrate, which itself is biosynthesized from coniferyl alcohol and acetyl-CoA in a reaction catalyzed by coniferyl alcohol acetyltransferase (PhCFAT) (Koeduka et al., 2006; Dexter et al., 2007). The enzyme responsible for the synthesis of eugenol in P. hybrida flowers was also identified (Koeduka et al., 2008). This protein, designated eugenol synthase 1 (PhEGS1), is homologous to PhIGS1 and also uses coniferyl acetate as the substrate but biosynthesizes eugenol (Koeduka et al., 2008).
Kondo et al. (2007) also examined scent biosynthesis and emission in P. axillaris, confirming that flowers of several P. axillaris parodii accessions as well as some P. axillaris axillaris accessions emitted little or no isoeugenol and eugenol. They also demonstrated that the petals of these flowers, unlike the high isoeugenol-emitting P. axillaris axillaris accessions, contained high levels of dihydroconiferyl acetate (Kondo et al., 2007). Given the obvious similarity in chemical structure between dihydroconiferyl acetate and coniferyl acetate, the precursor of eugenol and isoeugenol, Kondo et al. (2007) hypothesized that the lack of eugenol and isoeugenol synthesis and the synthesis of dihydroconiferyl acetate were linked, but no molecular mechanism has been identified to date.
Here we present data indicating that the IGS gene in the genome of P. axillaris parodii contains a mutation that renders the encoded IGS enzyme non-functional. This natural mutation in PapIGS leads to the production of a non-functional IGS enzyme, and despite the presence of EGS activity in the flowers the coniferyl acetate substrate is mostly converted to dihydroconiferyl acetate by the action of an unidentified reductase. By contrast, experimentally reducing PhIGS1 expression in P. hybrida by using RNA interference (RNAi) suppression leads to a reduction in isoeugenol synthesis and the concomitant increase in eugenol biosynthesis.
Results
Analysis of floral scents in Petunia axillaris parodii
We obtained the same P. axillaris parodii line as analyzed by Hoballah et al. (2005) and confirmed that it does not emit isoeugenol or eugenol (Figure 1a). The flowers also do not emit dihydroconiferyl acetate (Figure 1a). On the other hand, extraction of the petal tissue with hexane revealed that the petals contained dihydroconiferyl acetate at a concentration of 183.5 ± 4.6 ng mg–1 fresh weight (FW) (Figure 1b).

Gas chromatography-mass spectrometry (GC–MS) analysis of volatile compounds from Petunia axillaris parodii flowers.(a) Separation by GC of volatile compounds emitted from P. axillaris parodii petals and collected by a headspace sampling system. Compounds were identified based on their mass spectra and retention time: 1, benzaldehyde; 2, benzyl alcohol; 3, methyl benzoate; 4, benzyl acetate; 5, methyl salicylate; 6, benzyl benzoate; 7, benzyl salicylate (but not coniferyl derivatives). Relative abundance is shown in arbitrary units, based on total ion current (TIC) measurement. The GC program for this analysis was according to Koeduka et al. (2008).(b) The GC–MS analysis of hexane-soluble compounds extracted from P. axillaris parodii petals. The arrow shows the peak of dihydroconiferyl acetate (DCA), with its mass spectra shown in the inset; 6, benzyl benzoate; 7, benzyl salicylate.(c) The GC–MS of authentic dihydroconiferyl acetate (DCA) standard. Its structure is also shown.(d) The GC–MS and structures of authentic isoeugenol (IEG) and eugenol (EG) standards.(e) The GC–MS and structures of authentic coniferyl acetate (CA) standard.
Sequence analysis of P. axillaris parodii isoeugenol synthase
To determine the cause of the lack of isoeugenol biosynthesis in P. axillaris parodii, we first isolated cDNAs encoding IGS (PapIGS) from these plants by RT-PCR, using oligonucleotides specific for the 5′ and 3′ ends of the P. hybrida IGS1 sequence. Complementary DNAs were obtained from multiple independent RT-PCR reactions, and their sequences all showed differences at eight nucleotide positions relative to the previously reported PhIGS1 cDNA (Figure 2). Most significantly, sequence alignment demonstrated that two nucleotides, T and C at position 250 and 251 in PhIGS1, were substituted with a single A, creating a reading frame shift in the PapIGS gene which if expressed and translated would lead to a significantly shortened protein. Determination of the sequence of the PapIGS gene (accession FJ609836), which was obtained by PCR of genomic DNA, showed that this mutation occurs in the middle of the second exon.
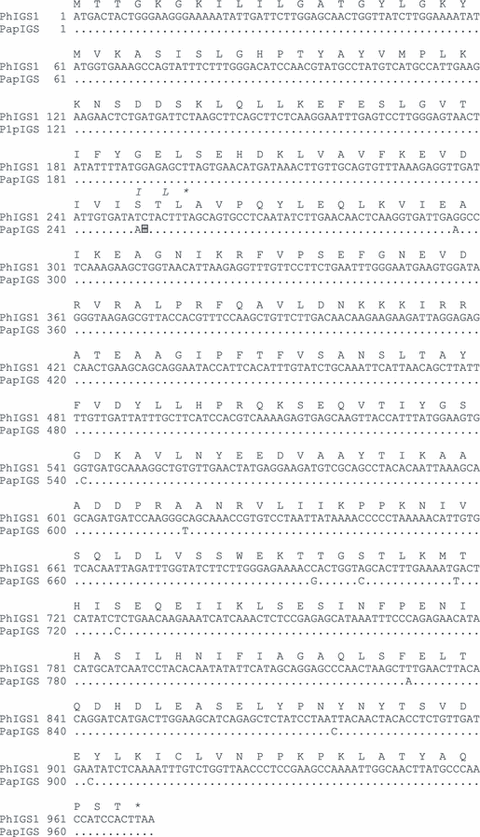
Sequence of Petunia axillaris parodii isoeugenol synthase (IGS). The sequence of the PhIGS1 protein and its gene is shown in full. A dot represents a nucleotide in the PapIGS sequence that is identical to that found in PhIGS1. The position of the single nucleotide deletion in PapIGS, which leads to the frame shift, is indicated with a highlighted, framed dash. The sequence of the abbreviated protein encoded by the PapIGS gene is shown in italics above the sequence of PhIGS1 only when it differs from it.
The PapIGS cDNA was spliced into a bacterial expression vector and transferred to Escherichia coli, and upon induction of gene expression followed by lysis of the bacterial cells and in vitro biochemical assays, no IGS activity was detected in the lysate. The RT-PCR isolation of IGS cDNAs from several P. axillaris axillaris accessions yielded cDNAs that encoded proteins whose sequences were either identical to that of PhIGS1 or different at no more that five positions. We expressed all these cDNAs in the heterologous E. coli system and in all cases the P. axillaris axillaris proteins were enzymatically active (Figure S1).
Suppression of PhIGS1 in P. hybrida leads to emission of eugenol
Petunia hybrida is an artificial hybrid obtained by crossing P. integrifolia and P. axillaris. Its flowers emit high levels of isoeugenol (12.0 nmol g−1 FW h−1) and significantly lower levels of eugenol (0.8 nmol g−1 FW h−1). Moreover, some P. hybrida cultivars are amenable to genetic engineering manipulations (Jorgensen et al., 1996). To test if suppression of the PhIGS1 gene might result in the accumulation of dihydroconiferyl acetate in P. hybrida flower tissues, we employed two RNAi constructs containing gene-specific fragments from either the 5′ or 3′ ends of the coding region under the control of the C. breweri linalool synthase promoter, which is highly active in flower tissues but also displays low levels of activity in roots and stems (Orlova et al., 2006). Several independent transgenic P. hybrida cv. Mitchell lines were generated for each construct. Four independent lines were chosen for further analysis. Two lines expressing the PhIGS1 RNAi fragment from the 5′ end of the coding region (lines I-4 and I-14) and two independent transformed lines expressing the PhIGS1 RNAi fragment from the 3′ end of the coding region (lines II-4 and II-5) showed substantially reduced PhIGS1 transcript levels (Figure 3a) but no significant differences in the transcript levels of PhEGS1 (Figure 3b). In line II-5, which showed the most severe decrease in IGS1 mRNA levels, to 32% of the wild-type levels, the measured IGS activity levels were 35% of the wild-type levels (not shown), a corresponding reduction. Analysis of the floral volatiles emitted by these four lines revealed moderate to strong (45–90%) reduction in isoeugenol emission compared to wild-type flowers (3, 4), and with corresponding increases in eugenol emission (3, 4), so that the combined emission output of isoeugenol and eugenol per flower remained very similar to the combined isoeugenol and eugenol emission of a wild-type flower. The progeny of these four transgenic plants showed near identical decreases in isoeugenol emission and increases in eugenol emission with the corresponding parents, indicating that this change was heritable (Figure S2). Hexane extraction of the petal tissue of these transgenic plants showed no accumulation of dihydroconiferyl acetate, and none was found in the headspace.
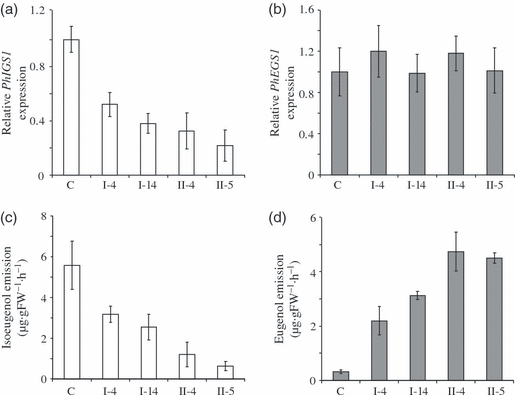
The effect of decreasing the levels of PhIGS1 mRNA in Petunia hybrida petals on eugenol and isoeugenol emission.(a, b) The relative PhIGS1 (a) and PhEGS1 (b) transcript levels in control and transgenic PhIGS1 RNAi petunia flowers. The relative mRNA transcript levels were analyzed in corollas of 48-h-old control and PhIGS1 RNAi petunia flowers by qRT-PCR and the expression levels of PhIGS1 and PhEGS1 in control plants were each set as 1. Each graph represents the average of three replications for each of two biological samples. Bars indicate SE.(c, d) Isoeugenol (c) and eugenol (d) emission in control and transgenic PhIGS1 RNAi petunia flowers. Floral volatiles were collected from 48-h-old petunia flowers using the closed-loop stripping method. For each plant, an average of five to eight independent measurements were obtained. Bars indicate SE.
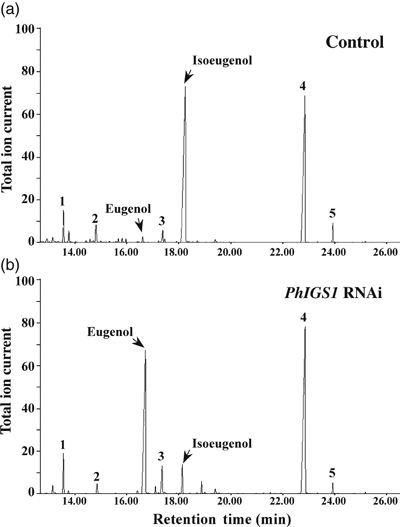
Metabolic profiling of volatile compounds emitted from Petunia hybrida flowers of control and PhIGS1 RNAi II-5 transgenic plants.(a) Headspace analysis of control flowers.(b) Headspace analysis of PhIGS1 RNAi II-5 transgenic flowers. Collected headspace volatiles were analyzed by gas chromatography-mass spectrometry (GC–MS). Compounds were identified based on their mass spectra and retention time: 1, internal standard (naphthalene); 2, phenylethylacetate; 3, vanillin; 4, benzylbenzoate; 5, phenylethylbenzoate. Relative abundance is shown in arbitrary units, based on total ion current (TIC) measurement. The GC program for this analysis was according to Orlova et al. (2006), resulting in longer retention times for the compounds than observed in Figure 1.
Isolation and characterization of eugenol synthase and coniferyl alcohol acetyltransferase genes from P. axillaris parodii and the proteins they encode
Since transgenic P. hybrida plants in which the PhIGS1 gene was suppressed did not produce dihydroconiferyl acetate but instead showed increased production of eugenol, it appears that reduction in IGS activity allowed the PhEGS1 enzyme molecules in the petal cells, whose concentration has not changed, better access to the coniferyl acetate substrate. To understand why an elevated production of eugenol was not observed in P. axillaris parodii flowers, which also lack a functional IGS protein, we examined whether P. axillaris parodii flowers possessed similar levels of CFAT and EGS transcripts and CFAT and EGS enzymatic activities to those found in P. hybrida. We therefore isolated cDNAs of PapCFAT and PapEGS from P. axillaris parodii petal RNA by RT-PCR and expressed these cDNAs in E. coli cells. The sequences of the proteins encoded by PapEGS and PapCFAT cDNAs differ in two and nine positions, respectively, relative to PhEGS1 and PhCFAT1 proteins (Figure S3). However, PapEGS displayed apparent Km and kcat values with coniferyl acetate of 155.6 μm and 0.85 sec−1, respectively, that are very similar to those of PhEGS1 (Koeduka et al., 2008). In addition, a coupled in vitro assay using PapEGS and PapCFAT led to the synthesis of eugenol (Figure 5).

Gas chromatography–mass spectrometry (GC–MS) analysis of the reaction products in reactions catalyzed by Petunia axillaris parodii eugenol synthase (EGS) and coniferyl alcohol acetyltransferase (CFAT).(a) The reaction mixture contained coniferyl acetate, NADPH, and purified PapEGS.(b) The reaction mixture contained coniferyl alcohol, NADPH, acetyl-CoA, and purified PapEGS and PapCFAT. The eugenol peak was identified by MS (inset), and matched to the mass fragmentation pattern and retention time of authentic eugenol standard.
Transcript levels of CFAT, IGS and EGS were determined by quantitative (q)RT-PCR in both P. axillaris parodii and P. hybrida plants (Figure 6). EGS expression levels were similar in both species. Levels of PhIGS1 transcripts were approximately 70% of those of PhEGS1, whereas levels of PapIGS transcripts were extremely low. The significant decrease in accumulation of the mutated PapIGS transcripts is similar to what has been observed in other systems where transcripts encoding non-functional proteins are quickly degraded (Nam et al., 1999). In contrast, PapCFAT transcript levels were approximately twofold higher than levels of PhCFAT transcripts. CFAT, IGS and EGS activities in crude extracts from petals of both species were also measured. The CFAT and EGS activities were found to be 4-fold and 1.5-fold higher in P. axillaris parodii than in P. hybrida (Figure 7). As expected, petals of P. axillaris parodii had no IGS activity (Figure 7).
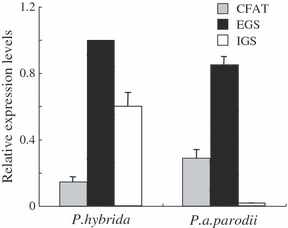
Detection of EGS, IGS, and CFAT transcripts in Petunia hybrida and Petunia axillaris parodii floral tissues. The relative mRNA transcript levels were analyzed in corollas of 48-h-old flowers by qRT-PCR and the expression of PhEGS1 in P. hybrida plants was set as 1. Each bar represents the average of three replications.
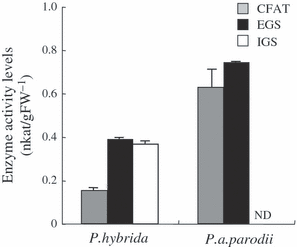
Eugenol synthase (EGS), isoeugenol synthase (IGS) and coniferyl alcohol acetyltransferase (CFAT) activities in Petunia hybrida and Petunia axillaris parodii floral tissues. Total activity levels were analyzed in corollas of 48-h-old flowers. Each bar represents the average of three replications. ND indicates no detectable activity.
Discussions
Pollination syndromes have been described in which a set of floral traits such as shape, pigmentation and scent (or lack thereof) render the flower most suitable to a specific type of pollinator, such as bees, hawkmoths or birds (Knudsen and Tollsten, 1993; Raguso et al., 2003; Stuurman et al., 2004). There has been considerable discussion about how many genetic changes are required to effect a change in pollinator. Several studies on floral scent in C. breweri (Raguso and Pichersky, 1995; Dudareva et al., 1996, 1998; Wang et al., 1997; Ross et al., 1999) have shown that the cause of the high levels of synthesis and emission of the scent compounds that render the C. breweri flowers attractive to hawkmoth pollinators, is the high levels of expression of the genes that encode the scent-biosynthetic enzymes. At least in some cases, these genes also exist in the essentially non-scented, bee-pollinated, close relative C. concinna, but they are not appreciably expressed in the flowers of the latter species.
Studies on the evolution of floral scent in the Petunia genus have also had the aim of understanding the molecular mechanisms that control the biosynthesis of compounds important for the attraction of pollinators, and how changes in these pathways occur over time. Hoballah et al. (2007) showed that whereas in flowers of P. integrifolia– which typically emit only benzaldehyde and are pollinated by bees – the gene AN2 controls the production of floral anthocyanin pigments, P. axillaris accessions contain a mutated, inactive copy of this gene and as a consequence the flowers are white. On the other hand, flowers of P. axillaris axillaris emit many more benzenoid and phenylpropene volatiles than flowers of P. integrifolia, including eugenol and isoeugenol. It has also been shown that flowers of P. hybrida, the artificial hybrid between P. axillaris and P. integrifolia, emit all the volatiles typically emitted by flowers of P. axillaris axillaris and may be pigmented similarly to P. integrifolia. In P. hybrida the shikimate pathway is responsible for the synthesis of the precursors of the benzenoid scent compounds and is regulated by a myb transcription factor encoded by the gene ODORANT1 (Verdonk et al., 2005). However, the activity of the ortholog of ODORANT1 in P. axillaris has not been investigated to date.
Our data show that when IGS activity is reduced in P. hybrida, the coniferyl acetate substrate that would have been used by PhIGS1 is instead used by PhEGS1, leading to increased eugenol formation relative to control flowers. It is interesting that ‘wild-type’ control (non-transgenic) flowers produce 15–30 fold more isoeugenol than eugenol, despite similar PhIGS1 and PhEGS1 transcript levels and kinetic parameters of the corresponding enzymes, with the kcat value of PhEGS1 being only twofold lower than that of PhIGS1 (Koeduka et al., 2008). It is possible that the levels of isoeugenol and eugenol synthesized reflect the levels of enzymatic activity of PhIGS1 and PhEGS1 in non-transgenic flowers, indicating that synthesis of PhIGS1 and PhEGS1 is regulated post-transcriptionally. On the other hand, a close association between CFAT and IGS (i.e. channeling) may explain the preponderance of isoeugenol produced in these flowers.
Since P. axillaris parodii lines from several natural habitats have been found to accumulate dihydroconiferyl acetate (Kondo et al., 2007), it is likely that the mutation in PapIGS is widespread in this subspecies and must therefore have occurred some time ago, before significant radiation of the species. While the identification of this natural mutation in the PapIGS gene provides a clear explanation for the lack of isoeugenol biosynthesis in this subspecies, we have not yet been able to determine why P. axillaris parodii plants do not make eugenol, nor identify the enzyme involved in the reduction of the coniferyl moiety to dihydroconiferyl. Our data indicate that CFAT as well as EGS are still active in flowers of P. axillaris parodii. Indeed, CFAT transcript levels as well as CFAT enzymatic activity in P. axillaris parodii petals are two and fourfold higher than those in P. hybrida, respectively, while EGS activity (but not transcript levels) is also approximately twofold higher. Yet, in contrast to the outcome observed in P. hybrida flowers in response to artificial suppression of PhIGS1, the flowers of P. axillaris parodii do not make eugenol but instead they reduce coniferyl acetate (or coniferyl alcohol – dihydroconiferyl alcohol can be acetylated by PapCFAT, see Figure S4) to dihydroconiferyl acetate. An NADPH-dependent double-bond reductase that uses similar substrates has been identified in several plant species (Youn et al., 2006), and it will be of interest to determine if a homologous enzyme is responsible for the synthesis of dihydroconiferyl acetate in P. axillaris parodii petals. However, while we were able to isolate several homologs of this gene from P. axillaris parodii by RT-PCR of petal cDNAs, none of the enzymes encoded by these genes were able to reduce coniferyl alcohol, coniferyl aldehyde or coniferyl acetate (data not shown).
Gas chromatography–mass spectrometry (GC–MS) analysis of petal extracts indicate that P. axillaris. parodii petals do not accumulate coniferyl alcohol or coniferyl acetate (Figure 1), suggesting that the reduction of coniferyl acetate (or coniferyl alcohol) to the dihydro derivative is quick and that the enzyme responsible for it competes well with EGS for the substrate. Since the mutation in PapIGS occurred many generations ago, it is possible that selection for an increased expression of a double-bond reductase has occurred over time to favor the synthesis of dihydroconiferyl acetate over an increase in the levels of eugenol, perhaps due to interactions with specific pollinators. Given the apparent linkage between the floral bouquet and pollinators in the Petunia genus, it will be of interest to determine if P. axillaris parodii flowers are visited by different pollinators from those visiting P. axillaris axillaris.
Experimental procedures
Plant materials and growth condition
Petunia axillaris parodii, P. hybrida cv. Mitchell (Ball Seed, http://www.ballhort.com/), and the transgenic petunia plants were grown in the greenhouse or growth chamber with a 16-h light period (supplemented to 100 μmol m−2 sec−1) and a temperature of 21°C, and an 8-h dark period at 16°C.
Preparation of dihydroconiferyl acetate
To synthesize 3-(4-hydroxy-3-methoxyphenyl)propyl acetate (dihydroconiferyl acetate), dihydroconiferyl alcohol (182.2 mg, 1.0 mm), Candida antarctica lipase B (25 mg), vinyl acetate (401 μl, 5.0 mmol), and dry diethyl ether (50 ml, 0.2 m) were added to a 125-ml Erlenmeyer flask at room temperature. The reaction was stirred at room temperature for 2 h. The solution was filtered through glass wool and concentrated in vacuo. The reaction yielded a colorless oil (222 mg, quantitative yield): 1H NMR (500 MHz, CDCl3) δ 6.83 (d, J = 8.6 Hz, 1H), 6.68 (m, 2H), 5.52 (br s, 1H), 4.08 (t, J = 6.6, 2H), 3.87 (s, 3H), 2.61 (t, J = 7.3 Hz, 2H), 2.06 (s, 3H), 1.92 (dt, J = 6.6, 7.3 Hz, 2H); 13C NMR (125 MHz, CDCl3) δ 171.2, 146.4, 143.8, 133.1, 120.9, 114.3, 110.9, 63.8, 55.8, 31.8, 30.4, 21.0. LCMS [M + Na]+ calculated for C12H16NaO4: 247.09, found: 247.17.
Enzyme assays
The reaction to detect CFAT activity contained 50 mm MES/KOH, pH 6.5, 1 mm acetyl-CoA, 0.5 mm coniferyl alcohol and 75 μl crude protein (= 10.0 mg FW, for crude enzyme assays) or 5.9 μg PapCFAT (reaction A). The reaction for EGS activity (total volume 150 μl) contained 50 mm MES/KOH, pH 6.5, 1 mm NADPH, 0.5 mm coniferyl acetate and 3.5 μg PapEGS (for the product identification) or 75 μl crude protein (= 10.0 mg FW, for crude enzyme assays). For the coupled reaction with PapCFAT and PapEGS, 3.5 μg PapEGS and 1 mm NADPH were added into reaction A. The crude enzyme solution was prepared from 48-h-old flowers by grinding under the protein extraction buffer (50 mm Bis-2-amino-2-(hydroxymethyl)1,3-propanediol (TRIS)–HCl, pH 7.0, 5 mm Na2S2O5, 10 mmβ-mercaptoethanol, 1% polyvinylpyrrolidone, 10% glycerol, and 100 mm phenylmethanesulfonylfluoride), followed by centrifugation at 12,000g for 10 min. Each enzyme reaction was carried out at room temperature for 30 min, and the reaction solution was extracted with 1 ml of hexane and concentrated with a mild stream of N2 gas. A concentrated fraction (2 μl) was injected into a GC–MS for analysis as described by Koeduka et al. (2008).
Quantitative RT-PCR
To determine transcript levels, total RNA was isolated from petal tissues 2 h before the dark period. For the relative expression analysis of petunia genes, 48-h-old petunia corolla tissues of control and PhIGS1 RNAi transgenic plants were used. In all cases, total RNA was extracted from collected tissues as previously described (Dudareva et al., 1996). The RNA was subjected to DNase treatment using the DNA-free kit (Ambion, http://www.ambion.com/), and first-strand cDNA was synthesized by Superscript II reverse transcriptase (Invitrogen, http://www.invitrogen.com/) with poly-T primers in parallel with a negative control reaction in which no Superscript II reverse transcriptase was added. The qPCR reactions utilizing SYBR-Green I dye (Molecular Probes, http://www.invitrogen.com/), Taq polymerase (New England Biolabs, http://www.neb.com/), fluorescein (Bio-Rad, http://www.bio-rad.com/), the specific primers (Table 1), and a dilution series of each cDNA standards, were performed as previously described (Varbanova et al., 2007).
| Construct | Direction | Primer sequence (5′→3′) |
|---|---|---|
| qRT-PCR | ||
| For CFAT | ||
| CFAT/F1 | Forward | GATGTCCTCACCAGTCGTGTCTACT |
| CFAT/R1 | Reverse | GAATCGTCAATACCTCCCTCTGCT |
| For EGS | ||
| EGS/F1 | Forward | GGATGGAAACGCTAAGGCTGTA |
| EGS/R1 | Reverse | CTCCCAAATAGCCACAAGCTCA |
| For IGS | ||
| IGS/F1 | Forward | GAGCAACTGAAGCAGCAGGAATAC |
| IGS/R1 | Reverse | GTAGGCTGCGACATCTTCCTCATA |
| For UBQ | ||
| UBQ/F1 | Forward | CAGACCAGCAGAGGCTGATTTT |
| UBQ/R1 | Reverse | GACGAAGCACCAAGTGAAGAGTAG |
| cDNA amplification (for C-terminal His-tag expression) | ||
| For CFAT | ||
| CFAT/F2 | Forward | ATGGGAAACACAGACTTTCATGTGA |
| CFAT/R2 | Reverse | ATAAGTAGCAGTAAGGTCCAAAT |
| For EGS | ||
| EGS/F2 | Forward | ATGGCTGAGAAAAGCAAAATTC |
| EGS/R2 | Reverse | GGCAAAGTGACTAAGGTACTCC |
| For IGS | ||
| IGS/F2 | Forward | ATGACTACTGGGAAGGGAAAAATA |
| IGS/R2 | Reverse | AGTGGATGGTTGGGCATAAGTTGCCAATTTT |
| RNAi constructs | ||
| For LIS promoter | ||
| LIS/F1 | Forward | GAGCTCGCGGCCGCAAGCTTATCTAATAATGTATCAAAA |
| LIS/R1 | Reverse | CTCGAGCCCGGGATGGTTGTCTTGT |
| For 5′IGS | ||
| IGS/F2 | Forward | ATGACTACTGGGAAGGGAAAAATA |
| 5′IGS/R1 | Reverse | ATCATGTTCACTAAGCTCTCC |
| For 3′IGS | ||
| 3′IGS/F1 | Forward | TCTGAACAAGAAATCATCAAAC |
| 3′IGS/R1 | Reverse | TTAAGTGGATGGTTGGGCATAAG |
Generation of RNAi silencing constructs
PhIGS1 RNAi constructs driven by the C. breweri LIS (linalool synthase) promoter constructed essentially as described in Orlova et al. (2006). The promoter was amplified using the forward and reverse primers indicated in Table 1, and the 1038-bp fragment was transferred to pART27 (Gleave, 1992), modified for Gateway cloning (Invitrogen). Two PhIGS1 RNAi constructs were made, one with a fragment from the 5′ end of the gene and another with a fragment from the 3′ end of the gene. These RNAi constructs were made by first amplifying fragments of the PhIGS1 cDNA corresponding to bases 1–210 and bases 725–972 by PCR with the specific primers listed in Table 1 and separately splicing them into the Gateway entry vector pENTR/D-TOPO (Invitrogen). Each fragment was then separately spliced into the destination vector (pART27 with the LIS promoter) in forward and reverse positions flanking the intron. Transgenic petunia plants were obtained via Agrobacterium tumefaciens strain EHA105 carrying a pLISG-PhIGS1 RNAi construct using the standard leaf disk transformation method (Horsch et al., 1985). Rooted plants were screened for the presence of the LIS promoter by PCR with the specific primers indicated in Table 1. The PCR-positive T0 plants were transferred to the greenhouse and analyzed for floral headspace volatiles. The level of silencing in each transgenic plant was measured by qRT-PCR as described above. The T0 transformants were also self-pollinated manually and the T1 seeds were analyzed for segregation by germination on MS medium supplemented with kanamycin (150 mg L−1).
Analysis of volatiles from petunia flowers
Floral volatiles were collected from control and PhIGS1 RNAi flowers, using a closed-loop stripping method under growth-chamber conditions (21°C, 50% relative humidity, 150 μmol m−2 sec−1 light intensity and 12-h photoperiod) as described previously (Orlova et al., 2006). We collected floral headspace from detached P. axillaris parodii flowers (48-h-old) using a push–pull headspace collection system (Hoballah et al., 2005). Five petunia flowers were placed in a 9.0 L glass vessel and the emitted volatiles were collected for 24 h by using a trap containing 125 mg Porapak Q (0.65 × 1.5 cm, 80/100 mesh; Alltech, http://www.alltech.com/) using a vacuum pump at a flow rate of 1.0 L min−1. After headspace collection, the volatiles were eluted from the Porapak Q filter with 3 ml of hexane, concentrated by a mild nitrogen stream, and analyzed by GC–MS (Koeduka et al., 2008). Dihydroconiferyl acetate was extracted from petals using hexane, as previously described (Pichersky et al., 1994). The GC–MS analysis was performed as described in Koeduka et al. (2006) and Orlova et al. (2006).
Acknowledgements
We thank Dr Cris Kuhlemeier (University of Bern, Bern, Switzerland) and Dr Tom Gerats (Radboud University, Nijmegen, Netherlands) for providing seeds of P. axillaris. This work was supported by National Science Foundation grant 0718152 to EP, by National Science Foundation grant 0718064 to JNP, by National Research Initiative of the US Department of Agriculture Cooperative State Research, Education, and Extension Service grant 2005-35318-16207, the National Science Foundation/USDA-NRI Interagency Metabolic Engineering Program grant 0331333 to ND, and by a grant from the Fred Gloeckner Foundation, Inc to ND. TK was supported in part by JSPS Postdoctoral Fellowships for Research Abroad (Japan Society for the Promotion of Science, Japan).


