Genome-wide analysis of Agrobacterium T-DNA integration sites in the Arabidopsis genome generated under non-selective conditions
Summary
Previous work from numerous laboratories has suggested that integration of Agrobacterium tumefaciens T-DNA into the plant genome occurs preferentially in promoter or transcriptionally active regions. However, all of these studies were conducted on plants recovered from selective conditions requiring the expression of transgenes. The conclusions of these studies may therefore have been biased because of the selection of transformants. In this study, we investigated T-DNA integration sites in the Arabidopsis genome by analyzing T-DNA/plant DNA junctions generated under non-selective conditions. We found a relatively high frequency of T-DNA insertions in heterochromatic regions, including centromeres, telomeres and rDNA repeats. These T-DNA insertion regions are disfavored under selective conditions. The frequency with which T-DNA insertions mapped to exon, intron, 5′ upstream and 3′ downstream regions closely resembled their respective proportions in the Arabidopsis genome. Transcriptional profiling indicated that expression levels of T-DNA pre-integration target sites recovered using selective conditions were significantly higher than those of random Arabidopsis sequences, whereas expression levels of genomic sequences targeted by T-DNA under non-selective conditions were similar to those of random Arabidopsis sequences. T-DNA target sites identified using non-selective conditions did not correlate with DNA methylation status, suggesting that T-DNA integration occurs without regard to DNA methylation. Our results indicate that T-DNA integration may occur more randomly than previously indicated, and that selection pressure may shift the recovery of T-DNA insertions into gene-rich or transcriptionally active regions of chromatin.
Introduction
Agrobacterium-mediated transformation is a unique phenomenon of horizontal gene transfer between prokaryotes and eukaryotes that involves the processing of transferred (T)-DNA from the resident A. tumefaciens Ti (tumor-inducing) plasmid and its transfer to plants with the aid of virulence proteins (Gelvin, 2000, 2003). No extensive sequence homology exists between T-DNA and the plant chromosome integration site, although micro-homologies occasionally exist (Gelvin, 2000; Tinland, 1996). T-DNA integration may therefore occur by a process of non-homologous end-joining (Gheysen et al., 1991). T-DNA insertions can occur throughout the plant genome, thus enabling the use of Agrobacterium-mediated transformation as a mutagenic tool for plant genetics (Alonso et al., 2003; Feldmann, 1991).
Several previous reports, however, have suggested that T-DNA integration into the plant genome may not be completely random. Using a promoter trap assay, Koncz et al. (1989) suggested that T-DNA preferentially integrates into transcriptionally active chromatin regions. Analysis of Arabidopsis T-DNA insertion mutant libraries indicated a preference for T-DNA insertion into 5′ gene regulatory regions and A + T-rich regions (Brunaud et al., 2002; Szabados et al., 2002). Furthermore, analysis of >140 000 Arabidopsis T-DNA insertion mutants revealed proportionately fewer T-DNA insertions in centromeric regions than in gene-rich euchromatic regions, suggesting that the density of T-DNA insertion events closely correlates with gene density along each chromosome (Alonso et al., 2003). Recently, an analysis of T-DNA mutants generated in rice also indicated preferential insertion into gene-rich regions, with obvious biases for insertion into 5′ and 3′ regulatory regions (Chen et al., 2003; Sallaud et al., 2004).
Taken together, these studies suggested a preference for T-DNA integration into transcriptionally active regions of the genome. However, this interpretation is derived from analysis of transformation libraries generated using selective conditions. Integration of T-DNA into non-expressed regions of the genome would probably result in plants that would not survive the selection regime (Francis & Spiker, 2005). Recent studies conducted under selection-free conditions showed a higher perceived transformation efficiency, corresponding to a higher frequency of transgene silencing (Dominguez et al., 2002; Francis and Spiker, 2005). Francis and Spiker (2005) suggested that a number of transformation events may result in non-expressing transgenes, which would preclude recovery, and proposed that selection bias can account for the observed non-random pattern of T-DNA integration into the Arabidopsis genome. They used a floral-dip transformation protocol that targets female gametophytic cells, but they investigated the expression of target genes in T2 generation seedlings. Therefore, the question of whether chromatin structure and transcriptional activity of pre-integration target sites affects site selection for T-DNA integration remains unanswered. To address this question, we analyzed T-DNA target sites from transformed Arabidopsis cell cultures propagated without selection. Our results show that T-DNA target sites generated using non-selective conditions were not significantly biased toward any chromosomal or transcriptionally active chromatin region. These results indicate that T-DNA integration occurs more randomly than previously suggested by analysis of junctions isolated from transgenic plants generated using selection.
Results
Agrobacterium-mediated transformation of Arabidopsis suspension cells
To generate material for isolation of T-DNA integration sites, we transformed Arabidopsis suspension cells with A. tumefaciens At849. This strain is non-oncogenic, and contains the binary vector pBISN1 with a plant-active gusA–intron gene in the T-DNA (Narasimhulu et al., 1996). We used Arabidopsis suspension cells for transformation because they are highly transformable (Mathur et al., 1998) and provide a relatively uniform population of cells for further analysis, such as expression profiling and characterization of the chromatin structure of the T-DNA insertion sites. To eliminate selection bias, we cultured transformed cell cultures in the absence of selective antibiotics for 6 weeks. Transformation efficiencies were monitored by checking GUS activity (Figure 1a). Most cells stained blue with X-Gluc 1 week after infection, indicating at least transient transformation, but GUS activity decreased over time. After 6 weeks, only approximately 20% of the cells were GUS-positive, because either stable transformation did not occur or integrated T-DNA became silenced. To test whether T-DNA was stably integrated into the Arabidopsis genome, we isolated DNA from cultures propagated for 6 weeks under non-selective conditions and performed DNA blot analysis using as a probe the gusA gene from the T-DNA. We detected the gusA gene in high-molecular-weight plant DNA from three independent transformations (Figure 1b), and used these samples of genomic DNA as a source of T-DNA/plant DNA junction fragments.
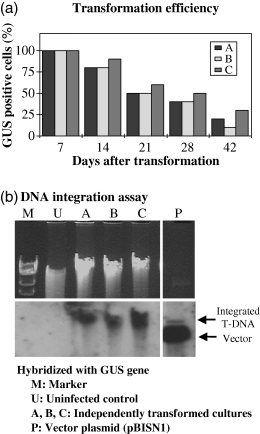
Stable transformation of Arabidopsis suspension cells by Agrobacterium.(a) Cells were transformed by A. tumefaciens At849 for 2 days, then incubated in ACIM medium plus Timentin. After the indicated number of days, samples were taken and stained with X-Gluc. The percentage of cells staining blue are shown for three independent transformations (A, B and C).(b) DNA blot showing integration of T-DNA into high-molecular-weight plant DNA. Top, ethidium bromide stained gel; bottom, DNA blot hybridized with a gusA gene probe. M, molecular size marker (λ digested with HindIII); U, DNA from uninfected cells; A, B and C, DNA from three independent transformations; P, pBISN1 DNA.
Identification of T-DNA insertion sites generated under non-selective conditions
To mitigate any bias in junction recovery that may derive from specific techniques, we isolated T-DNA/plant DNA junction fragments using two different methods, TAIL-PCR and adaptor ligation-mediated PCR. A high-throughput screening approach identified colonies containing T-DNA integration sites (Figure S1). In general, the efficiency of T-DNA/plant DNA recovery was very low, probably because only a low percentage of cells were stably transformed, and each transformed cell presumably integrated T-DNA into a different chromosomal site. We first screened blots with probes encompassing either left or right T-DNA border sequences because T-DNA/plant DNA junction clones rescued using both PCR-based methods should contain some of these sequences. From three independent experiments, approximately 3000 of approximately 40 000 colonies hybridized with one T-DNA border sequence. Pilot sequencing of randomly picked clones revealed a large number of junctions resulting from tandem T-DNA insertions that lacked plant sequences. We eliminated clones containing tandem T-DNA repeats by screening for colonies that hybridized to both border sequences. We also excluded clones containing T-DNA vector backbone sequences from further analysis. DNA sequences from some clones either did not match or had poor homology to sequences in the Arabidopsis genome database (e-values > 10E-10). These clones either had non-T-DNA flanking sequences that were too short to identify their genomic location, or may have contained ‘scrambled’ or ‘filler’ DNA sequences. Such sequences frequently appear at T-DNA/plant DNA junctions (Forsbach et al., 2003; Windels et al., 2003). After excluding these clones, 117 independent T-DNA junction clones containing identified sequences remained (described in Table S2). In addition to these 117 insertions in the Arabidopsis nuclear genome, we found one insertion into sequences corresponding to the chloroplast genome, and two insertions corresponding to sequences in the mitochondrial genome.
We analyzed T-DNA/plant DNA junctions isolated from infected plant cells grown under non-selective conditions for characteristics typical of junctions previously isolated under selective conditions. VirD2 nicks T-DNA between nucleotides 3 and 4 of the 25 bp border repeat sequence (Wang et al., 1987). Thus, when integrated into the plant genome, T-DNA should retain nucleotides 4–25 of the left border, and nucleotides 1–3 of the right border. Truncations within T-DNA often occur. Generally at the right border, deletions within T-DNA are absent or short, most likely because VirD2 protects this region of the T-strand in plant cells (Durrenberger et al., 1989; Tinland et al., 1995). Truncations at the left border are generally larger and more frequent, reflecting the model that, at the 3′ end, T-DNA is unprotected except for VirE2 molecules that may ‘coat’ the T-strand (Rossi et al., 1996). Figure 2 shows that right-border T-DNA truncations in our non-selective library were rare: 35% of the junctions did not result in any deletion of the border, and the deletions that we did detect were relatively short (82% were 10 bp or shorter). Conversely, left-border truncations were frequent and relatively long: 61% of the left-border junctions had truncations of T-DNA ≥ 10 bp, with deletions up to 98 bp. Thus, the T-DNA/plant DNA junctions that we isolated are typical of those previously identified by others when the presence of T-DNA was selected in plants.
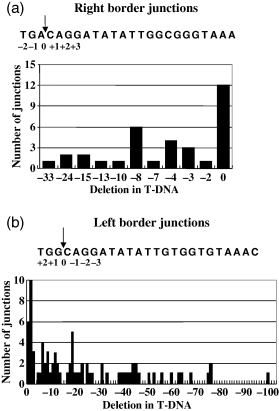
Analysis of T-DNA/plant DNA junctions for T-DNA truncations.T-DNA/plant DNA junctions were analyzed for truncations in the T-DNA region. (a) Sequence analysis of T-DNA right-border regions.(b) Sequence analysis of T-DNA left-border regions. The sequence of the 25 bp T-DNA borders is indicated. Arrows indicate the site of VirD2 cleavage between bases 3 and 4. 0 indicates the precise site of T-DNA cleavage such that no deletion in T-DNA occurs. The numbers on the x axis indicate the number of nucleotides of T-DNA deleted in each T-DNA junction region.
T-DNA insertions are distributed in both heterochromatic and euchromatic regions of the chromosome
T-DNA insertion sites were mapped to the Arabidopsis chromosomes using the MapViewer program of the TAIR database (Figure 3). We compared our ‘non-selected’ junctions to the chromosomal distribution of T-DNA integration sites generated under selective conditions using the T-DNA insertion library published by Szabados et al. (2002). These authors generated T-DNA insertion lines from Arabidopsis suspension cell cultures similar to the ones we used for generating our library. We analyzed the chromosomal distribution of a total of 324 insertions (Table S2) identified from transformed Arabidopsis suspension cells under selective conditions. As described previously (Szabados et al., 2002), T-DNA insertions recovered from selective conditions were relatively rare in centromeric and telomeric regions of chromosomes (as indicated by the black circles in Figure 3). These regions constitute approximately 10% of the Arabidopsis genome, but only approximately 4.6% of the recovered junctions (Table 1). However, we found a higher frequency (approximately 10%) of T-DNA insertions in heterochromatic regions, including centromeric and telomeric repeats, when we analyzed T-DNA/plant DNA junctions isolated under non-selective conditions. Our non-selective library of junctions showed no preference for T-DNA integration into gene-rich regions of the genome, nor any avoidance of insertions in heterochromatic regions of the genome.
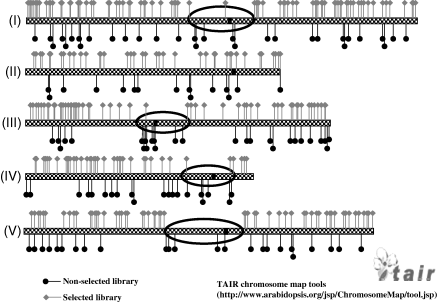
Chromosomal distribution of T-DNA integration sites.Gray bars represent the five Arabidopsis chromosomes. Black and gray flags represent T-DNA integration sites in non-selective and selective libraries, respectively. Areas circled in black indicate centromeric regions where T-DNA insertions are not frequently found under selective conditions.
| Genetic regions | T-DNA insertion frequency [% (n)]a | Distribution in the total genome (%)c | |
|---|---|---|---|
| Non-selective conditions | Selective conditionsb | ||
| Coding regions | 43 (50) | 35.5 (115) | 44.4 |
| Exons | 32.5 (38) | 21.9 (71) | 28.8 |
| Introns | 10.3 (12) | 13.6 (44) | 15.6 |
| Non-coding regions | 57 (67) | 64.5 (209) | 55.6 |
| 5′ upstream (−500 bp) | 9.4 (11) | 19.8 (64) | 11.0 |
| 3′ downstream (+500 bp) | 11.1 (13) | 12.3 (40) | 11.0 |
| Intergenic regions | 27.4 (32) | 27.8 (90) | 23.6 |
| Repetitive sequences | 9.4 (11) | 4.6 (15) | 10.0 |
| All mapped | 100 (117) | 100 (324) | 100 |
- aThe number of sites is given in parentheses.
- bFrequencies of selective T-DNA insertion sites were re-calculated from Szabados et al. (2002).
- c Arabidopsis Genome Initiative (2000).
No specific physical properties of DNA were observed at T-DNA integration sites
We examined several physical properties of DNA, including G + C content, bendability, A-philicity and protein-induced deformability (Liao et al., 2000), at T-DNA target sites recovered from the selective and non-selective conditions, and compared them with randomly chosen Arabidopsis genomic sequences (Figure 4). We observed a higher G + C content (approximately 41%) surrounding T-DNA target sites from the non-selective library compared with the average G + C composition of Arabidopsis DNA (37%) or T-DNA target sites from the selected library (approximately 37%). However, we did not observe any other significant physical properties at T-DNA target sites that differed from random Arabidopsis DNA fragments.
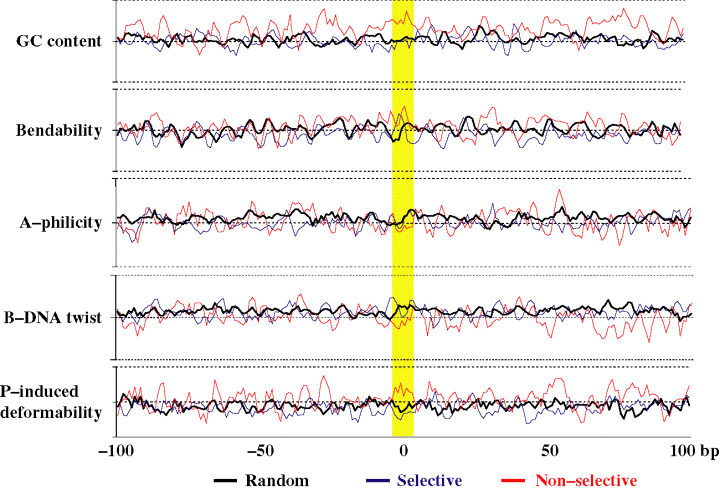
DNA physical properties of T-DNA target sites relative to random Arabidopsis DNA sites.DNA sequences from the non-selective (red) and selective (blue) libraries were analyzed relative to random Arabidopsis DNA sequences (black) within a 100 bp window surrounding the T-DNA target site (yellow box) for DNA physical parameter including G + C composition, bendability, A-philicity and P-induced deformability as described by Liao et al. (2000).
T-DNA insertion sites generated under non-selective conditions are not biased to any particular genomic region
We investigated whether the 117 T-DNA insertion sites generated under non-selective conditions preferentially mapped to any particular genomic region (Table 1). We categorized the Arabidopsis genome into coding and non-coding regions. In our analysis, coding regions are defined as sequences between the start and stop codons, and these regions are further subdivided into exons and introns. Non-coding regions are subdivided into 5′ upstream and 3′ downstream regions of the gene, intergenic regions, and repetitive DNA regions. We defined 5′ upstream and 3′ downstream regions as 500 bp upstream from the start codon and 500 bp downstream from the stop codon, respectively. Repetitive DNA sequences include telomeric and centromeric repeats, large ribosomal DNA repeats and 5S rDNA repeats. We compared the frequency of T-DNA insertions generated under non-selective conditions in each region to the respective proportion of the Arabidopsis genome represented by each category, and additionally compared them to the frequency of T-DNA insertions in these regions generated under selective conditions. The distribution of T-DNA insertions generated under non-selective conditions more closely resembled the respective proportions of the Arabidopsis genome than did that recovered under selective conditions. For example, we did not observe a bias of T-DNA insertions in regulatory regions in our non-selective library; T-DNA insertions from the selective library are significantly favored in these regions (Table 1 and Szabados et al., 2002). Also, about 10% of the T-DNA insertions from the non-selective library mapped to repeated DNA regions, a number close to the proportion of highly repetitive sequences in the Arabidopsis genome (Arabidopsis Genome Initiative, 2000). However, only a small percentage (4.6%) of T-DNA insertions mapped to this category of sequences in the selective library.
It was difficult to isolate T-DNA/plant DNA junctions from cell cultures generated under non-selective conditions because, unlike the situation with plants grown under selective conditions in which every plant cell contains the same junction (Alonso et al., 2003; Brunaud et al., 2002; Chen et al., 2003; Sallaud et al., 2004; Szabados et al., 2002), only a low percentage of our cell population contained an integrated T-DNA molecule, and each cell contained a different junction sequence. Because we obtained a relatively small number of T-DNA/plant DNA junctions, we evaluated the statistical significance of our data using an in silico analysis. We compared T-DNA insertion sites from the selective library of Szabados et al. (2002) and our non-selective library with 1000 randomly generated in silico libraries. To assess whether our in silico libraries accurately reflected the Arabidopsis genome, we compared the frequency with which the in silico libraries mapped to each of the annotated genetic regions. For example, approximately 29% of the Arabidopsis genome is made up of exons. Figure 5 shows that the frequency of hits from the in silico libraries mapping to exons showed a normal distribution around 29%, indicating that these libraries faithfully represent the Arabidopsis genome. We next used an anova analysis to compare the T-DNA insertion libraries generated under selective and non-selective conditions with the random in silico libraries. T-DNA insertions from our non-selective library were not significantly biased toward any of four genomic regions analyzed (P < 0.05), whereas the selective T-DNA insertion library was significantly enriched in 5′ upstream region insertions (P < 0.001).
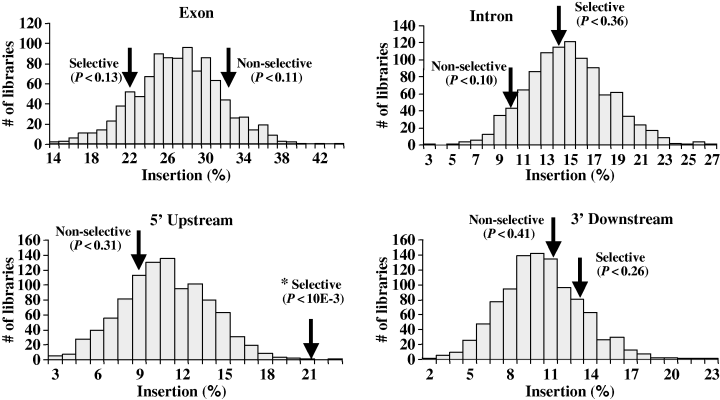
Comparison of T-DNA target sites generated under non-selective and selective conditions relative to random in silico libraries.The frequency of T-DNA insertions mapping to exons, introns, 5′ upstream and 3′ downstream regions (arrows) were compared to 1000 random in silico libraries, which showed a normal distribution. The asterisk indicates a significant difference (P < 0.01) between T-DNA integration sites and random libraries.
T-DNA integration occurs at random but selection pressure may shift the recovery of T-DNA integration sites into transcriptionally active regions of the genome
We used various micro- and macro-arrays to investigate the transcriptional activity of T-DNA insertion sites prior to integration. An initial analysis using Affymetrix GeneChip arrays (Arabidopsis ATH1) indicated that the relative level of expression of T-DNA target sites isolated from the non-selective library was similar to that of all Arabidopsis genes, whereas the expression of targets identified in the selective library was higher than that of the average Arabidopsis gene (Table S3). However, many T-DNA target sites identified in the non-selective library are not in or near genes represented on the ATH1 GeneChip. We therefore constructed a DNA array containing genomic DNA fragments surrounding T-DNA integration sites from non-selective and selective conditions. The DNA array also includes 184 clones containing randomly sheared Arabidopsis genomic DNA fragments.
We hybridized this DNA array with cDNA probes generated from total Arabidopsis suspension cell RNA using an oligo(dT) primer (Figure 6) or random primers (Figure S2). Results using both of these probes indicated that T-DNA target sites in the selective library are transcriptionally more active than are those in the non-selective library or the random Arabidopsis library (Table S4). Figure 6 shows that T-DNA target sites from the selective library were enriched in more highly expressed regions of the genome compared to T-DNA target sites from the non-selective and random Arabidopsis libraries. Approximately 26% of the fragments from the random Arabidopsis library were expressed, with a range of expression levels from 90 to 1678 arbitrary units. The average and median expression levels of the random Arabidopsis library are 248 and 140 U, respectively. T-DNA integration sites from the non-selective library showed a similar pattern of expression. About 19% of the fragments were expressed, with a range of expression levels from 96 to 1695 U. The average and median expression levels were 211 and 156 U, respectively. However, approximately 40% of the fragments from the selective library were expressed, with a range of 90–4821 U. The average and median expression levels of this library were 347 and 189 U, respectively. Statistical analysis using the Mann–Whitney test indicated that expression levels from the selective library were significantly different from those of the Arabidopsis random library (P < 0.001), whereas expression levels from the non-selective library were similar to those of the Arabidopsis random library (P = 0.23).
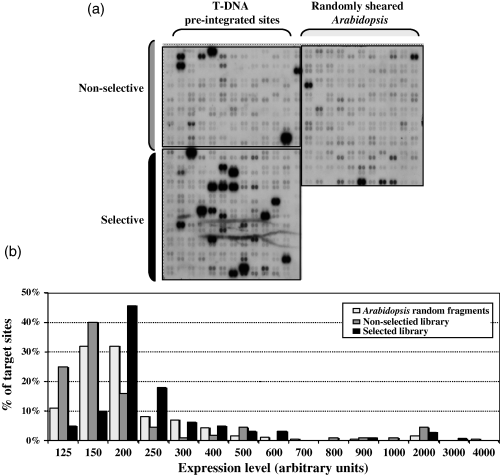
Expression profiling of T-DNA integration sites.(a) A DNA array containing cloned fragments from the non-selective library (upper left quadrant), the selective library (lower left quadrant), and randomly sheared Arabidopsis DNA (upper right quadrant) was hybridized with a cDNA probe generated from suspension cell RNA using an oligo(dT) primer. The unboxed region in the lower right quadrant is empty.(b) Graphical representation of the expression levels of the cloned fragments.
cDNA probes generated using oligo(dT) or random primers represent steady-state levels of RNA. To determine which T-DNA target sites were actually transcribed, we conducted a nuclear run-on transcription assay and utilized the resulting radiolabeled RNA as a hybridization probe to the same series of blots described above. In general, the results of the nuclear run-on transcription experiment were similar to those using cDNA probes. T-DNA target sites recovered in the selective library were transcribed to a greater extent than were random Arabidopsis DNA fragments, whereas T-DNA target sites from the non-selective library showed a transcription level similar to that of the random Arabidopsis fragment library (Figure S3).
To validate the DNA array results, we used RT-PCR with primers specific for four each of high-, medium- and low-expression clones (Figure 7). Expression levels determined using DNA arrays and RT-PCR correlated well.
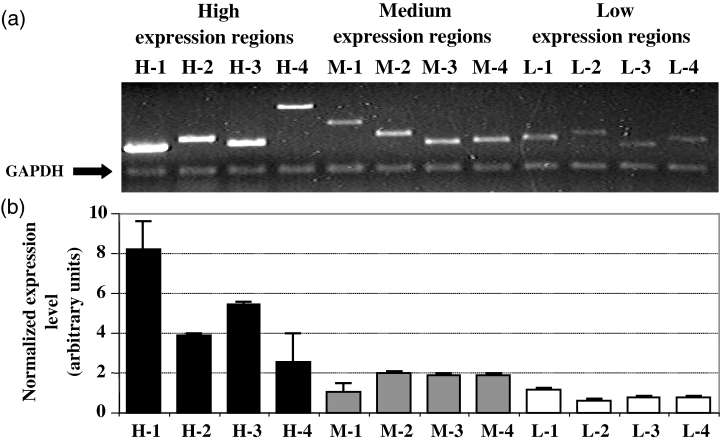
RT-PCR verification of DNA macroarray hybridization results.RNA corresponding to four clones each of high-, medium- and low-expressing sequences (as determined by DNA array analysis) was analyzed by semi-quantitative RT-PCR, using primers corresponding to a GAPDH gene as an internal control.(a) Ethidium bromide-stained gel of RT-PCR products.(b) Graphical representation of expression levels of the T-DNA target sites, normalized to GAPDH transcript levels.
T-DNA integration occurs regardless of the DNA methylation status of target sites
The extent of DNA methylation may affect T-DNA integration because methylation can either modify, or be a result of, altered chromatin conformation (see, for example, Gendrel et al., 2002). DNA methylation can also reflect the transcriptional status of plant genes (Zhang et al., 2006; Zilberman et al., 2007). We analyzed the extent of DNA methylation at T-DNA target sites by hybridization of McrBC-treated and untreated DNA samples to the DNA arrays. If highly methylated, genomic sequences are digested by McrBC treatment and hybridize with less intensity to the arrays than would unmethylated or under-methylated samples. Comparison of the methylation status of T-DNA target sites generated under non-selective conditions with random Arabidopsis DNA fragments indicated that there was no significant correlation between DNA methylation status and T-DNA target sites (Mann–Whitney test, P = 0.09). However, in the selective library, T-DNA pre-integration target sites were preferentially under-methylated (P < 0.001; Table S4). These results suggest that T-DNA integration may occur without regard to the methylation status of the pre-integration target sites. The methylation profiling results obtained using DNA arrays were validated using a PCR-based method (Figure S4).
For each sequence on the DNA array, we sorted the corresponding clones according to their extent of hybridization with cDNA made to total cellular RNA (Figure 8, top row of three panels). With a few exceptions, the level of expression of these clones, as detected by the total cellular RNA probe, correlated with the level of expression detected using probes representing poly(A)+ RNA and nuclear run-on transcripts (Figure 8, second and third rows of panels). T-DNA target sites identified under selective conditions were on average more highly expressed than were T-DNA target sites identified under non-selective conditions and random Arabidopsis sequences. A few DNA sequences that yielded a high hybridization signal using cDNA probes did not appear to be highly transcriptionally active using nuclear run-on transcripts as probes. In particular, DNA sequences representing 5S rRNA and gypsy-like retrotransposons were not highly transcribed as determined by nuclear run-on experiments; however, their transcripts were stable and accumulated to a relatively high extent. In contrast, DNA sequences encoding some transcription factors showed high transcriptional activity in nuclear run-on transcription experiments but did not accumulate to a significant extent, suggesting that these transcripts may be unstable. Interestingly, we did not observe any correlation between the levels of transcription (using nuclear run-on transcription analyses) or the accumulation of transcripts, and the extent of DNA methylation (compare the top three rows of panels in Figure 8 with the bottom row of panels; see also Figure S5).
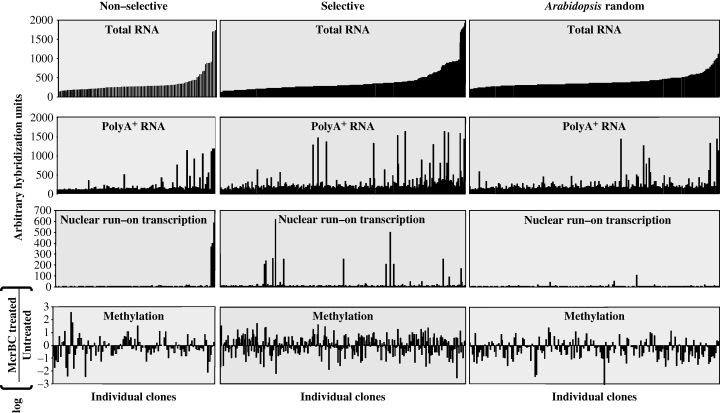
Expression and DNA methylation profiling of the DNA array analysis, sorted by total RNA expression.The expression levels of total RNA, poly(A)+ RNA and nuclear run-on transcripts are represented by arbitrary units based on hybridization intensity with the respective probes. The DNA methylation status is represented by the logarithmic ratio between the hybridization intensity of McrBC-treated and untreated samples. Positive values represent unmethylated sequences, and negative values represent highly methylated DNA sequences.
Discussion
We identified 117 T-DNA insertion sites from Arabidopsis suspension cells transformed by Agrobacterium and propagated under non-selective conditions. Compared to libraries of T-DNA/plant DNA junctions identified from cells that had been selected for expression of transgenes, we observed a relatively high frequency of T-DNA integration into heterochromatic regions, including centromeres and telomeres. The percentage of T-DNA insertions recovered in the non-selective library that mapped to highly repetitive DNA regions was similar to the percentage of the Arabidopsis genome corresponding to these regions, and was more than twice that recovered in the selective library of Szabados et al. (2002). Our results indicate that T-DNA insertions in heterochromatic regions are under-represented when selective conditions are used for the recovery of transformants.
In order to achieve a high percentage of transformed cells (and thus maximize our chances of isolating T-DNA/plant DNA junctions), we utilized Arabidopsis cell suspensions. We, and others, have shown that cell suspensions from several plant species are highly susceptible to Agrobacterium-mediated transformation (Ditt et al., 2001, 2006; Narasimhulu et al., 1996; Veena et al., 2003). Transcriptional activity of many genes may differ between cell suspensions and intact plant tissues (http://www.weigelworld.org/resources/microarray/AtGenExpress/). However, it is likely that chromatin conformation at heterochromatic regions is similar among various cell types. Szabados et al. (2002) utilized both Arabidopsis cell suspensions and roots as targets for generating selective T-DNA insertion libraries. Their data analyses did not indicate differences in T-DNA insertion patterns between these cell and tissue types. Thus, our results, using suspension culture cells for non-selective T-DNA integration studies, should apply to transformation of other plant tissues.
Our protocol for generating T-DNA/plant DNA junctions in Arabidopsis suspension cultures, using non-selective conditions, allowed us to recover considerably more junction sequences that did the protocols of others using plant tissues or whole plants as the transformation target (Dominguez et al., 2002; Francis and Spiker, 2005). The use of suspension cell cultures will allow us to conduct further experiments to investigate chromatin structure at T-DNA pre-integration target sites in a system that, compared to plant tissues or female gametophytic tissue, is relatively more uniform and easier to manipulate. Our system does, however, have one major disadvantage: Because transformed cells were not regenerated into plants, we were unable to determine whether specific integration events would eventually have resulted in transgene expression. In this regard, our experiments complement those of Dominguez et al. (2002) and Francis and Spiker (2005). Their studies investigated transgene expression post-integration, whereas our study investigated various characteristics of pre-integration target sites.
Previous studies have indicated that T-DNA integration sites are over-represented in promoter regions; this tendency may reflect the A + T richness of these regions (Brunaud et al., 2002; Szabados et al., 2002). Re-examination of the selective library data of Szabados et al. (2002) confirmed their finding of a promoter bias for integration. However, a similar analysis of the data from our non-selective library did not reveal a preference for T-DNA integration into any particular genomic region. In fact, the distribution of T-DNA insertions in the non-selective library closely resembled the respective proportions of these elements in the Arabidopsis genome. In addition, we did not observe significant A + T richness in T-DNA target sites represented in the non-selective library; rather, we observed a G + C content that was higher (approximately 41%) than that of the Arabidopsis genome (37%).
The conclusions of previous studies investigating transcription of T-DNA pre-integration target sites using Affymetrix microarrays were conflicting. Alonso et al. (2003) did not observe any significant correlation between the level of gene expression and the frequency of T-DNA integration. However, Schneeberger et al. (2005) concluded that the T-DNA insertion frequency in 5′ upstream regions positively correlated with gene activity. Both Alonso et al. (2003) and Schneeberger et al. (2005) utilized data derived from whole plants rather than the exact cell types infected by Agrobacterium. In addition, commercial Affymetrix ATH1 chips only represent most ORF regions of the genome and do not contain probes corresponding to intergenic regions where we identified a large proportion of T-DNA insertions. In this study, we generated a custom-made DNA array containing genomic fragments surrounding T-DNA integration sites. This DNA array enabled us to investigate RNA expression based solely on chromosome sites and not on predicted ‘genes’. Our expression profiling results indicated that, on average, T-DNA integration sites from a selective library are more transcriptionally active than are randomly chosen Arabidopsis genomic sequences, whereas T-DNA integration sites from the non-selective library showed transcriptional activity similar to that of random Arabidopsis regions. These results suggest that T-DNA integration may occur more randomly than previously indicated, and that selection pressure may shift the recovery of T-DNA insertions into gene-rich or transcriptionally active regions of chromatin.
Transgenic studies suggested a close relationship between transgene silencing, chromatin conformation and DNA methylation (Butaye et al., 2004; Vaucheret and Fagard, 2001), although another report has suggested that DNA repeats and methylation status are not sufficient to induce transgene silencing (Lechtenberg et al., 2003). In this study, we investigated the DNA methylation status of T-DNA target sites prior to T-DNA integration. T-DNA target sites generated under non-selective conditions were not preferentially either hypo- or hyper-methylated. However, T-DNA target sites from the selective library were preferentially hypo-methylated. The results from analysis of our non-selective library suggest that DNA methylation status does not significantly affect T-DNA integration. Interestingly, our results also indicate that DNA methylation status does not necessarily correlate with transcriptional activity (Figure 8 and Figure S5). These results are in accordance with those of Zhang et al. (2006) and Zilberman et al. (2007). Using whole-genome tiling arrays, these authors showed substantial CG methylation in the ‘body’ but not the promoter region of many highly expressed and constitutively active Arabidopsis genes. However, highly regulated genes also showed promoter region methylation.
The mechanisms and characteristics of transposable element and retrovirus integration have been intensively studied (reviewed by Craig, 1997; Bushman, 2003; Wu and Burgess, 2004). In several virus and transposable element systems, insertion is not random. Their preferences may be highly specific for particular DNA sequences or structures (Craig, 1997; Liao et al., 2000). Some transposable elements and viruses may target specific regions of the genome (Chalker and Sandmeyer, 1992; Devine and Boeke, 1996; Schroder et al., 2002; Zou and Voytas, 1997). However, some viruses, such as avian sarcoma virus, do not show any preference for integration into specific genetic structures or transcribed regions (Narezkine et al., 2004). Interaction between a pre-integration complex and host cellular factors may result in target site selection for viruses and transposons. Such interactions have been demonstrated for the yeast transposon Ty3, which preferentially integrates upstream of tRNAs and other polymerase III-transcribed genes because of interaction between the Ty3 pre-integration complex (PIC) and the polymerase III transcription factor TFIIIB/TFIIIC (Kirchner et al., 1995). In contrast, targeting of Ty5 into transcriptionally silent regions of the genome is mediated by binding of the Ty integrase to the transcriptional silencing protein Sir4p, which binds DNA in silent regions (Xie et al., 2001; Zhu et al., 1999). Retrovirus integrase protein may associate with a number of cellular proteins that may function as regulators of chromatin structure and transcription (Cereseto and Giacca, 2004). These data suggest that target site selection might be influenced by chromatin proteins that interact with the integrase complex. It is not yet clear which bacterial and/or plant factors mediate the integration of T-DNA. Protein components of the T-complex, VirD2 and VirE2, may play important roles in T-DNA integration (Mysore et al., 1998). Bako et al. (2003) showed that VirD2 is found in tight association with a TATA box-binding protein in nuclei of alfalfa cells. Loyter et al. (2005) recently demonstrated interaction between the Arabidopsis VIP1 protein, which associates with T-complexes by binding to VirE2, a T-complex component, and histone H2A. Interestingly, an Arabidopsis histone H2A (HTA1) mutant, rat5, is especially deficient at the T-DNA integration step, which suggests an important role for H2A in T-DNA integration (Mysore et al., 2000). Histone H2A is a component of nucleosomes and is present everywhere in the chromosomes. If the integration of incoming T-DNA and plant chromosomes occurs through a histone H2A-mediated interaction, this might explain the randomness of T-DNA insertion in the plant genome.
Our results indicate that T-DNA integration may occur more randomly than previously indicated, and that selection pressure might shift the recovery of T-DNA insertions into gene-rich or transcriptionally active regions of chromatin. Our study suggests that much of the work on T-DNA insertion site preference in the literature is based upon biased assumptions, and that their conclusions need to be validated and refined. For practical purposes, the selection bias may not have a significant effect on the outcome of experiments designed to ‘tag’ genes; rather, the perceived preference for T-DNA insertion in promoters and transcriptionally active regions can be an advantage for mutagenesis studies. The results of our work provide new information necessary for elaborating the mechanism of T-DNA integration into the genome, and the possible role that chromatin structure plays in the process.
Experimental procedures
Transformation of Arabidopsis suspension cell cultures
Arabidopsis suspension cell cultures (donated by Kimeragen, Inc.) were initiated from roots of Arabidopsis thaliana (ecotype Col-0) and maintained in ACIM medium (MS medium containing 2% sucrose, B5 vitamins and 0.2 μg ml−1 2,4-dichlorophenoxyacetic acid). Agrobacterium-mediated transformation was performed with A. tumefaciens At849 (A. tumefaciens GV3101 containing the binary vector pBISN1; Narasimhulu et al., 1996) as described previously (Veena et al., 2003). Transformed cell cultures were further cultivated in the absence of selection for 6 weeks by transferring every week into fresh ACIM medium containing Timentin (100 μg ml−1; GlaxoSmithKline, http://www.timentin.com). Transformation efficiency was determined by scoring the percentage of GUS-positive cells after staining with X-Gluc staining solution [50 mm sodium phosphate buffer, pH 7.0, 0.1% Tween-20, 3% sucrose and 1 mm 5-bromo-4-chloro-3-indolyl-β-d-glucuronic acid (X-Gluc)] overnight at 37°C. Arabidopsis genomic DNA was isolated from transformed cell cultures after 6 weeks according to the method described by Dellaporta et al. (1983). For T-DNA integration assays, 5 μg undigested genomic DNA was separated by electrophoresis through 0.7% agarose gels and blotted onto Hybond N+ membranes (Amersham; http://www5.amershambiosciences.com/). Hybridization was performed using a 32P-dCTP-labeled gusA gene as described previously (Church and Gilbert, 1984). After hybridization, the blots were washed twice with 2× SSC/0.1% w/v SDS and once with 1× SSC/0.1% (w/v) SDS for 15 min each at 65°C.
High-throughput screening and cloning of T-DNA/plant DNA junctions
The scheme for high-throughput screening for T-DNA insertion sites is described in Figure S1. Thermal asymmetric interlaced (TAIL) PCR was performed as described previously (Liu et al., 1995). Adaptor ligation-mediated PCR was performed using a Genome Walker kit (Clontech; http://www.clontech.com/) according to the manufacturer’s instructions (Siebert et al., 1995). Sequences of nested primers complementary to T-DNA left- and right-border sequences and degenerate primers are listed in Table S5. The amplified products were cloned into TA cloning vector pCR®2.1-TOPO (Invitrogen; http://www.invitrogen.com/), and subsequently transformed into electro-competent Escherichia coli DH10B (Gibco-BRL, http://www.gibcobrl.com). A total of 40 000 white colonies grown on Luria–Bertani agar (10 g l−1 tryptone, 5 g l−1 yeast extract, 10 g l−1 NaCl and 15 g l−1 Bacto agar (Difco)) containing 100 μg ml−1 ampicillin and 40 μg ml−1 5-bromo-4-chloro-3-indolyl-β-d-galactopyranoside (X-gal) were printed on filter membranes (Amersham). Hybridization was performed using T-DNA regions encompassing the border repeat sequences as described above. Selected clones were sequenced using M13 primers at the Purdue University DNA Sequencing Facility; sequence homologies were determined by comparison to databases using blast on the NCBI, GenBank and TAIR databases (blastn: E-value < 1E-10).
In silicoanalysis
We generated 1000 in silico libraries according to the method described by Crawford et al. (2004) with slight modification. In brief, sequences of all five Arabidopsis chromosomes (sequence accessions NC_003070, NC_003071, NC_003074, NC_003075 and NC_003076) were concatenated into a single sequence (REFSEQ). Using PERL, we generated random positions between 1 and 115 409 949 (the number of nucleotides in the sequenced Arabidopsis genome). If the computer picked a position within a sequencing gap, a new number was picked. Each library contained 117 random positions. We determined the genomic positions (exon, intron, upstream and downstream) of each sequence coordinate from selective and non-selective T-DNA insertion libraries and the random in silico libraries by alignment to the Arabidopsis annotated REFSEQ using PERL. The frequencies with which random libraries mapped to each genomic region were used to assign probability scores to compare the distribution of the frequency of the T-DNA insertion sites.
Transcriptional profiling using Affymetrix microarrays
Total RNA was extracted using Trizol reagent (Invitrogen) from Arabidopsis suspension cell cultures according to the manufacturer’s instructions. Probes were prepared from the RNA samples and hybridized to the Affymetrix Arabidopsis ATH1 Gene Chip (http://www.affymetrix.com) according the procedures provided by the manufacturer. Expression level (arbitrary units) and P values were calculated using the GCOS (GeneChip Operating Software) package. The experiment was repeated using independent cell cultures. The transcriptional level of T-DNA pre-integration sites was analyzed when T-DNA integrated into genes represented on the microarray chip, and was correlated with the expression level of the closest target genes when the T-DNA insertions were found in gene regulatory regions (500 bp upstream and downstream from ATG and stop codons, respectively).
Construction of DNA arrays
We designed PCR primer pairs with similar Tm (melting temperature) approximately 500 bp upstream and downstream from T-DNA insertion sites, and amplified genomic fragments using genomic DNA isolated from wild-type Arabidopsis suspension cells as a template. Amplified DNAs were verified by digestion with the appropriate restriction endonucleases. We amplified 102 T-DNA target sites from the non-selective library (Table S1) and 284 T-DNA target sites from the selective library (Table S2). We randomly fragmented Arabidopsis DNA by sonication, eluted approximately 1 kbp fragments by agarose gel electrophoresis, filled in fragment ends using the Klenow fragment of DNA polymerase (Promega; http://www.promega.com/) and dNTPs, and cloned the fragments into pGEM-T easy (Promega). We sequenced 168 random Arabidopsis fragments from this library (Table S6). We spotted 0.4 μg of plasmid DNA from each library onto membrane filters (Amersham) after denaturing in 0.4 m NaOH, 10 mm EDTA.
Transcriptional profiling using DNA arrays
cDNA probes were prepared from 5 μg of total RNA isolated from 7-day-old Arabidopsis suspension cells by first-strand cDNA synthesis in a 20 μl reaction mixture containing 0.75 mm each ATP, GTP and TTP, 250 μCi 32P-dCTP, SuperScript II reverse transcriptase (Invitrogen) and 20 μm oligo(dT) or random primers. Hybridization was conduced as described above. Exposed X-ray films were scanned and the hybridization signal was quantified using a UVP bio-imaging system (UVP Inc., http://www.uvp.com). Nuclear isolation and run-on transcription assays were performed as described previously (Gaudino and Pikaard, 1997) with slight modification. Briefly, 105 nuclei were pre-incubated with RNase inhibitor (Promega) at 30°C for 10 min. A transcription assay cocktail [20 μl of 5× transcription buffer (Invitrogen), 5 μl each of CTP, GTP and ATP, 10 μl water, 10 μl 32P-UTP (100 μCi) and 10% w/v glycerol] was added, and the mixture was incubated for 1 h at 30°C. The reaction was terminated by addition of RNase-free DNase I (Promega, 30°C for 10 min), and extracted with phenol:chloroform (1:1). RNA was precipitated from the aqueous phase with two volumes of ethanol for 10 min at −80°C, dried, and hybridized to the DNA array as described above. Each experiment was performed with two biological replicates.
DNA methylation profiling
The DNA methylation status of T-DNA target sites was determined using a DNA array as described by Lippman et al. (2005) with slight modification. Arabidopsis genomic DNA was fragmented by sonication to a uniform size (3 kbp) and then divided into two equal samples, one of which was digested with the methylation-dependent restriction enzyme McrBC. McrBC cleaves DNA containing methylcytosine within the sequence (A/G)mC on one or both strands but does not act upon unmethylated DNA. McrBC-treated and untreated DNA samples were size-fractionated by electrophoresis through agarose gels, and fragments >1 kbp were recovered. These DNA samples were labeled with 32P-dCTP using a Ready-to-Go DNA labeling kit (Amersham), and hybridized to the DNA array blots as described above. The ratios of hybridization signal intensity from McrBC-treated and untreated hybridization experiments were used to determine the relative levels of cytosine methylation.
PCR validation of the DNA array results
The results of the DNA array hybridization experiments were confirmed using PCR. RT-PCR was performed to validate the transcriptional profiling experiments. Reverse transcription was conducted on 5 μg total RNA using Superscript II reverse transcriptase (Invitrogen) and oligo(dT) primer. The primer sequences for RT-PCR are listed in Table S7. PCR reactions were performed using ExTaq polymerase (Takara, http://www.takara-bio.com) as follows: 95°C for 5 min, 25 cycles of 95°C for 40 sec, 56°C for 40 sec and 72°C for 1 min, then 72°C for 5 min. Arabidopsis GAPDH-specific primers were used as a control to normalize the concentration of cDNA in the samples. Validation of the DNA methylation profiling experiments is described in Figure S4.
Acknowledgements
The authors thank Dr Lazslo Szabados (University of Szeged) for kindly providing detailed information about T-DNA integration sites in his library, Dr Guochun Liao (Purdue University) for providing the program for analysis of DNA physical properties, and Young-il Chang (Purdue University) for help in generating PERL scripts for genome-wide analysis. This work was funded by a grant from the NSF (National Science Foundation) plant genome program (99–75715) and a P30 grant to the Purdue Cancer Center.


