Within-canopy variation in the rate of development of photosynthetic capacity is proportional to integrated quantum flux density in temperate deciduous trees
ABSTRACT
The present study was undertaken to test for the hypothesis that the rate of development in the capacity for photosynthetic electron transport per unit area (Jmax;A), and maximum carboxylase activity of Rubisco (Vcmax;A) is proportional to average integrated daily quantum flux density (Qint) in a mixed deciduous forest dominated by the shade-intolerant species Populus tremula L., and the shade-tolerant species Tilia cordata Mill. We distinguished between the age-dependent changes in net assimilation rates due to modifications in leaf dry mass per unit area (MA), foliar nitrogen content per unit dry mass (NM), and fractional partitioning of foliar nitrogen in the proteins of photosynthetic electron transport (FB), Rubisco (FR) and in light-harvesting chlorophyll-protein complexes (Vcmax;A ∝ MANMFR; Jmax;A ∝ MANMFB). In both species, increases in Jmax;A and Vcmax;A during leaf development were primarily determined by nitrogen allocation to growing leaves, increases in leaf nitrogen partitioning in photosynthetic machinery, and increases in MA. Canopy differences in the rate of development of leaf photosynthetic capacity were mainly controlled by the rate of change in MA. There was only small within-canopy variation in the initial rate of biomass accumulation per unit Qint (slope of MA versus leaf age relationship per unit Qint), suggesting that canopy differences in the rate of development of Jmax;A and Vcmax;A are directly proportional to Qint. Nevertheless, MA, nitrogen, Jmax;A and Vcmax;A of mature leaves were not proportional to Qint because of a finite MA in leaves immediately after bud-burst (light-independent component of MA). MA, leaf chlorophyll contents and chlorophyll : N ratio of mature leaves were best correlated with the integrated average quantum flux density during leaf development, suggesting that foliar photosynthetic apparatus, once developed, is not affected by day-to-day fluctuations in Qint. However, for the upper canopy leaves of P. tremula and for the entire canopy of T. cordata, there was a continuous decline in N contents per unit dry mass in mature non-senescent leaves on the order of 15–20% for a change of leaf age from 40 to 120 d, possibly manifesting nitrogen reallocation to bud formation. The decline in N contents led to similar decreases in leaf photosynthetic capacity and foliar chlorophyll contents. These data demonstrate that light-dependent variation in the rate of developmental changes in MA determines canopy differences in photosynthetic capacity, whereas foliar photosynthetic apparatus is essentially constant in fully developed leaves.
INTRODUCTION
Light-saturated leaf photosynthetic rates scale positively with average integrated quantum flux density (Qint; definition of all symbols is provided in the Appendix) in plant canopies (e.g. Niinemets & Tenhunen 1997; Le Roux et al. 2001; Meir et al. 2002), increasing the whole canopy photosynthetic productivity for a given total nitrogen and biomass investment in foliage. Although the positive relations between photosynthetic capacity and Qint are invariably found in experimental studies, there is an ongoing debate of whether the observed acclimation patterns lead to an optimal partitioning of plant resources (Badeck 1995; Hollinger 1996; Meir et al. 2002). For a theoretically optimal distribution of nitrogen and photosynthetic biomass, leaf photosynthetic capacity should vary in direct proportion with Qint (Field 1983; Farquhar 1989; Sands 1995). Existence of such a ‘full acclimation’ pattern in canopy photosynthesis profiles would allow one to use big leaf models to predict canopy photosynthesis (e.g. Amthor 1994), thereby significantly simplifying determination of canopy photosynthetic productivity for varying canopy nitrogen contents and above-canopy quantum flux densities.
The ‘full acclimation’ hypothesis requires that the photosynthetic capacity versus Qint relationship is linear and passes through the origin, but experimental studies demonstrate that both of these criteria are generally violated such that there is no direct proportionality between integrated quantum flux density and maximum assimilation rate (Badeck 1995; Hollinger 1996; Niinemets & Tenhunen 1997; Meir et al. 2002). Analysing the partial determinants of foliage photosynthetic capacity variation in tree canopies, Meir et al. (2002) concluded that the lack of proportionality between Qint and acclimation in photosynthetic capacity is primarily because the leaves have a minimum leaf dry mass per unit area (MA) and nitrogen content such that mature leaves always possess a certain photosynthetic activity. Currently, it is not fully understood what determines species minimum MA and leaf photosynthesis, and how variable are these important canopy photosynthesis characteristics in time.
A central, but not fully appreciated aspect of acclimation is the pertinent time-scale for the alterations in leaf structure and function. There is a large intra- and interspecific variability in changes in foliar photosynthetic capacity during leaf development between different canopy layers (Reich, Walters & Ellsworth 1991; Hamerlynck & Knapp 1996; Wilson, Baldocchi & Hanson 2000), but the timing and controls of these canopy differences are still poorly understood. Although the leaf primordia may be already differentiated in the bud (Hansen 1959; Eschrich, Burchardt & Essiamah 1989; Uemura et al. 2000), light conditions during bud-burst and leaf development may strongly modify the structure and physiology of mature leaves (Hansen 1959; Goulet & Bellefleur 1986; Kimura et al. 1998; Uemura et al. 2000). Furthermore, the initial canopy differences in leaf structure and physiology are considerably less than the final differences after leaf maturation (DeJong & Doyle 1985; Labrecque et al. 1989; Kimura et al. 1998). This experimental evidence (DeJong & Doyle 1985; Labrecque et al. 1989; Kimura et al. 1998; Uemura et al. 2000) jointly suggests that the rate of leaf development is significantly higher in the upper canopy, implying that the canopy gradient in photosynthetic capacity forming during leaf maturation may be proportional to intercepted light. Thus, the optimality concept may hold for MA and photosynthetic capacity changes in developing leaves, even though there is no ‘full acclimation’ of mature leaves. Increases in leaf photosynthetic capacity during leaf development are associated with increases in MA (Reich et al. 1991; Wilson et al. 2000; Frak et al. 2001), decreases in foliar nitrogen contents per unit dry mass (Reich et al. 1991), and increases in nitrogen partitioning in photosynthetic proteins (Makino, Mae & Ohira 1984; Wilson et al. 2000), but the relative importance of these determinants of temporal variation in leaf photosynthetic capacity has not been characterized.
A further relevant feature of acclimation is the stability of foliar structure and photosynthesis profiles in the fully developed canopy. Mature leaves acclimated to a certain integrated quantum flux density during their growth may re-acclimate to a new light environment after being shaded (Frak et al. 2001) or when a gap has formed in the overstorey (Naidu & DeLucia 1997; Frak et al. 2001). Furthermore, there is a large day-to-day variability as well as gradual seasonal changes in above-canopy Qint. The implications of potential environmental modifications on foliage net assimilation rates have been investigated by theoretical models (Kull & Kruijt 1999). Although such hypothetical changes in foliar functioning are of paramount significance for parameterization of ecosystem-level flux models, the kinetic constants of acclimation of fully mature leaves have rarely been investigated in the field (Naidu & DeLucia 1997; Frak et al. 2001; Niinemets et al. 2003).
We studied variation in MA, nitrogen and chlorophyll contents, nitrogen partitioning in the components of the photosynthetic machinery, and photosynthetic capacity from bud-burst till leaf senescence in canopies of northern temperate shade-intolerant early successional Populus tremula L., and shade-tolerant late-successional Tilia cordata Mill. The primary task of our study (1) was to determine whether the rate of leaf morphological and photosynthetic development varies within the canopy. After establishing important canopy differences in the rate of leaf development, we further asked (2) whether differences in leaf photosynthetic capacity development are proportional to Qint, and (3) whether these differences primarily result from the variation in the rate of physiological development that affects the photosynthetic capacity per unit dry mass, or from the rate of development of MA that alters the content of photosynthetic biomass per unit leaf area. Finally, we asked (4) how stable are foliar structure, chemistry and physiology versus Qint relations during the season. Although there is a wide consensus that foliar photosynthetic characteristics are modified by canopy gradients in Qint, this analysis separates the dynamics of leaf development from absolute values of leaf structure and physiological capacity at a certain point during the growing season.
MATERIALS AND METHODS
Study site
The mixed deciduous forest was located in Järvselja, Estonia (58°22′ N, 27°20′ E, elevation 38–40 m). The stand has a leaf area index of about 6 m2 m−2, and is dominated by P. tremula and Betula pendula Roth. in the upper layer (17–27 m), and by T. cordata in the lower layer (4–17 m). The uppermost leaves in the lower canopy layer receive about 20–30% of above-canopy light, while less than 5% of light reaches the forest floor. The soil is a moderately acidic (pH in 1 m KCl solution of 4.19 ± 0.10 for the A horizon) loamy gleyed pseudopodsol. A detailed overview of the study area is provided in Niinemets et al. (1998).
The growing season lasts approximately 130 d with the date of bud-burst in mid-May, and intensive leaf fall starting at the end of September The study was conducted during the years 1995–97. In 1995, the bud-burst was on 8 May for B. pendula, 14 May for T. cordata, and 16 May for P. tremula. For all species, the bud-burst was 3 days earlier in 1996, and 2 days earlier in 1997 than in 1995. All deciduous species at the site produce only a single flush of leaves, and the leaves are maintained for the entire growing season.
Foliar sampling for morphological and chemical analyses
Foliage was sampled from the top to the bottom of the canopy to cover the full range of forest light environments. Average (± SE) height of the sampled P. tremula trees was 25.0 ± 1.7 m (n = 4), and 15.1 ± 0.7 m in T. cordata (n = 4). Access to the foliage was provided by permanent scaffoldings (height 25 m) located at the site. The group of P. tremula trees included in the analysis belonged likely to the same clone (Dickmann & Isebrands 2001). As the initial analysis of variance (anova) demonstrated no tree effect on studied variables (P > 0.2), possible tree-to-tree variability in light acclimation and leaf development is not considered in the current study. Thus, our experimental design investigates the natural variation in foliar variables rather than uses statistics to separate artificial treatment effects (Hurlbert 1984).
In 1995, the foliage was sampled in weekly intervals starting from June 3. Once every month, the samples were taken from 20 different canopy locations per species. In all remaining occasions, foliage was taken from four locations in the canopies of both species. In 1996, and in 1997 we collected primarily the early season foliage to achieve a finer resolution in developmental modifications in foliage structural, chemical and physiological variables.
For morphological and nitrogen analyses, four to nine leaves were taken from each sample location, enclosed in plastic bags and transported on ice to the laboratory, where they were stored at −18 °C until the analysis. For pigment determinations, leaf discs of 1.03 cm2 were removed in situ by a cork-borer, put in vials and plunged immediately in liquid nitrogen.
Temperature and light estimations
Air temperature was continuously measured at eight canopy heights with shielded temperature sensors [K2607 thermometer adaptor (Velleman Kits NV, Gavere, Belgium) based on LM3911 thermistor (National Semiconductor, Santa Clara, CA, USA)].
Hemispherical photographs were taken above each leaf cluster included in the analysis. From the photographs, the fraction of penetrating diffuse (ID) integrated daily quantum flux density was calculated for completely overcast sky conditions, and the fraction of potentially available direct integrated daily quantum flux density (IB) was determined for summer solstice and for 30 and 60 d from summer solstice as described in Anderson (1964). Photosynthetically active quantum flux density (Q) was measured in 18 canopy locations with home-made quantum sensors (Niinemets et al. 1998) in 1 min steps and daily integrated values, QD(D), were calculated. QD(D) averaged over a certain number of days provides average integrated daily quantum flux density (Qint; mol m−2 d−1). Hemispheric photographs were also taken above each quantum sensor at monthly intervals, allowing us to calculate Qint for each leaf from the regression equations of Qint = aID + bIB, where a and b are the regression coefficients.
The integrated quantum flux density (Qint) was determined as an average QD(D) of 5 d following bud-burst for the leaves younger than 10 d, as an average QD(D) of 10 d after bud-burst for older developing leaves, and as an average of 30 d following bud-burst for mature leaves. The influence of varying the time period of Qint calculation on the stability of relationships obtained was separately analysed as detailed in the Results. For these analyses, the regression coefficients a and b were calculated by averaging QD(D) over varying number of days, and using representative hemispheric photographs taken at different times during the season.
Because the canopy leaf area was invariable after completion of leaf expansion growth, the values of ID and IB were essentially constant during most of the growing season. However, there were fast changes in canopy light environment in the beginning and at the end of the growing season that were not captured with a necessary resolution using monthly hemispheric images. For periods of rapid leaf area changes, canopy transmittances for each quantum sensor were determined from the sensor readings, and the estimates of ID by monthly hemispheric photographs were corrected with these measured transmittance values. These apparent values of ID were employed to calculate average integrated quantum flux density as Qint = aID, where a is the regression coefficient.
Due to breaks in line power supply, light measurements were incomplete for approximately 10% of days. The gaps in measurements were filled using a linear regression between above-canopy QD(D) determined in Järvselja and daily global solar radiation (RG; MJ m−2) measured in a nearby meteorological station (58°16′ N, 26°28′ E). Across the seasons, the regression equation obtained was QD(D) = 2.035RG (r2 = 0.94).
To examine the possible interaction between seasonal changes in foliar structural and photosynthetic variables with Qint, upper and lower canopy leaves were examined separately. The entire light range was about 15–100% of above-canopy light in P. tremula, and about 3–30% for T. cordata. In P. tremula, the upper canopy leaves were defined as those receiving at least 75%, and lower canopy leaves less than 35% of above-canopy light. In T. cordata, the upper canopy leaves intercepted more than 15%, and lower canopy leaves less than 10% of above-canopy light. This strategy coupled to direct measurements of integrated quantum flux density avoided bias that may result from a random sampling of foliage during the season.
Photosynthesis measurements
Foliar structural and chemical analyses were accompanied by gas-exchange measurements in all years using the apparatus and procedures described in detail in Niinemets et al. (1999). In short, shoots with four to five leaves were excised under water, transported to the laboratory within an hour after removal, recut in water, and stabilized in dim light before the measurements. In both species, the shoots were taken in the upper and lower canopy thirds at each sampling event. Hemispherical photographs above the shoots were also taken to assess the shoot light environment.
A two-channel gas-exchange system was used to measure net assimilation rate (A) versus intercellular CO2 mole fraction (Ci) response curves at a quantum flux density of 1000 µmol m−2 s−1 and leaf temperature of 26 ± 1 °C, while maintaining leaf to air water vapour deficit less than 0.016 mol mol−1. Every leaf was stabilized for 10–20 min at an ambient CO2 mole fraction of 325 µmol mol−1 in the reference channel, before changing the CO2 mole fraction in the other channel. CO2 versus A responses were started with the lowest CO2 mole fraction, stepwise increasing the CO2 mole fraction. Farquhar, von Caemmerer & Berry (1980) photosynthesis model parameters – the maximum carboxylase activity of Rubisco (Vcmax;A) and the capacity for photosynthetic electron transport (Jmax;A) were calculated according to Niinemets et al. (1999). In the calculations of Jmax;A, the initial quantum yield of photosynthetic electron transport for an incident light, α (mol mol−1) was determined as a product of leaf absorptance (θ) and a constant quantum yield of 0.292 mol electrons (mol quanta)−1 for absorbed light (Ehleringer & Björkman 1977). The latter value has been determined from CO2 uptake measurements in non-photorespiratory conditions (Ehleringer & Björkman 1977), assuming that four mole electrons are required to fix one mole CO2. Studies demonstrate that the quantum yields for CO2 assimilation and photosynthetic electron transport are independent of temperature in such conditions (Ku & Edwards 1978; Ehleringer & Pearcy 1983). Leaf absorptance was either measured with an integrating sphere, or calculated from species-specific non-linear correlations between θ and leaf chlorophyll content determined separately for both species. The measurements of Vcmax;A were converted to 25 °C using standard Rubisco temperature characteristics (Niinemets & Tenhunen 1997), while species average temperature response of photosynthetic electron transport (Niinemets, Oja & Kull 1999) was employed for Jmax;A.
In 1995, the measurements were conducted once weekly or bi-weekly from 8 June until 26 September. Due to the size limits of the circular clip-on type gas-exchange cuvettes, the minimum leaf diameter for measuring gas-exchange was 3.5 cm. This size was achieved in approximately 6–8 d after bud-burst. Because of technical problems at the beginning of 1995, early season changes in leaf photosynthetic characteristics were further studied in 1996 and in 1997. A total of 65 A–Ci response curves were measured over the years 1995–97. In addition to these data, we also included Jmax;A measurements by gas-exchange techniques in fully developed non-senescent leaves during the 1997 growing season from Niinemets et al. (1999). Estimates of Jmax;A from the same canopy height class, and for a given date were averaged.
As the leaves photosynthesizing at low temperatures at the end of growing season essentially lacked stomatal control (Niinemets et al. 1999), laboratory measurements of A–Ci curves were not possible. Therefore, Jmax;A during leaf senescence was inferred from in situ measurements of the effective quantum yield of photosystem II (ΦPSII; Genty, Briantais & Baker 1989) by pulse-amplitude modulated fluorometer PAM 2000 (H. Waltz GmbH, Effeltrich, Germany). The measurements were conducted between 1000–1200 h to avoid photo-inhibitory decreases in ΦPSII. Although all photosynthetic partial reactions are tightly coupled, and the rate of linear electron transport is down-regulated in conditions of Rubisco-limitation, the effective quantum yield of PSII provides generally a reliable estimate of foliar photosynthetic capacity (Edwards & Baker 1993). It has been previously demonstrated that gas-exchange and electron transport measurements in ambient CO2 and light conditions may be successfully employed to derive the Farquhar et al. model parameters by reverse modeling (Niinemets & Tenhunen 1997; Kosugi, Shibata & Kobashi 2003), supporting the validity of the maximum linear electron transport rates determined by chlorophyll fluorescence. Nevertheless, ΦPSII may only partly describe the true photosynthetic capacity in conditions of strong interacting stresses that lead to inhibition of linear electron transport. To allow for an independent assessment, Jmax;A values derived from chlorophyll fluorescence are depicted by different symbols in the figures.
Nitrogen investments in photosynthetic compounds
To separate the structural and biochemical controls on foliar photosynthesis capacity, we write the maximum Rubisco carboxylase activity per unit leaf area, Vcmax;A, as (Niinemets & Tenhunen 1997):
V cmax;A = 6.25 Vcr MA FR NM
(1)where Vcr is the specific activity of Rubisco (the maximum rate of ribulose-1,5-bisphosphate carboxylation per unit Rubisco protein), MA is leaf dry mass per unit area (g m−2), NM is leaf nitrogen content per unit dry mass (g g−1), FR is the fraction of leaf nitrogen in Rubisco, and 6.25 converts nitrogen content to Rubisco protein content. The specific activity of Rubisco has been demonstrated to be essentially constant for C3 plants (Woodrow & Berry 1988; Spreitzer 1999). We used a value of Vcr = 20.5 µmol CO2 (g Rubisco)−1 s−1 at 25 °C derived from Jordan & Ogren (1984).
Analogously, the capacity for photosynthetic electron transport per unit area, Jmax;A, is expressed as:
J max;A = 8.06 Jmc MA FB NM
(2)where Jmc is the capacity for photosynthetic electron transport per unit cytochrome f (mol e– (mol cyt f)−1 s−1) and FB is the fraction of leaf nitrogen in ‘bioenergetics’. The value of FB reflects the content of cytochrome f, ferredoxin NADP reductase (FNR), and the coupling factor (CF), which are the proteins limiting the rate of linear electron transport (Evans & Seemann 1989). Assuming a constant 1 : 1 : 1.2 molar ratio for cyt f : FNR : CF, an investment of 1 g N in bioenergetics is equivalent to 8.06 µmol cyt f. (Evans & Seemann 1989). We use a value of Jmc = 156 mol e– (mol cyt f)−1 s−1 at 25 °C (Niinemets & Tenhunen 1997). Numerous studies support the fixed stoichiometry of rate-limiting proteins of photosynthetic electron transport (e.g. Evans 1988; Evans & Seemann 1989).
Chlorophyll estimations
Chlorophyll a and b contents of 1995 samples were determined by high pressure liquid chromatography (HPLC) as described in full detail in Niinemets et al. (1998). For the samples taken in 1996 and 1997, the chlorophylls were extracted with buffered (sodium phosphate buffer, 2.5 mm, pH = 7.8) 80% aqueous acetone (v/v), and chlorophyll concentrations were calculated from the extinction measurements (CE 3040 UV/Vis spectrophotometer; Cecil Instruments Ltd, Cambridge, UK) using the equations of Porra, Thompson & Kriedmann (1989). Cross-calibrations of the HPLC and spectrophotometric methods demonstrated that both techniques yielded accurate estimates of leaf chlorophyll contents.
Leaf area, dry mass and nitrogen determinations
Leaf lamina perimeter was traced with a computer digitizer (QD-1212; QTronix, Taiwan), and the area was calculated by using home-written software. Leaves were dried at 70 °C for at least 48 h. The petiole and lamina were separately weighted, and lamina dry mass per unit area was calculated (MA). An average MA was computed for all leaves in the leaf cluster. The lamina nitrogen contents were estimated with an elemental analyser (CHN-O-Rapid; Foss Heraeus GmbH, Hanau, Germany). Overall, more than 500 leaf samples were analysed for MA and N.
Simulation of the sensitivity of foliar net assimilation rates to modifications in leaf structural and chemical variables
To illustrate the significance of variations in leaf nitrogen partitioning, leaf N content and leaf structure on net assimilation rate versus nitrogen relations, we employed the Farquhar et al. (1980) photosynthesis model to simulate the influence of extreme values of leaf structural and chemical characteristics on foliar photosynthesis. The Farquhar et al. (1980) model was parameterized according to Niinemets & Tenhunen (1997), and the simulations were conducted for a leaf temperature of 25 °C, intercellular CO2 mole fraction of 250 µmol mol−1, and incident quantum flux density of 1000 µmol m−2 s−1. The day respiration rate was determined from a correlation with Vcmax;A (Niinemets & Tenhunen 1997).
Statistical analyses of the experimental data
Simple linear regression analyses were employed to test for statistical significance of leaf structure, chemistry and photosynthesis versus average integrated daily quantum flux density (Qint) relationships using standard least squares method (Wilkinson 1990). The dependencies of leaf variables on Qint at different sampling dates were compared by covariation analyses (ancova). First, separate-slope covariation analysis was conducted to test for slope differences. Whenever the interaction term (sampling date) × Qint, was insignificant, the analysis was continued according to a common slope model (Sokal & Rohlf 1995). Because Qint may be determined over different periods of days preceding foliar sampling, covariation analyses were also employed to test for the statistical significance of slope and intercept differences between the day-specific regressions. Covariation analyses were further used to test for the differences in the rate of development of leaf structural and photosynthetic characteristics between the upper and lower canopy leaves. One-way anova was used to compare leaf characteristics of fully mature non-senescent leaves (leaf age 40–120 d from the bud-burst) between the upper and lower canopy layers. All statistical comparisons were considered significant at P < 0.05.
Generalization of the patterns in leaf development in broad-leaved deciduous trees
We compared the rates of morphological and physiological leaf development observed in the current study with previous estimates in temperate deciduous trees that form only one leaf cohort in the beginning of the growing season. The rate of development of leaf structure was estimated as the slope of MA versus leaf age relationship (JM; g m−2 d−1), while the rate of development of leaf photosynthetic capacity was estimated as the slope of Vcmax;A versus leaf age. Only developing leaves younger than 40 d were used to calculate the rates of MA and Vcmax;A development. For this analysis, Vcmax;A was determined from leaf net assimilation rates and standardized to 25 °C as described in Niinemets & Tenhunen (1997). Altogether it was possible to derive the rates of structural and physiological leaf development for 15 previous observations from six independent studies (11 species, of which four species were represented by both upper and lower canopy measurements).
Linear regression analysis was used to test for the correlation between the rates of leaf morphological (slope of MA versus leaf age relationship, JM) and photosynthetic (slope of Vcmax;A versus leaf age relationship) development. Combining results from several independent studies can lead to biased conclusions due to influential data or outliers that may result from study-to-study differences in the experimental design (Gurevitch & Hedges 1993). Leverages and Studentized residuals were calculated to check for the possible regression artifacts (Belsley, Kuh & Welsch 1980). As none of the data points had both a high leverage and Studentized residual, this analysis suggested that the observed correlation was not affected by the outlying observations. As a more radical approach, we removed values higher or lower than 75% of the mean JM from the dataset (Sokal & Rohlf 1995). Linear regression between JM and the slope of Vcmax;A versus leaf age was significant for both the full (r2 = 0.86, P < 0.001, n = 19) and the truncated dataset (r2 = 0.71, P < 0.001, n = 14), indicating that this relationship was robust and did not significantly depend on the extreme values included.
RESULTS
Variation in canopy light and temperature environment
The average (± SD) integrated daily quantum flux density for the entire growing season (14 May to 1 October) was similar for 1995 (37.3 ± 14.3 mol m−2 d−1) and 1997 (35.9 ± 15.0 mol m−2 d−1) seasons, but somewhat lower for 1996 (32.7 ± 13.0 mol m−2 d−1). The day-to-day differences in light environment were large, with the coefficient of variation (standard deviation per sample mean) for the entire growing season (14 May to 1 October) of 38% for 1995, 40% for 1996, and 42% for 1997 (Fig. 1a).
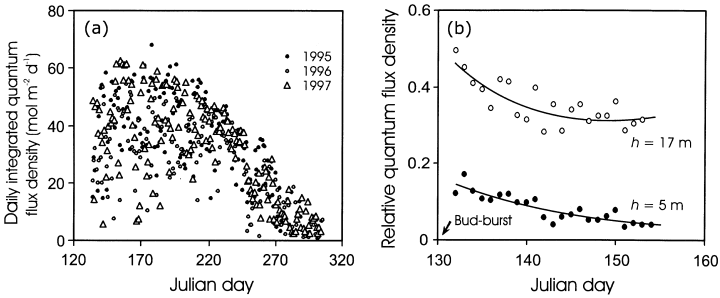
Seasonal variation in above-canopy daily integrated quantum flux density, QD(D), for the growing seasons 1995–97 (a), and changes in relative incident quantum flux density in mid- and lower canopy due to leaf area development during the growing season 1996 (b). The arrow denotes the Julian day of bud-burst for Tilia cordata.
The fraction of light available at different heights in the canopy was larger in the beginning of the season, and decreased with canopy leaf area development (Fig. 1b), whereas the early and mid-season differences in light availability were relatively larger for the lower than for the upper canopy leaves. However, because the coexisting canopy trees of B. pendula flushed earlier than the trees of either P. tremula or T. cordata, the seasonal variation in canopy light environment was less in the foliage of the lower canopy species T. cordata.
There may be significant effects of year-to-year differences in canopy microclimate on the rate of leaf development and on the Qint versus leaf structure and function relationships (e.g. Wilson et al. 2000, Wilson, Baldocchi & Hanson 2001). We cannot test conclusively for such effects with our data, because the dates of sampling in various years were only partly overlapping. Thus, the potential effects of year-to-year variability in climatic conditions are present as unexplained variance in our data. Nevertheless, Wilson et al. (2001) demonstrate that there is essentially no year-effect on leaf development once the differences in the date of bud-burst are accounted for. In our study, the data for different years were intermixed after the leaf-to-leaf variability in light environment and differences in the date of leaf bud-burst were taken into account, suggesting that such year-to-year variations did not bias our main conclusions.
Daily average air temperature was not correlated with Qint in open plant canopies during leaf development, whereas there was a significant interaction between Qint and average temperature after full leaf development (Fig. 2). Thus, it is unlikely that canopy differences in temperature influenced canopy variations in the rate of leaf development in our study.
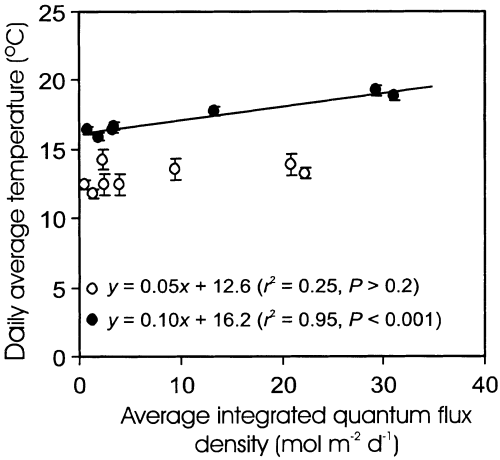
Correlations between daily average air temperature and average integrated daily quantum flux density (Qint) during leaf growth (average for 1–15 d from bud-burst; open symbols) and in fully developed canopy (46–107 d from bud-burst; filled symbols) for 1996 growing season. Linear regression equations along with significance estimates are also provided. The error bars provide ± SE.
Modification of leaf dry mass per unit area (MA) by light and leaf age
Directly after bud-burst, there were only minor differences in MA between the upper and lower canopy leaves in P. tremula(Fig. 3a), but larger differences in T. cordata (Fig. 3b). For both upper and lower canopy leaves of P. tremula, MA strongly increased during the first 35–40 d after bud burst (DB; Fig. 3a), but MA increased only in the upper canopy leaves of T. cordata (Fig. 3b). In fact, MA of the lower canopy leaves of T. cordata was slightly larger directly after bud-burst than a week later (Fig. 3b). The rate of increase in MA (the slope of MA versus DB) was significantly larger for the upper canopy leaves in both species according to covariation analyses (P < 0.001).
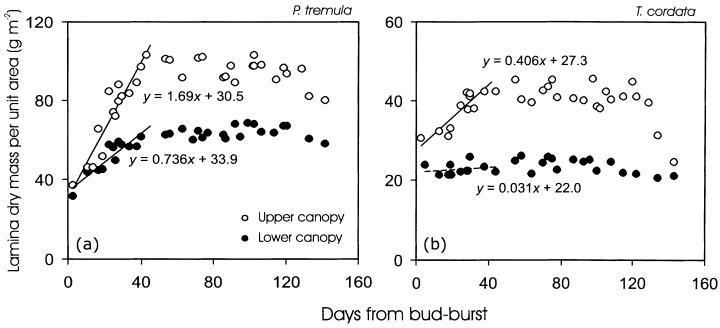
Variation in leaf dry mass per unit area (MA) in dependence on leaf age (DB, days from bud-burst) in Populus tremula(a) and Tilia cordata(b). The MA versus leaf age relations for the first 40 d were fitted by linear regressions. All relationships were significant at P < 0.001, except for T. cordata lower canopy leaves (P > 0.5). In P. tremula, the upper canopy leaves (height 23.5–27 m) intercepted on average (± SD) 82.4 ± 6.0% of above-canopy light, and this percentage was 27.6 ± 10% for the lower canopy leaves (14–20 m). In T. cordata, the upper canopy leaves (14–17 m) intercepted 19.6 ± 5.0% of above-canopy light, and the lower canopy leaves (4–10 m) 8.1 ± 3.1% of above-canopy light.
To assess the importance of leaf light environment in explaining the differences in the rate of change in MA, we calculate the initial rate of biomass accumulation (χM, g mol−1) per unit average integrated quantum flux density:
 (3)
(3)where JM (g m−2 d−1) is the slope of MA versus DB (DB range of 0–40) relationship, and Qint (mol m−2 d−1) is the average integrated quantum flux density during this period. Values of χM for the upper (0.055 ± 0.007 g mol−1; ± SE determined from the standard error of the regression slope) and lower (0.072 ± 0.013 g mol−1) canopy leaves of P. tremula were similar, but χM was considerably larger for the upper than for the lower canopy leaves of T. cordata (0.056 ± 0.010 g mol−1 versus 0.010 ± 0.018 g mol−1). Discarding the initial exceptionally large value of MA yields a χM of 0.034 ± 0.021 g mol−1 for the lower canopy leaves of T. cordata. Thus, similar values of χM for the entire canopy support the hypothesis of the primary role of light in controlling the rate of leaf development.
Stability of MA versus light relationships
For developing leaves of both P. tremula(Fig. 4a) and T. cordata (Fig. 4b), the slope of MA versus Qint relationship increased with increasing leaf age, paralleling canopy differences in the rate of leaf development (Fig. 3, Table 1, separate-slope ancova analysis). The intercept of MA versus Qint relations also increased with DB in P. tremula (Fig. 4a). In T. cordata, the intercept was lower for 2-week-old-leaves than for leaves directly after bud-burst, and approached the initial value with further leaf aging (Fig. 4c, Table 1, ancova).
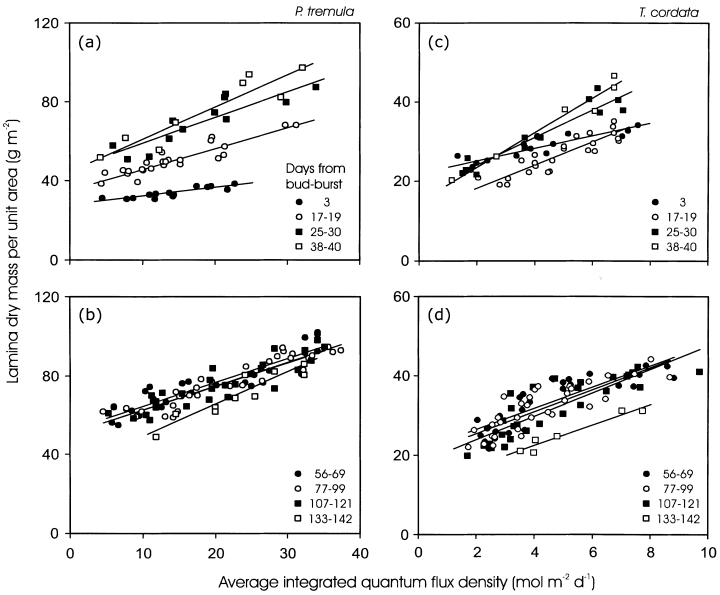
Light-related changes in MA at different dates during the growing season in P. tremula (a, b) and Tilia cordata (c, d). The average integrated quantum flux density (Qint) was determined as the average for 5 d following bud-burst for May 15 (DB = 3 d), for 10 d for the rest of May and June data (DB = 17–40) and as an average for 30 d following bud-burst for all other data. The linear regression equations are given in Table 1.
| Days from bud-burst | P. tremula | T. cordata | n | ||||
|---|---|---|---|---|---|---|---|
| Intercept (g m−2) | Slope (g d mol−1)b | r 2 | Intercept (g m−2) | Slope (g d mol−1)b | r 2 | ||
| 3 | 27.7 | 0.430a | 0.77 | 22.2 | 1.55a | 0.78 | 16 |
| 17–19 | 35.7 | 1.028b | 0.84 | 12.4 | 2.91b | 0.80 | 24 |
| 25–40 | 46.8 | 1.26c | 0.80 | 15.4 | 3.93c | 0.90 | 20 |
| 56–69 | 52.5 | 1.19bc | 0.84 | 21.1 | 2.68b | 0.71 | 28 |
| 77–99 | 50.5 | 1.21bc | 0.87 | 19.9 | 2.79b | 0.70 | 32 |
| 107–121 | 50.7 | 1.20bc | 0.81 | 17.8 | 2.98b | 0.73 | 28 |
| 133–142 | 32.8 | 1.61c | 0.87 | 11.7 | 2.63bc | 0.95 | 10 |
- All intercepts and slopes are statistically significant at P < 0.001. n denotes the sample size for both species. aQint was averaged over 5 d following bud burst for 15 May data, 10 d for 31 May, and June data, and over 30 d for the rest of the data. The date of bud-burst was 12 May for both species. bThe slopes with the same letter are not statistically different at P < 0.05 according to separate-slope covariation analyses.
In mature non-senescent leaves (DB range of 40–121 d), the MA versus Qint relations were seemingly stable with minor differences between the sampling dates, but there was evidence of a moderate decline in MA in senescent leaves (Fig. 4b & d, Table 1, ancova). For all mature leaves pooled, the coefficient of determination (r2) that measures the amount of variation in MA that is explained by linear regression of MA on Qint, was only weakly altered by using different time spans for average integrated daily quantum flux density calculation in both P. tremula(Fig. 5) and T. cordata (data not shown). Due to temporal changes in above-canopy Qint (Fig. 1a), the intercepts and slopes of the MA versus Qint relationships were dependent on the number of days included in average Qint calculation (P < 0.01 for slope and intercept differences between the extremes). However, for Qint values determined as an average for more than 20 d after bud-burst (Fig. 5a), or preceding leaf sampling (Fig. 5b) these changes were less than 1% for the intercept and about 5% for the slope, demonstrating that the MA versus Qint relationship is robust for mature leaves.
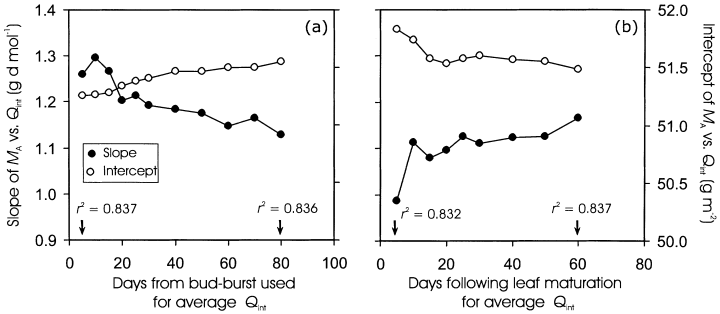
Slope and intercept of MA versus Qint relations for the mature non-senescent leaves of P. tremula (Fig. 3b, DB range of 55–121 d) in dependence on the number of days for Qint calculation. Integrated daily quantum flux density was averaged for varying time periods following (a) leaf formation or (b) leaf maturation (DB = 55 d). The explained variances (r2) of the linear regressions for the shortest and longest time periods used in Qint calculation are also provided.
Seasonal changes in foliar nitrogen contents
Leaf nitrogen content per unit dry mass (NM) changed rapidly during leaf development and senescence, and varied considerably less in mature leaves (Fig. 6a & b). The average (± SD) NM for the mature leaves (DB range of 40–120) was 2.30 ± 0.20% for the upper, and 2.18 ± 0.10% for the lower canopy leaves of P. tremula (the means are significantly different at P < 0.005 according to anova, n = 26), and 2.67 ± 0.28% for the upper and 2.61 ± 0.26% for the lower canopy leaves of T. cordata (the means are not statistically different, P > 0.06, n = 26). However, there was a continuous decline in NM of mature leaves of the upper canopy in P. tremula (inset in Fig. 6a), and for all leaves in T. cordata (inset in Fig. 6b). For the upper canopy leaves of P. tremula, the regression equations predicted that the change in NM in mature leaves was about 15% for an increase in leaf age from 30 to 120 d. The corresponding decline in NM was about 20% for the leaves of T. cordata.

Nitrogen content per unit dry mass (a, b), area (c, d), and individual leaf (e, f) relative to leaf age in P. tremula (a, c, e) and T. cordata (b, d, f) leaves from the upper and lower canopy, and for fresh leaf litter. Upper and lower canopy was defined as in Fig. 3. Nitrogen content per dry mass versus DB relations for a DB range of 35–120 d were fitted by linear (a) or second-order polynomial (b) regressions. The insets in (a) and (b) demonstrate these relationships in a finer resolution.
Changes in N per unit leaf area (NA) of mature and senescent leaves followed the trends in NM (Fig. 6c & d). However, the early season values of NA were strongly modified by increases in MA (cf. 2, 6) such that the initial decline in NA was followed by an increase to a maximum value (Fig. 6c & d). As Fig. 6e and f demonstrate, about 20–30% of leaf N was present after bud-burst, and developmental modifications in NA resulted from large nitrogen exports to maturing leaves in both species. These data (Fig. 6e & f) further indicate that there is real net export of N out of fully mature non-senescent leaves during the growing season.
Leaf chlorophyll contents in relation to Qint and leaf age
Leaf chlorophyll content per unit dry mass (ChlM) changed less than either MA (Fig. 3) or NM (Fig. 6) in developing leaves (Fig. 7a & b). Early season modifications in the chlorophyll contents per unit area (ChlA) were larger due to simultaneous increases in MA, especially for the upper canopy leaves (Fig. 7c & d). Both ChlM and ChlA declined rapidly in senescing foliage (Fig. 7a–d). There was also a slight, but significant decrease in chlorophyll contents of mature leaves in the upper canopy of P. tremula, and for both the upper and lower canopy of T. cordata (Fig. 7a–d).
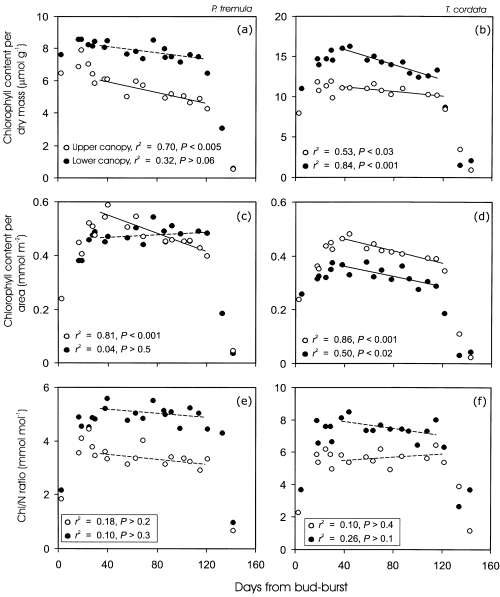
Variation of foliar chlorophyll content per unit dry mass (a, b), area (c, d), and chlorophyll to nitrogen ratio (e, f) with leaf age in the upper and lower canopy of P. tremula (a, c, e) and T. cordata (b, d, f). Upper and lower canopy was defined as in Fig. 3. Relationships of chlorophyll content, and chlorophyll to N ratio (Chl/N) with DB of mature non-senescent leaves (DB range 35–120 d) were fitted by linear regressions. Non-significant regressions (P > 0.05) are given by a broken line.
Chlorophyll to N ratio (Chl/N) was low just after bud-burst and reached a stable value 7–14 d after bud-burst (Figs 7e & f). In mature leaves, Chl/N was invariable (Figs 7e & f), indicating that decreases in foliar chlorophyll contents were directly associated with nitrogen retranslocation out of the leaves (Fig. 6).
Both ChlM (Fig. 7a & b) and Chl/N (Fig. 7e & f) were larger in the lower canopy leaves. The intercept of ChlM(Fig. 8a & c, Table 2, ancova) and Chl/N (Fig. 8e & g) versus Qint relations increased with advancing leaf development, reflecting the increase in ChlM and greater nitrogen investments in light harvesting. The slopes of these relationships also varied in developing leaves, but the variability was minor, except for larger differences in Chl/N ratio directly after bud-burst and several days following bud-burst (Fig. 8a, c, e & g, Table 2, ancova). This demonstrates that the light-sensitivities of ChlM and nitrogen investment in light harvesting are similar for all stages of leaf development. In mature non-senescent leaves of P. tremula, the slopes of ChlM and Chl/N versus Qint relationship tended to become more negative with increasing leaf age, primarily as the result of moderately lower ChlM and Chl/N ratio in the upper canopy leaves (Fig. 8b & f, Table 2). The variability in ChlM versus Qint was larger in T. cordata, and there was evidence of a general decrease in the slope of ChlM versus Qint relationship with the age of mature non-senescent leaves (Fig. 8d, Table 2, ancova). No clear age-dependent trend in the slopes and intercepts of Chl/N versus Qint relations was observed in non-senescent leaves of T. cordata (Fig. 8f & g). In senescent leaves, ChlM and Chl/N versus light relations were unstable (Fig. 8b, d, f & h). According to visual observations, there were both green and yellow leaves in different canopy light environments during the initial stages of senescence.
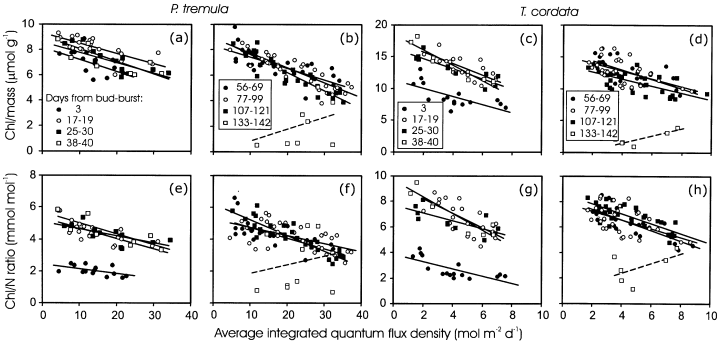
Effects of Qint on foliar chlorophyll content per unit dry mass (a–d), and chlorophyll to N ratio (e–h) in P. tremula (a, b, e, f) and T. cordata (c, d, g, h) leaves of different age. Qint was determined as the average of 5 d following bud-burst for the first sampling date at DB = 3 d (May 15), for 10 d for the rest of May and June data (DB = 17–40) and as an average for 30 d after bud-burst for other sampling dates. The linear regression equations of chlorophyll per mass versus Qint relations are given in Table 2. Non-significant relationships (P > 0.05) are shown by a broken line.
| Days from bud-burst | P. tremula | T. cordata | n | ||||||
|---|---|---|---|---|---|---|---|---|---|
| Intercept (µmol g−1) | Slope (µmol g−1 d m2 mol−1)b | r 2 | P | Intercept (µmol g−1) | Slope (µmol g−1 d m2 mol−1)b | r 2 | P | ||
| 3 | 8.18 | −0.0958ab | 0.44 | 0.01 | 11.3 | −0.636ab | 0.47 | 0.003 | 16 |
| 17–19 | 9.27 | −0.0812a | 0.50 | 0.001 | 17.5 | −0.925ab | 0.58 | 0.001 | 21 |
| 25–40 | 8.89 | −0.0925a | 0.66 | 0.001 | 17.3 | −0.975a | 0.81 | 0.001 | 20 |
| 56–69 | 8.31 | −0.0882a | 0.58 | 0.001 | 15.9 | −0.729a | 0.49 | 0.001 | 28 |
| 77–99 | 8.88 | −0.117a | 0.77 | 0.001 | 15.2 | −0.615a | 0.31 | 0.002 | 32 |
| 107–121 | 9.05 | −0.143b | 0.83 | 0.001 | 13.7 | −0.554b | 0.43 | 0.001 | 28 |
| 133–142 | −0.068 | 0.0901c | 0.14 | 0.2 | −0.624 | 0.534c | 0.71 | 0.05 | 10 |
- a Q int was averaged over 5 d following bud burst for 15 May data, 10 d for 31 May, and June data, and over 30 d for the rest of the data. The date of bud-burst was 12 May for both species.
- b The slopes with the same letter are not statistically different at P < 0.05 according to separate-slope covariation analyses.
We explored the effects of previous vis-à-vis current light environment on ChlM and Chl/N versus Qint relations in mature leaves by averaging Qint over various days preceding leaf sampling. For all mature leaves pooled (DB range of 55–121 d), r2 of these relations increased with increasing the length of time period prior to sampling that was used for Qint determination (Fig. 9). However, even the regressions with average integrated quantum flux density of 60 d before leaf sampling explained less of the total variation in ChlM and Chl/N than the relationships with average integrated quantum flux density during leaf development (Fig. 9). This suggests that ChlM and Chl/N are determined in early season, and that ChlM and Chl/N versus light relations of fully mature leaves are not significantly altered by day-to-day and month-to-month variabilities in Qint.
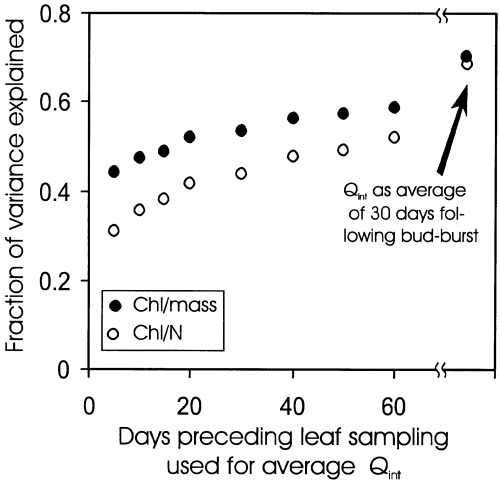
The fraction of variance explained (r2) of the chlorophyll per unit dry mass, and chlorophyll to N ratio versus Qint relationships for the mature non-senescent leaves of P. tremula (Fig. 8b & f; DB range of 55–121 d) in relation to the number of days included to determine the average integrated daily quantum flux density. Also included are the r2 values for regressions with Qint estimated as an average over 30 d following bud-burst.
Modification of foliar photosynthetic capacity by light and leaf age
There were minor initial canopy differences in the capacity for photosynthetic electron transport per unit area (Jmax;AFig. 10a & b) and in the maximum Rubisco carboxylase activity per unit area (Vcmax;A; data not shown, inset in Fig. 10c). Canopy differences in foliar photosynthetic capacity increased progressively with leaf maturation, and stabilized in approximately 40-day-old leaves with only small decreases in the capacities until the onset of leaf senescence (Fig. 10a & b). The capacities per unit dry mass changed similarly during the season (Fig. 10c & d), but there was only a minor canopy variation in the mass-based photosynthetic capacity. According to anova, average (± SD) photosynthetic electron transport capacity per unit dry mass (Jmax;M) of mature leaves (DB range of 40–120) was not significantly different (P > 0.3) between the upper (1.67 ± 0.35 µmol g−1 s−1) and lower (1.76 ± 0.23 µmol g−1 s−1) canopy in P. tremula (n = 14 for both upper and lower canopy), but was moderately larger (P < 0.01) in the upper (2.08 ± 0.20 µmol g−1 s−1) than in the lower (1.77 ± 0.26 µmol g−1 s−1) canopy of T. cordata (n = 13 for both upper and lower canopy). However, the maximum Rubisco carboxylase activity per unit dry mass (Vcmax;M) was larger (P < 0.005) in the lower (0.67 ± 0.06 µmol g−1 s−1) than in the upper (0.56 ± 0.10 µmol g−1 s−1) canopy of P. tremula, but no differences (P > 0.3) were observed between the upper (0.72 ± 0.05 µmol g−1 s−1) and lower (0.67 ± 0.11 µmol g−1 s−1) canopy of T. cordata.
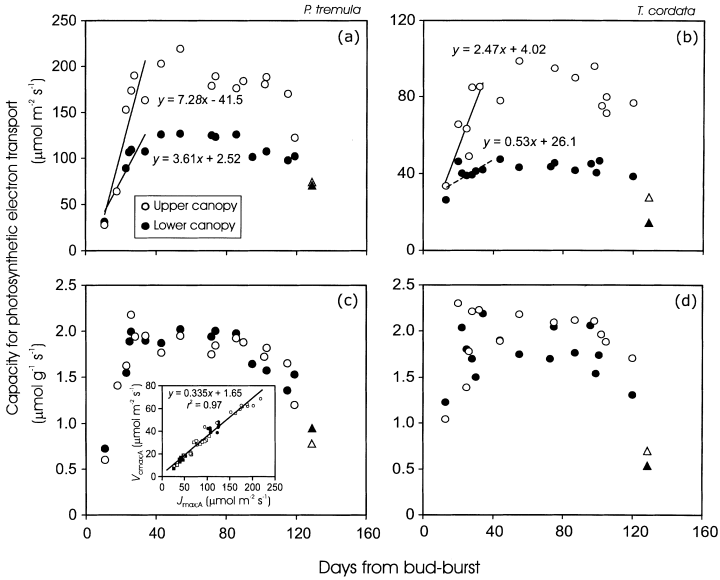
Light-saturated rate of photosynthetic electron transport per unit area (Jmax;A; a, b) and dry mass (Jmax;M; c, d) relative to leaf age in P. tremula (a, c) and T. cordata (b, d) leaves from the upper (open symbols) and lower canopy (filled symbols). The upper and lower canopy is defined as in Fig. 3. The capacity for photosynthetic electron transport was derived from gas-exchange measurements (circles), except for the last measurement date (triangles). The latter values were derived from chlorophyll fluorescence measurements. The initial rise in (a) and (b) (DB ≤ 35 d), was fitted by linear regression. The non-significant regression (r2 = 0.34, P> 0.1) in (b) is drawn by a broken line. The inset in (c) demonstrates the correlation between Jmax;A and the maximum carboxylase activity of Rubisco per unit area (Vcmax;A).
Variation in nitrogen investments in photosynthetic machinery
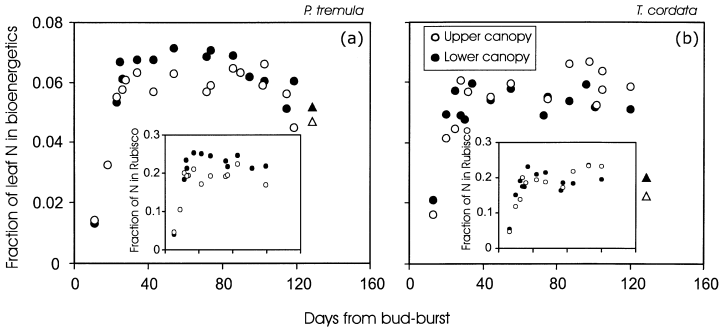
Seasonal changes in foliar photosynthetic capacity were partly explained by modifications in the fractional nitrogen investment in bioenergetics (FB, Fig. 11a & b) that determines the capacity for light-reactions of photosynthesis at a common MA and leaf nitrogen content (Eqn 2); and in fractional nitrogen investment in Rubisco (FR, insets in Fig. 11a & b) that determines the capacity for dark reactions of photosynthesis (Eqn 1). The ratio of FR/FB was slightly larger in the mature than in young leaves in the upper canopy of T. cordata (r2 = 0.47, P < 0.05 for a linear regression between FR/FB and DB) and was independent of DB in other cases (P > 0.2), demonstrating that the fractional distribution of N among chloroplast proteins was essentially constant in time.
In accordance with previous observations (Reich et al. 1991), the correlations of foliar photosynthetic capacity per unit dry mass with NM (r2 = 0.01 for Jmax;M, and r2 = 0.12 for Vcmax;M) and photosynthetic capacity per area with NA (r2 = 0.74 for Jmax;A and r2 = 0.65 for Vcmax;A) were considerably weaker if all data were pooled, than after removal of the early season data (for mass basis: r2 = 0.58 for Jmax;M, and r2 = 0.35 for Vcmax;M; for area basis: r2 = 0.87 for both Jmax;A and Vcmax;A).
Influence of the extreme variations in leaf structural and chemical characteristics on foliar photosynthesis is simulated in Fig. 12. This simulation demonstrates a large variation in leaf photosynthesis due to differences in nitrogen partitioning, and underscores the importance of fractional leaf nitrogen investments in photosynthetic machinery for prediction of net assimilation rates. According to this simulation, differences in nitrogen partitioning also explain the weak mass-based nitrogen versus net photosynthesis relationship for the entire season.
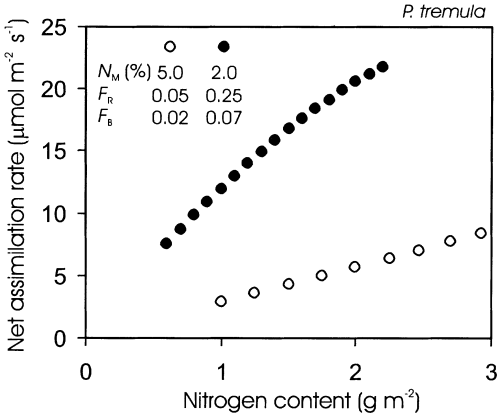
Simulated net assimilation rate in dependence on leaf nitrogen content for a representative early season leaf (open symbols), and mature-leaf (filled symbols). The variation in N content per area at a given N content per dry mass (NM) was achieved by varying leaf dry mass per unit area (MA) from 20 to 60 g m−2 for the developing leaf and from 20 to 110 g m−2 for the mature leaf. Seasonal variation in fractional nitrogen investments in Rubisco (FR; Eqn 1) and bioenergetics (FB; Eqn 2) is illustrated in Fig. 11.
Is MA controlling canopy differences in photosynthesis development?
Canopy differences in photosynthetic nitrogen investments were small. In fully mature leaves of P. tremula, FB = 0.055 ± 0.011 for the upper and FB = 0.064 ± 0.006 for the lower canopy (P < 0.05 for the difference between the means, anova), while FR = 0.182 ± 0.028 for the upper and FR = 0.231 ± 0.016 for the lower canopy (P < 0.001, n = 14 for both upper and lower canopy). In T. cordata, FB = 0.0590 ± 0.005 for the upper and FB = 0.054 ± 0.003 for the lower canopy (P > 0.09), and FR = 0.199 ± 0.021 for the upper and FR = 0.197 ± 0.023 for the lower canopy (P > 0.8, n = 13 for both upper and lower canopy). Small canopy differences in apparent nitrogen investments (Fig. 11a & b), nitrogen contents (Fig. 6a & b) and the photosynthetic capacities per unit dry mass (Fig. 10c & d) collectively suggest that large canopy differences in the rate of development of photosynthetic capacity per unit area (Fig. 10a & b) were primarily associated with changes in MA as the capacity per area = (capacity per mass) × MA.
DISCUSSION
Early seasonal changes in MA in canopies of deciduous tree species
We observed minor initial differences in MA between the upper and lower canopy leaves in P. tremula (Fig. 3a), but larger early season differences in T. cordata (Fig. 3b). Relatively small canopy variation in MA in the beginning of season agrees with the experimental evidence that MA is primarily determined by the light environment during leaf expansion growth (Hansen 1959; Goulet & Bellefleur 1986; Kimura et al. 1998). However, previous-year light environment may also partly affect MA in some species (Eschrich et al. 1989; Labrecque et al. 1989), possibly explaining larger canopy variation in T. cordata. Nevertheless, there was a significant canopy light gradient already during the bud-burst in both P. tremula and T. cordata, albeit smaller than after completion of leaf expansion (Fig. 1b). Thus, foliage structural differences in our study can also be explained by the current leaf light environment alone.
After bud-burst, there was a monotonic increase in MA for all leaves of P. tremula and for the upper canopy leaves of T. cordata (Fig. 3). Such monotonic changes in MA are in agreement with the majority of observations (Koike 1990; Reich et al. 1991; Oleksyn et al. 2000; Wilson et al. 2000). For lower canopy leaves of T. cordata, MA was slightly higher directly after bud-burst and was essentially constant thereafter (Fig. 3b). This may be related to more densely packed mesophyll in young leaves (Dengler 1980; Tichá 1985), and to the circumstance that foliar thickness changes considerably less in shaded than in fully exposed leaves during leaf growth (Dengler 1980). An alternative possibility is a proportionally larger volume fraction of mid-rib in the young shaded leaves, laminas of which are initially thinner than those of the exposed leaves.
Contrary to our study, Jurik (1986b) and Hamerlynck & Knapp (1996) report a continuous decrease in MA for approximately 20 d after bud-burst, followed by a monotonic increase. Such long-lasting early season decreases in MA are not in accord with most of the experimental observations, and probably represent experimental artifacts due to measuring the projected area of folded and rolled rather than unfolded leaf laminas.
Of course, not only light but also temperature affects leaf structural development. Given that in dense plant canopies there are often significant temperature gradients that interfere with light in the canopy (Niinemets, Oja & Kull 1999; Baldocchi, Wilson & Gu 2002), temperature effects may be particularly important in interpreting the results of the current study. However, the correlation between temperature and Qint was not significant during leaf development (Fig. 2), suggesting that such an environmental interaction did not bias the conclusions of our study. Furthermore, temperature primarily affects leaf expansion growth, and increases in temperature may actually result in a lower MA (Nobel, Zaragoza & Smith 1975; Körner & Larcher 1988; Tardieu, Granier & Muller 1999) rather than in enhanced MA as was observed in our study. Thus, this evidence collectively suggests that canopy variation in morphological development was primarily determined by light rather than by temperature.
Stability of MA versus Qint relationships in mature leaves
Developmental changes in MA were faster in the upper than in the lower canopy (Fig. 3). As the result of differing rates of leaf development, the slopes of MA versus integrated quantum flux density (Qint) relationships increased until leaf maturation (Fig. 4a & b). In mature leaves, MA versus Qint relationship was essentially invariable (Fig. 4b & d), and the best correlation was achieved with the integrated quantum flux averaged over the 20–30 d from bud-burst (Fig. 5), corroborating the suggestion that MA is determined during leaf development. Minor changes in MA of mature leaves have been observed after radical artificial changes in leaf light conditions (Naidu & DeLucia 1997; Frak et al. 2001; Niinemets et al. 2003), further demonstrating that MA of mature non-senescent leaves and for a given canopy position is essentially a constant in northern temperate tree species.
Seasonal changes in foliar nitrogen
Seasonal changes in leaf nitrogen contents per unit dry mass (NM) were characterized by three distinct phases (Fig. 6a & b): (1) fast decreases in NM in developing leaves, during which the rates of leaf carbon accumulation exceed the rates of nitrogen export; (2) relatively stable NM contents in mature leaves; and (3) rapid changes in NM after the onset of leaf senescence. Similar phases of NM changes can also be distinguished in other deciduous trees (le Tacon & Toutain 1973). Because there was a minor canopy variation in nitrogen contents per unit dry mass (cf. Fig. 6a & b and 6c–f), the upper and lower canopy differences in leaf nitrogen contents per unit area (NA) and per individual leaf are directly related to differences in MA.
Even in mature leaves, in particular for the upper canopy leaves (Fig. 6a & b), NM, NA and nitrogen content per leaf continuously decreased. Overall, there is a high turnover rate of leaf proteins, and continuous import of inorganic nitrogen in the leaf via xylem, and export of amino acids via phloem (Feller & Fischer 1994). Thus, the net decrease in NM in mature leaves hints at slowing down of inorganic nitrogen delivery rate and/or reduced synthesis rate of leaf proteins. In herb and grass species, foliar protein and nitrogen contents decline immediately after the leaf attains a peak physiological activity (Hidema et al. 1992; Mae et al. 1993; Takeuchi et al. 2002). Reduced protein synthesis rates after leaf maturation have also been observed in seedlings and saplings of deciduous trees producing multiple leaf flushes during the season (Vapaavuori & Vuorinen 1989; Valjakka et al. 1999). A general feature of developing plant canopies with short-living leaves is that the older leaves become overtopped by younger leaves during canopy developing. Such a shading by upper canopy leaves has been highlighted as the primary signal of leaf senescence in plants with short leaf life-span (Hikosaka 1996). Artificial shading experiments in tree canopies with long-living leaves also demonstrate that shading leads to decreased foliar nitrogen contents in long-living leaves (Saur, Nambiar & Fife 2000). Given that the average above-canopy quantum flux densities continuously decrease after summer solstice (Fig. 1a), mid-seasonal declines in foliar nitrogen contents may be associated with decreases in quantum flux density in our study.
The net nitrogen export from the mature leaves rises the question of what happens with the remobilized nitrogen? Studies demonstrate that shading results in more efficient nitrogen mobilization if there is a strong competition for nitrogen by growing organs (see Ono, Terashima & Watanabe 1996 for a discussion). In northern temperate trees, such a competing late-seasonal nitrogen sink is present in growing buds.
Age- and light-dependent modifications in foliar chlorophylls
Foliar chlorophyll contents as well as chlorophyll to N (Chl/N) ratios increased in early season (Fig. 7) compatible with previous observations of enhanced synthesis rates of chloroplast proteins in developing leaves (Hidema et al. 1992; Mae et al. 1993). In mature leaves, chlorophyll contents declined slightly (Fig. 7a–d), whereas Chl/N ratio was essentially constant (Fig. 7e & f). This demonstrates that decreases in chlorophyll contents were directly associated with mid- and late-seasonal re-mobilization of leaf nitrogen contents.
Directly after the bud-burst, there was a small canopy gradient in foliar chlorophyll contents and Chl/N ratio (Fig. 8a, e, c & g). The gradient was augmented during leaf development, indicating that the synthesis rates of chlorophyll-protein complexes were more rapid in the lower canopy, leading to the sharp chlorophyll and Chl/N ratio gradient in the canopies of both species.
Literature indicates that the light-harvesting chlorophyll-protein complexes are effectively dismantled in response to long-term stress effects (Andersson & Aro 1997), resulting in decreases in foliar chlorophyll contents (Kyparissis, Petropoulou & Manetas 1995). However, in mature leaves, there was a N-related overall decline in chlorophylls, but essentially no day-to-day or week-to-week fluctuations in leaf chlorophyll and Chl/N ratio. In fact, chlorophyll and Chl/N versus Qint relations of mature leaves were best correlated with the average integrated quantum flux density during leaf development (Fig. 9). This suggests that the kinetic constants for the acclimation of thylakoid protein stoichiometry are significantly longer than days or weeks for leaves of northern temperate trees. Although it is widely acknowledged that foliar acclimation responses are more rapid in grass and herb species, a similar time-independence of Chl/N versus light relations has previously been reported for the herb Medicago sativa canopy (Evans 1993).
Development of leaf photosynthesis capacities at different light availabilities: does it end up with optimality?
The rapid increase of leaf photosynthetic capacities in developing leaves (Fig. 10) agrees with previous observations (Jurik 1986a; Koike 1990; Reich et al. 1991; Hamerlynck & Knapp 1996; Wilson et al. 2000). These rapid modifications are partly associated with increased MA (Fig. 3, Miyazawa, Satomi & Terashima 1998) that brings about larger nitrogen contents per unit area. Fast developmental changes are also dependent on enhanced nitrogen partitioning in rate limiting proteins of photosynthetic machinery (Fig. 11). Increases in leaf nitrogen investments in bioenergetics (Fig. 11) and in Rubisco (insets in Fig. 11) modify foliar photosynthesis capacity three-fold, while increases in MA increase leaf nitrogen contents by 1.2- to 1.5-fold, demonstrating that changes in nitrogen partitioning alter more importantly the early season leaf photosynthesis rates than anatomical modifications.
Apart from the relevance of changes in leaf nitrogen partitioning for the development of photosynthetic activity of the entire canopy (11, 12), it is important that there is also a large canopy gradient in the development rates of foliar photosynthesis. While nitrogen partitioning characteristics changed simultaneously in high and low light-developed leaves (10, 11), canopy differences in MA changes were primarily responsible for the canopy gradient in the rate of development of leaf photosynthetic capacity (Fig. 10a & b). This concurs with the evidence demonstrating that the variation in photosynthetic capacity within the canopy light gradients results from accumulation of photosynthetic tissue per unit leaf area with increasing Qint, that is primarily associated with modifications in MA (Niinemets & Tenhunen 1997; Le Roux et al. 2001; Meir et al. 2002).
According to the ‘full acclimation’ hypothesis (Field 1983; Farquhar 1989; Badeck 1995), MA (or nitrogen) versus Qint relationship should go through the origin for optimal partitioning of leaf resources. However, there is always a certain minimum MA that differs between species (Kull & Niinemets 1993; Niinemets et al. 1998; Meir et al. 2002), and may vary within species (e.g. Niinemets & Tenhunen 1997) such that this kind of ‘full optimality’ is not possible (Gutschick & Wiegel 1988). Nevertheless, our study demonstrated that the light use efficiency for biomass accumulation was essentially constant for all leaves in the canopy. Although we cannot conclusively rule out the influence of previous year light environment on leaf development, our data seem to support the hypothesis that structural adjustments during leaf growth do occur in proportion with Qint.
To assess whether foliar photosynthetic capacities satisfy the same optimality criterion, we calculate the light use efficiency for Jmax;A changes (χJ, µmol mol−1 s−1) as the slope of Jmax;A versus DB (DB range of 0–40) divided by average integrated quantum flux density (Qint). The values of χJ−0.24 ± 0.06 µmol mol−1 s−1 (± SE determined from the standard error of the regression slope) for the upper, and 0.35 ± 0.10 µmol mol−1 s−1 for the lower canopy leaves of P. tremula, and 0.34 ± 0.12 µmol mol−1 s−1 for the upper, and 0.24 ± 0.11 µmol mol−1 s−1 for the lower canopy leaves of T. cordata– were similar throughout the canopy. Analogous constancy was also observed for Vcmax;A acclimation (data not shown). These observations collectively indicate that temporal modifications in foliar photosynthetic capacity are proportional to intercepted integrated quantum flux density, and as such, support the optimality argument. Even leaf photosynthetic capacity develops in proportion with Qint, the whole canopy photosynthesis profiles are not optimized for a given total biomass in leaves, because the leaves have an initial (Fig. 3) or minimum (Meir et al. 2002) MA.
From a general perspective, a strong positive correlation between the changes in MA and foliar photosynthetic capacity is observed across the deciduous tree species (Fig. 13), demonstrating that the rate of development in MA may be employed as a universal index for early seasonal modifications in foliar photosynthetic capacity. Although the plasticity for changes in nitrogen partitioning to integrated quantum flux density may vary between the species (Niinemets & Tenhunen 1997; Le Roux et al. 2001), the general relationship obtained across species grown in sites of varying temperature and water limitations as well as incident radiation (Fig. 13) further demonstrates that changes in MA provide the major way to reach a correspondence between leaf environment and photosynthetic capacity in tree leaves (Niinemets & Tenhunen 1997; Evans & Poorter 2001). Given that increases in MA result both in a larger photosynthetic biomass per unit leaf area, and a lower internal liquid-phase resistance to CO2 diffusion (Terashima, Miyazawa & Hanba 2001), such an important role of MA is not unexpected.
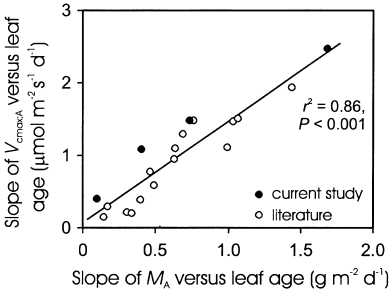
Coordinated developmental changes in maximum Rubisco carboxylase activity per unit area (Vcmax;A) and leaf dry mass per unit area (MA) in temperate deciduous trees in early season (0–40 d after bud-burst): correlation between the rate of Vcmax;A development (slope of Vcmax;A versus DB) and the rate of MA development (slope of MA versus DB). Data were derived from the current study (P. tremula, T. cordata), and Hamerlynck & Knapp (1996; Quercus macrocarpa, Q. muehlenbergii), Jurik (1986a, b; Acer saccharum, Fagus grandifolia, Q. rubra), Oleksyn et al. (2000; Betula pendula), Reich et al. (1991; A. rubrum, Q. ellipsoidalis), Schulte (1993; F. sylvatica), Wilson et al. (2000; A. rubrum, Q. alba). Data were fitted by a linear regression.
The synthesis depicted in Fig. 13 included tree species that produce only one leaf flush in the beginning of season. However, recent evidence demonstrates that MA may drive the canopy leaf photosynthetic adjustment also in dynamic situations when the lower leaves become gradually shaded by upper leaves (Walcroft et al. 2002) further enhancing the generality of our conclusion.
Mid-seasonal changes in leaf photosynthesis capacities
Day-to-day fluctuations in Qint in tree canopies have motivated construction of dynamic tree leaf acclimation models (Kull & Kruijt 1999). However, such models have not been tested with field data. We observed a general weak trend of decreasing foliar photosynthetic capacity in fully mature leaves (Fig. 10). A similar summer decline in photosynthetic capacity has been noted previously (Wilson et al. 2000, 2001). In our data, this was explained by decreases in foliar nitrogen contents rather than by day-to-day differences in leaf light environment. In general, the plasticity for alterations in foliar photosynthetic capacity after changes in Qint decreases with increasing leaf age (Frak et al. 2001; Yamashita, Koike & Ishida 2002). Minor changes in photosynthetic capacity of mature leaves after large changes in leaf light environment have been observed, especially if the transfer to a new light environment occurred shortly after leaf maturation (Naidu & DeLucia 1997; Frak et al. 2001). In our study, no such modifications were evident, possibly because the time-constants for changes in photosynthetic capacity are larger than the duration of significant light fluctuations in the field. Furthermore, part of the changes in photosynthetic capacity and nitrogen in mature leaves after alterations of Qint (Pearcy & Sims 1994; Naidu & DeLucia 1997; Frak et al. 2001) are apparently not directly associated with light-dependent re-allocation of leaf resources, but may result from shifts in timing of leaf senescence (Hidema et al. 1992; Mae et al. 1993). This evidence along with our measurements suggest that foliar photosynthesis rates of mature leaves of temperate deciduous trees have a limited capacity for adjustment to changed light environments, inherently constraining the optimality of canopy photosynthesis.
CONCLUSIONS
The development of leaf photosynthetic machinery may continue for more than 30 d after bud-burst (Miyazawa & Terashima 2001), implying that ecosystem-level estimates of photosynthetic productivity strongly depend on accurate understanding of time-dependent changes in the distribution of photosynthetic capacity along the canopy (Wilson et al. 2001). Early season leaf development and leaf adjustment to canopy light gradients is associated with a series of anatomical, chemical and physiological alterations. Our study demonstrates that the rates of developmental changes in MA and leaf photosynthetic capacity per unit intercepted quantum flux density are essentially constant for the entire canopy in northern temperate tree species. This is in agreement with the optimization of canopy photosynthesis via reallocation of resources to achieve a proportionality between the intercepted light and MA. However, leaves always have a finite MA, and nitrogen content. Due to the existence of the light-independent component of MA (the minimum MA, sensuMeir et al. 2002), ‘full optimization’, implying a proportionality between photosynthetic capacity and integrated quantum flux density for all leaves in the canopy at any fixed point of time during the growing season, is principally not possible. Yet, knowing the initial MA, the apparent constancy of acclimation rate per intercepted light allows one to predict the canopy gradients of foliar photosynthetic capacity from early season leaf Qint values.
Our study also demonstrates that foliar photosynthetic capacity is less variable in field conditions than thought previously (e.g. Kull & Kruijt 1999). Leaf dry mass per unit area, chlorophyll and photosynthesis of mature leaves are mainly determined by the light availability during leaf development, and these characteristics are essentially unaffected by natural fluctuations in above-canopy Qint during the season. The constancy of the acclimation state of foliar photosynthetic apparatus in mature tree leaves significantly simplifies estimation of seasonal carbon balance of forest canopies.
ACKNOWLEDGMENTS
We thank Bart Kruijt, Steve Long and anonymous reviewers for their insightful comments on the manuscript, Wolfgang Bilger, Urmas Kalla, Andres Kink, Pille Mänd, Boris Niinemets, Eve Niinemets, Anu Sõber, Jaak Sõber and Kalle Sõber for helping us in the field and laboratory, and Anne Jõeveer for providing unpublished solar radiation data for Tõravere Actinometric Station. The study was partly supported by the Estonian Science Foundation (grants 4584 and 5466) and the Estonian Ministry of Education and Science (grant 0182468As03).
REFERENCES
APPENDIX
Definition of abbreviations
| A (µmol m−2 s−1) | net assimilation rate |
| Chl/N (mol mol−1) | chlorophyll to N ratio |
| Chl A (mmol m−2) | chlorophyll content per unit area |
| Chl M (µmol g−1) | chlorophyll content per unit dry mass |
| C i (µmol mol−1) | intercellular CO2 mole fraction |
| D B (d) | days from bud-burst |
| F B (g g−1) | fraction of leaf nitrogen in rate-limiting proteins of photosynthetic electron transport |
| F R (g g−1) | fraction of leaf nitrogen in Rubisco |
| I B | average fraction of potentially available direct integrated daily quantum flux density |
| I D | average fraction of penetrating diffuse integrated daily quantum flux density |
| J max;A (µmol m−2 s−1) | capacity for photosynthetic electron transport per unit area |
| J max;M (µmol g−1 s−1) | capacity for photosynthetic electron transport per unit dry mass |
| J mc (mol (mol cyt f)−1 s−1) | capacity for photosynthetic electron transport per unit cytochrome f |
| M A (g m−2) | leaf dry mass per unit area |
| N A (g m−2) | leaf nitrogen content per unit area |
| N M (g g−1) | foliar nitrogen content per unit dry mass |
| Q (µmol m−2 s−1) | photosynthetically active quantum flux density (400–700 nm) |
| Q D(D) (mol m−2 d−1) | daily integrated photosynthetic quantum flux density for day D |
| Q int (mol m−2 d−1) | average integrated daily photosynthetic quantum flux density |
| R G (MJ m−2) | global solar radiation |
| Rubisco | Ribulose 1,5-bisphosphate carboxylase/oxygenase |
| V cmax;A (µmol m−2 s−1) | maximum carboxylase activity of Rubisco per unit area |
| V cmax;M (µmol g−1 s−1) | maximum carboxylase activity of Rubisco per unit dry mass |
| V cr (µmol g−1 s−1) | specific activity of Rubisco |
| α (mol mol−1) | initial quantum yield of photosynthetic electron transport for an incident light |
| χ J (µmol mol−1 s−1) | initial rate (DB range of 0–40) of increase of Jmax;A during leaf development per unit Qint |
| χ M (g mol−1) | initial rate of increase of MA (ΦM) per unit Qint |
| θ | leaf absorptance for photosynthetically active quantum flux density (400–700 nm) |
| Φ PSII (mol mol−1) | effective quantum yield of photosystem II |
| J M (g m−2 d−1) | slope of MA versus DB (DB range of 0–40) |


