Mitochondrial degradation in acetic acid-induced yeast apoptosis: the role of Pep4 and the ADP/ATP carrier
Summary
We have previously shown that acetic acid activates a mitochondria-dependent death process in Saccharomyces cerevisiae and that the ADP/ATP carrier (AAC) is required for mitochondrial outer membrane permeabilization and cytochrome c release. Mitochondrial fragmentation and degradation have also been shown in response to this death stimulus. Herein, we show that autophagy is not active in cells undergoing acetic acid-induced apoptosis and is therefore not responsible for mitochondrial degradation. Furthermore, we found that the vacuolar protease Pep4p and the AAC proteins have a role in mitochondrial degradation using yeast genetic approaches. Depletion and overexpression of Pep4p, an orthologue of human cathepsin D, delays and enhances mitochondrial degradation respectively. Moreover, Pep4p is released from the vacuole into the cytosol in response to acetic acid treatment. AAC-deleted cells also show a decrease in mitochondrial degradation in response to acetic acid and are not defective in Pep4p release. Therefore, AAC proteins seem to affect mitochondrial degradation at a step subsequent to Pep4p release, possibly triggering degradation through their involvement in mitochondrial permeabilization. The finding that both mitochondrial AAC proteins and the vacuolar Pep4p interfere with mitochondrial degradation suggests a complex regulation and interplay between mitochondria and the vacuole in yeast programmed cell death.
Introduction
Yeast mitochondria undergo both structural and functional changes and play a key role in the apoptotic death process activated by acetic acid (Ludovico et al., 2002; 2003). Acetic acid induces different ultrastructural mitochondrial alterations in yeast, including mitochondrial swelling, reduction in cristae number and formation of myelinic bodies. Additionally, Saccharomyces cerevisiae cells committed to apoptosis in response to acetic acid display mitochondrial ROS accumulation, a transient hyperpolarization followed by depolarization, and a decrease in the activity of COX affecting mitochondrial respiration. Mitochondria become permeabilized in response to acetic acid, allowing the release of lethal factors like cytochrome c (Ludovico et al., 2002) and yeast AIF (Wissing et al., 2004), thus contributing to the death process. Other mitochondrial proteins also affect the final cell fate, including those involved in fission/fusion (Fannjiang et al., 2004) and homologues of the components of mammalian permeability transition pore (Pereira et al., 2007).
Mitochondrial degradation following induction of apoptosis is a common feature in mammalian cells (reviewed in Tolkovsky et al., 2002). This event usually occurs through an autophagic process that shows selectivity for mitochondria, termed mitophagy (Lemasters, 2005). It is not known how the damaged mitochondria in a cell are selectively removed, but recent evidence supports the view that mitochondria permeability transition (MPT) could be the trigger for this removal (Rodriguez-Enriquez et al., 2006; Kim et al., 2007). The role of mitochondrial degradation in cell death, either by a selective or non-selective autophagic process, is still unclear. It has been proposed it has a cytoprotective function, because it allows the removal of deleterious ROS-producing mitochondria and hinders the release of pro-apoptotic proteins to the cytosol. On the other hand, the catabolism of dysfunctional organelles could facilitate the apoptotic process by preventing an energy drain caused by defective chemiosmotic coupling (when the MPT pore opens, ions equilibrate between the matrix and cytosol), while at the same time providing a source of ATP generation (Wallace, 2005; Maiuri et al., 2007; Terman et al., 2007).
The accumulation of damaged mitochondria is considered to underlie a wide range of age-related disorders, various forms of cancer and late-onset genetic diseases (Zeviani and Carelli, 2007; Zhang and Qi, 2008). Thus understanding how mitochondria are degraded might unravel attractive targets for the development of novel therapeutics for different diseases.
Mitochondrial degradation in yeast cells undergoing apoptosis has been previously described (Fannjiang et al., 2004). In yeast, selective removal of mitochondria was reported following heterologous expression of Bax (Kissova et al., 2006), mitochondrial dysfunctions (Priault et al., 2005), osmotic swelling (Nowikovsky et al., 2007) and in stationary phase cells (Tal et al., 2007). Removal of mitochondria is not always dependent on the autophagic machinery (Kissova et al., 2006), and the outcome in terms of survival obtained by blocking mitochondrial degradation varies with the stimulus used (recently reviewed in Tolkovsky, 2009).
In this work, we proposed to study the mechanism responsible for mitochondrial degradation during acetic acid-induced apoptosis and to assess the role of Pep4p and the ADP/ATP carrier (AAC) proteins/mitochondrial permeabilization in this process. We found that autophagy is not active during acetic acid-induced apoptosis. Alternatively, the vacuolar protease Pep4p is translocated to the cytosol and, together with the AAC proteins, plays an important role in mitochondrial degradation. We propose that removal of mitochondria can occur in yeast undergoing apoptosis through an autophagy-independent pathway involving the vacuolar protease Pep4p and the mitochondrial AAC proteins. Moreover, we propose that the AAC proteins might relay a signal of mitochondrial dysfunction, targeting their destruction.
Results
Autophagy is not activated during acetic acid-induced apoptosis
Mitochondria play a key role in yeast apoptotic death activated by different lethal stimuli (reviewed in Eisenberg et al., 2007; Pereira et al., 2008), in particular by acetic acid (Ludovico et al., 2002), and are fragmented and subsequently removed in a late phase of the death process (Fannjiang et al., 2004). It was our purpose to assess the contribution of autophagy to the process of mitochondrial degradation that occurs during acetic acid-induced apoptosis. To this end, we used an established biochemical method that follows the delivery of the vacuolar Pho8Δ60p, a truncated form of the yeast vacuolar alkaline phosphatase (ALP) lacking the N-terminal 60 amino acids (Noda et al., 1995). This truncated protein accumulates in the cytosol as a zymogen and is delivered to the vacuole exclusively by an autophagic process, where the active form of the enzyme is generated by proteolytic cleavage (Noda et al., 1995). Therefore, in cells only expressing this truncated form of the enzyme, the level of ALP activity reflects the level of autophagy.
A S. cerevisiae W303 strain in which the chromosomal PHO8 gene was replaced with pho8Δ60, was incubated in the presence of 180 mM acetic acid and ALP activity determined after 0, 1 and 3 h treatment. We observed that there was no increase in ALP activity following acetic acid treatment, indicating there was no transport of material into the vacuole (Fig. 1A). Nitrogen-starved cells were used as a positive control for autophagy induction and displayed a more than twofold increase in ALP activity (Fig. 1A). Atg5p belongs to the autophagic pathway in yeast, where it takes part of a cytosolic complex essential for the autophagosome formation/completion, and its disruption results in defective macroautophagy (Kametaka et al., 1996; George et al., 2000). We therefore used the atg5Δ strain as a negative control for autophagy induction. As expected, there was no activation of ALP in nitrogen-starved cells without ATG5. The basal level of ALP activity found in control cells (t0) of both the W303 and atg5Δ strains is probably due to Pho13p, a cytosolic variant of ALP that is constitutively active and sensitive to acid pH (Tuleva et al., 1998). Consistently, acetic acid leads to a reduction of this activity after 3 h of treatment (Fig. 1A).
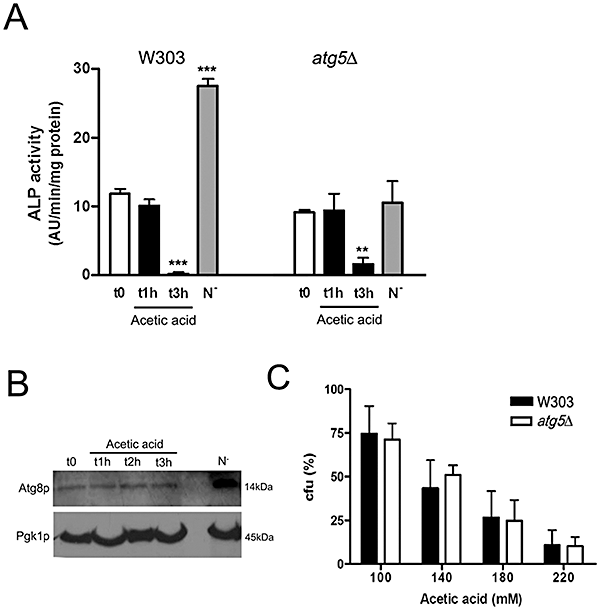
Acetic acid does not induce autophagy.A. ALP activity in S. cerevisiae W303 or atg5Δ cells (negative control for autophagy induction) carrying a pho8Δ60 mutation in replacement of wild-type PHO8, after treatment with 180 mM acetic acid for 1 and 3 h. Nitrogen-starved cells (N-) for 15 h were used as a positive control for ALP activity. ALP activities are expressed as fluorescence arbitrary units·min−1 mg−1 protein. Values are means ± SD of four independent experiments. ***P < 0.001, **P < 0.01; unpaired t-test.B. The levels of Atg8p, a protein essential for autophagosome formation, are not increased by acetic acid treatment (180 mM) as verified by Western blot. Increased accumulation of Atg8p was observed for the nitrogen-starved cells (N-, 15 h) used again as a positive control.C. Cell survival of S. cerevisiae W303 and atg5Δ strains (percentage of cfu on YEPDA plates; 100% corresponds to the number of cfu at time 0). Cells were incubated for 200 min with 100–220 mM acetic acid. Values are means ± SD of five independent experiments; P > 0.05 (atg5Δ versus W303 cells); two-way ANOVA.
We also assessed autophagy induction by monitoring the amount of Atg8p. This protein is essential for autophagosome formation and its increase in most of the cellular contexts is a diagnostic marker of autophagy (Kirisako et al., 1999). In accordance, we observed an increase in the amount of Atg8p in nitrogen-starved cells used as a positive control (Fig. 1B). In contrast, we did not observe an increase in Atg8p during acetic acid treatment (Fig. 1B), consistent with the lack of ALP activity. Cell viability (clonogenicity) in response to acetic acid was also not affected by an ATG5 deletion further indicating that autophagy is not involved (Fig. 1C).
A typical, although not exclusive, morphological alteration of mitochondria during apoptosis, either in higher eukaryotes or yeast, is the change from a tubular network to a punctuated pattern. We observed a rapid fragmentation of the network into small round units in response to acetic acid, using W303 and atg5Δ cells expressing a GFP fused downstream of the targeting sequence of mitochondrial citrate synthase (Okamoto et al., 1998) (Fig. 2A). These fragmented mitochondria persisted for some time until the fluorescence started to diffuse throughout the cell. No discrete vacuolar localization following acetic acid treatment was ever observed for both strains. In contrast, during nitrogen starvation, W303 cells exhibited an evident green fluorescence inside the vacuoles, pointing to the internalization of mitochondria due to autophagy activation (Fig. 2B) as described (Kissova et al., 2004). Analysis of acetic acid treated cells by transmission electron microscopy confirmed that mitochondria were not internalized by the vacuole (Fig. S1).
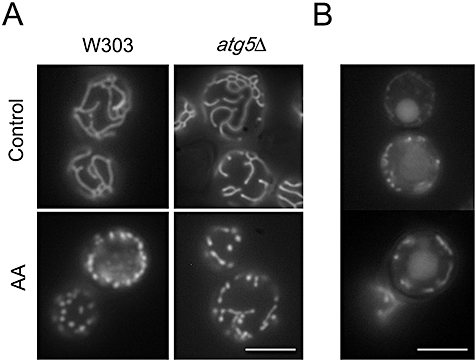
Acetic acid-induced mitochondrial fragmentation is independent of the autophagic protein Atg5p and fragmented mitochondria are not internalized by the vacuole in acetic acid-treated cells.A. W303 and atg5Δ cells expressing mitochondrial matrix-targeted GFP (mtGFP) were treated with 180 mM acetic acid for 30 min.B. W303-1B cells expressing mtGFP, under nitrogen starvation conditions for 10 h. Bar, 4 µm.
Pep4p translocates from the vacuole to the cytosol in response to acetic acid
Saccharomyces cerevisiae Pep4p, or proteinase A, is a pepsin-like aspartic protease found in the yeast vacuole with homology to human cathepsin D. Pep4p was shown to translocate from the yeast vacuole to the cytosol during hydrogen peroxide- (Mason et al., 2005) and actin cytoskeleton stabilization-induced apoptosis (Gourlay and Ayscough, 2006). This was achieved using a Pep4–EGFP fusion (Mason et al., 2005), which allowed visualization of the protein distribution in live cells. To address whether acetic acid could also trigger the release of vacuolar Pep4p we used the same Pep4–EGFP fusion. As expected, the Pep4–EGFP fusion protein localized specifically to the vacuole in non-treated healthy cells (Fig. 3). After 60 min treatment with 180 mM acetic acid, an extra-vacuolar fluorescence started to be observed in some cells, indicative of the presence of Pep4p in the cytosol (Fig. 3). Transmission electron microscopy analysis showed that vacuolar membrane integrity was preserved (Fig. S1). In addition, the Pep4p release was observed in cells which maintained plasma membrane integrity as assessed by propidium iodide (PI) co-staining (Fig. 3). Together, these observations are consistent with data obtained with mammalian cells showing that there is a partial release of cathepsins from the lysosomes in the early phase of apoptosis (Brunk et al., 1995; Bidere et al., 2003).
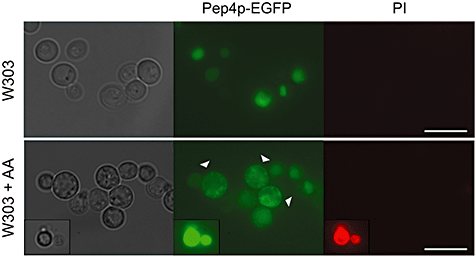
Pep4p translocates from the vacuole to the cytosol during acetic acid-induced apoptosis. Release of the protease Pep4p from the vacuole due to acetic acid treatment (AA; 180 mM, 60 min) was assessed in living cells using a W303 strain expressing a PEP4–EGFP fusion protein. Upper panels show control cells with the Pep4p–EGFP fluorescence localized in the vacuole (visible in the differential interference contrast) and the lower panels show some cells with the PEP4–EGFP fusion already in the cytosol (indicated by arrow heads). Release of Pep4p precedes loss of plasma membrane integrity as assessed by propidium iodide (PI) staining. In the insert we can see a dead cell with a strong bright unspecific green staining that also stains with PI. Bar, 10 µm.
Pep4p is involved in mitochondrial degradation and has a pro-survival role during acetic acid-induced apoptosis
To assess the role of Pep4p in mitochondrial degradation, we compared a strain disrupted in the gene PEP4 (Marques et al., 2006) with the respective W303 parental strain, and a W303 strain transformed with pDP34 (empty vector, multicopy) with the same strain transformed with pDP34-PEP4 (Rupp and Wolf, 1995) to overexpress PEP4. Mitochondrial degradation in these strains was assessed by monitoring the loss of GFP fused downstream of the targeting sequence of mitochondrial citrate synthase (Okamoto et al., 1998) by flow cytometry. Detection of mitochondrial degradation through matrix-targeted GFP allows the assessment of protein abundance in whole live cells, and reflects the balance between protein synthesis and degradation. Therefore, the observation of a decrease of GFP fluorescence could be attributed to the inhibition of protein synthesis rather than mitochondrial degradation. This hypothesis was precluded by the observed maintenance of galactose inducible GFP cell fluorescence until 14 h after blockage of GFP synthesis by glucose (data not shown). Thus, we assumed that a decrease in total GFP fluorescence caused by acetic acid mainly reflects protein degradation. Additionally, decrease of GFP fluorescence levels as a reliable measure of mitochondrial degradation was corroborated by biochemical evidence through Western blot analysis (Fig. S2). Figure S3 shows a typical histogram obtained for each strain after treatment with acetic acid, which allowed the quantification of the percentage of cells displaying loss of mitochondrial fluorescence over time. We observed a delay in GFP disappearance in the PEP4-deleted strain and a slight acceleration in GFP loss when PEP4 was overexpressed (Fig. 4), indicating an increase and a decrease in mitochondrial degradation respectively. We also assessed the effect of acetic acid (100–220 mM) on cell viability in the PEP4-deleted and PEP4-overexpressing strains. We observed a decrease in the cell survival of pep4Δ compared with the W303 strain, and an increase in the W303 pDP34-PEP4 strain compared with W303 pDP34 (Fig. 5). We therefore conclude that Pep4p and the ensuing degradation of mitochondria have a pro-survival role during acetic acid-induced apoptosis. In addition, changes in GFP disappearance in PEP4-deleted and overexpressing strains were not the result of a slower and faster death rate, respectively.
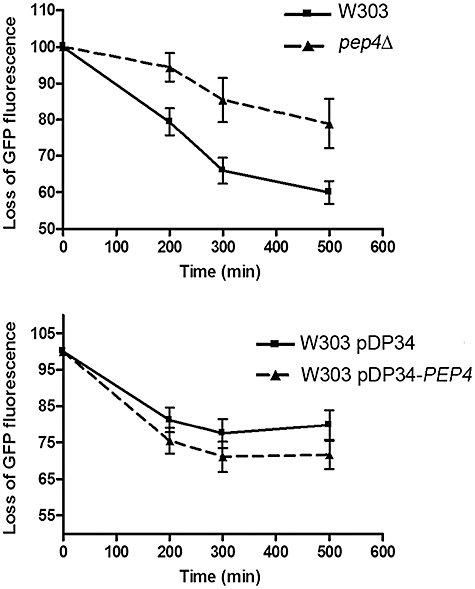
Pep4p is involved in mitochondrial degradation triggered by acetic acid. Quantification of the percentage of cells displaying GFP loss over treatment with acetic acid (180 mM) for strains W303, pep4Δ, W303 pDP34 and W303 pDP34-PEP4 transformed with a mitochondrial matrix-targeted GFP. Loss of GFP fluorescence was used as a measure of mitochondrial degradation. Values are means ± SD of four independent experiments. P < 0.001 (pep4Δ versus W303), P < 0.05 (W303 pDP34-PEP4 versus W303 pDP34); two-way ANOVA.
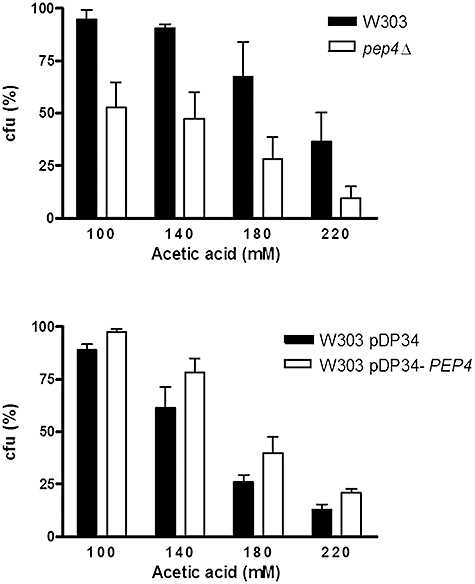
Pep4p has a pro-survival role during acetic acid-induced apoptosis. Cell survival of S. cerevisiae strains W303 and pep4Δ (upper image) and W303 pDP34 and W303 pDP34-PEP4 (lower image) (percentage of cfu on YEPDA plates; 100% corresponds to the number of cfu at time 0). Strains were incubated for 200 min with 100–220 mM acetic acid. Values are means ± SD of four independent experiments; P < 0.001 (pep4Δ versus W303 cells), P < 0.05 (W303 pDP34 versus W303 pDP34-PEP4); two-way ANOVA.
In order to assess if deletion of PEP4 affected the mode of cell death, we monitored cytochrome c release, superoxide accumulation, chromatin condensation, and loss of plasma membrane integrity. During acetic acid treatment (180 mM), the pep4Δ mutant, displayed cytochrome c release (Fig. 6A) and superoxide accumulation similar to the wild-type (Fig. S4). However, the mutant strain exhibited earlier emergence of chromatin condensation (Fig. 6B) and loss of plasma membrane integrity (Fig. 6C). These data indicate that the absence of Pep4p accelerates apoptosis and secondary necrosis.
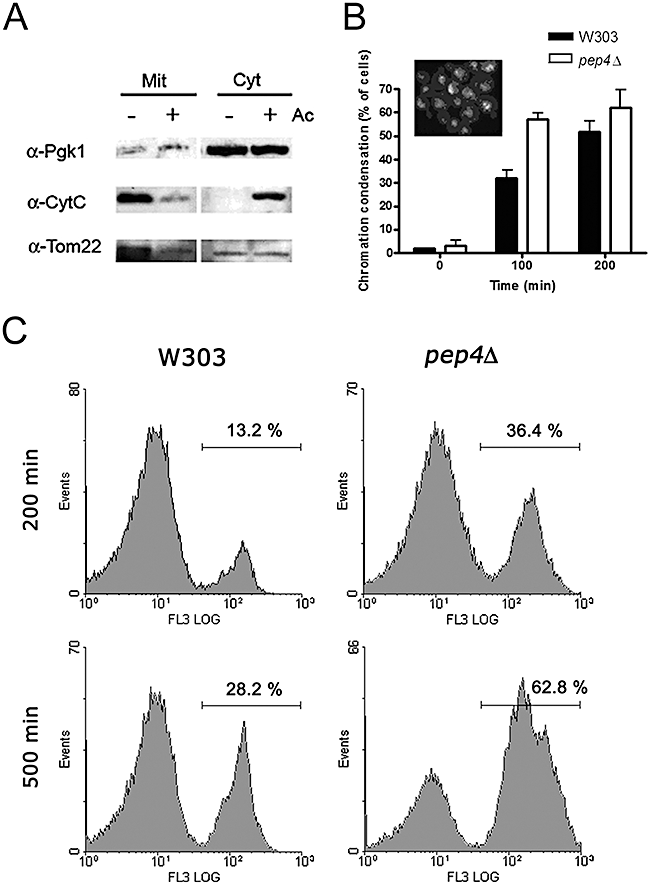
pep4Δ strain displays cytochrome c release and an earlier emergence of chromatin condensation and loss of plasma membrane integrity than the wild-type strain. Cultures of W303 and pep4Δ were grown (until OD 1) and treated with 180 mM acetic acid in YEPGal for all the experiments.A. Cytochrome c detected by Western blot in mitochondria and post-mitochondrial supernatants of pep4Δ cells obtained after 200 min treatment. Tom22p from outer mitochondrial membrane and cytosolic phosphoglycerate kinase (Pgk1p) were also assessed.B. Quantification of chromatin condensation in W303 and pep4Δ mutant. The insert shows a photomicrograph of pep4Δ cells stained with DAPI as an example of chromatin condensation. Chromatin condensation in the pep4Δ mutant is significantly enhanced, when compared with the W303 strain. P < 0.05 (pep4Δ versus W303 cells); two-way ANOVA. At time 100 min, the percentage of cfu in the W303 and pep4Δ strains was 50% and 3.9% respectively.C. Percentage of cells displaying loss of plasma membrane integrity assessed by flow cytometry after 200 and 500 min treatment with acetic acid Images show monoparametric histograms of PI fluorescence (FL3 area (log)). Data represent one of four independent experiments.
Absence of AAC proteins is also associated with a decrease in the degradation of mitochondria
Because we have previously reported that the absence of the inner mitochondrial membrane AAC impairs mitochondrial outer membrane permeabilization and cytochrome c release (Pereira et al., 2007), we questioned whether these proteins could also have a role on the onset of mitochondrial degradation. We therefore characterized mitochondrial degradation in AAC-deleted cells upon acetic acid-induced apoptosis. Mitochondrial degradation in aac1/2/3Δ cells (lacking the three yeast isoforms of the ATP/ADP carrier) was assessed as in the pep4Δ strain by monitoring loss of GFP fluorescence by flow cytometry. We observed a delay in GFP disappearance in the AAC-deleted strain (Fig. 7A). Additionally, we also validated the use of mitochondrial matrix-targeted GFP fluorescence loss to monitor mitochondrial degradation by Western blot, in the wild-type and aac1/2/3Δ strains (Fig. 7B). For this purpose we monitored the degradation of two outer mitochondrial proteins, because we have previously shown that acetic acid triggers a selective and faster degradation of cytochrome c and the inner mitochondrial membrane protein Atp2p in the aac1/2/3Δ mutant (Pereira et al., 2007). Western blots of total protein extracts collected at increasing times following acetic acid treatment showed that the degradation of Por1p and Tom22p was delayed in the aac1/2/3Δ mutant, in comparison with W303 strain (Fig. 7B). These results support our interpretation that AAC proteins, besides Pep4p, are required for efficient mitochondrial degradation.

Mitochondrial degradation is impaired in the absence of AAC proteins.A. Quantification of mitochondrial degradation for W303 (full line) and aac1/2/3Δ (dotted line) mutant along treatment with 180 mM acetic acid, assessed by loss of GFP fluorescence by flow cytometry. Values are means ± SD of five independent experiments. *P < 0.05; unpaired t-test.B. Western blots for Tom22p and Por1p from W303 and aac1/2/3Δ mutant cell lysates prepared at the indicated times after treatment with 180 mM acetic acid as a measure of mitochondrial degradation. Quantification is shown below. Cytosolic phosphoglycerate kinase (Pgk1p) level was used to normalize protein amount loaded on the gel. Values are means ± SD of three independent experiments; P < 0.001 for Porin1 and P < 0.05 for Tom22 (aac1/2/3Δ versus W303 cells); two-way ANOVA.C. Release of the Pep4p protease from the vacuole due to acetic acid treatment (AA; 180 mM, 60 min) was assessed in aac1/2/3Δ cells expressing a PEP4–EGFP fusion protein. Release of PEP4–EGFP to the cytosol (indicated by the arrow heads) was not affected by the absence of AAC proteins. Bar, 10 µm.
We next investigated whether the lower degradation of aac1/2/3Δ mutant mitochondria could be due to a hindrance in the release of Pep4p from the vacuole. The aac1/2/3Δ strain was therefore transformed with the Pep4p–EGFP fusion protein. In aac1/2/3Δ cells without acetic acid treatment, Pep4p–EGFP localizes correctly to the vacuole (Fig. 7C). Upon acetic acid treatment, the Pep4p–EGFP fusion protein translocates to the cytosol in a similar extent as that observed for the wild-type (Fig. 7C).
Absence of AAC and Pep4 proteins is associated with the formation of mitochondrial clusters during acetic acid-induced apoptosis
The possibility that the delayed mitochondrial degradation in both aac1/2/3Δ and pep4Δ strains could be associated with altered mitochondrial morphology was ascertained. Treatment of these mutant strains with acetic acid leads to a very fast (less than 30 min) disorganization of the typical tubular network, similarly to the W303 strain. Notably, both mutant strains displayed a high percentage of cells (almost 70% in the culture) with a clustered mitochondrial morphology after treatment with acetic acid. Figure 8A illustrates cells displaying a clustered mitochondrial morphology as well as their respective quantification. Accordingly, the percentage of clusters in the culture decreased when PEP4 was overexpressed (Fig. 8A). Formation of mitochondrial aggregates was also observed during hydrogen peroxide-induced apoptosis (Fig. 8B), indicating that this peculiar morphology is not an effect restricted to acetic acid treatment. We decided to further investigate if this altered mitochondrial morphology corresponded to dysfunctional mitochondria. We could observe that mitochondrial clusters were still able to accumulate the membrane potential-sensitive probe DiOC6(3) or Mitotracker Red CMXRos in most acetic acid-treated cells, indicating that clustered mitochondria were still functional. Figure 8C illustrates the colocalization of green and red fluorescence in aac1/2/3Δ cells expressing mt-GFP and stained with Mitotracker Red CMXRos. Quantification of mitochondrial membrane potential showed that for longer acid treatments all strains tested (W303, aac1/2/3Δ and pep4Δ) began to depolarize. However, while the W303 strain, as reported by Ludovico et al. (2002), and the pep4Δ strain displayed an initial transient hyperpolarization in response to acetic acid, the same did not occur for the aac1/2/3Δ mutant (Fig. 8D). This observation raises the possibility that a causal relation may exist between hyperpolarization and cytochrome c release.
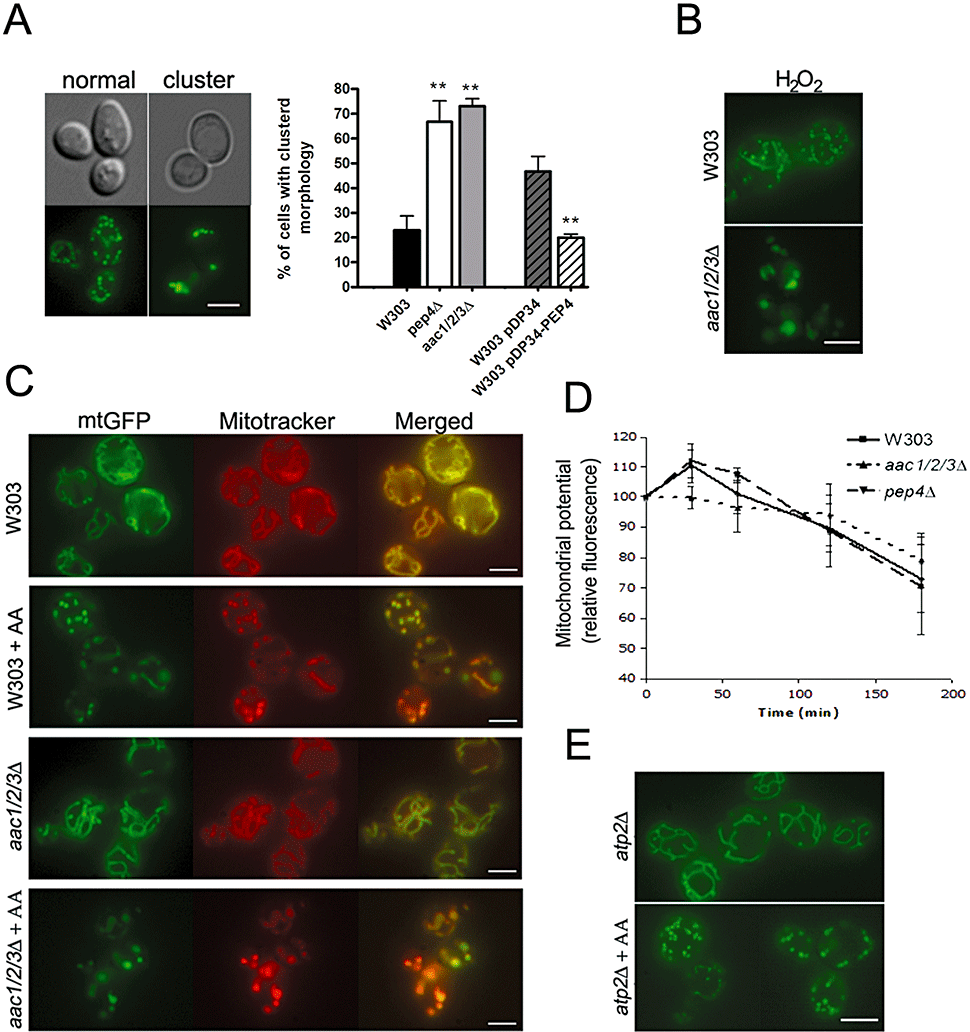
aac1/2/3Δ and pep4Δ strains show alteration from a tubular mitochondrial morphology to a clustered pattern upon acetic acid treatment.A. Photomicrograph obtained by differential interference contrast and fluorescence microscopy illustrating the alteration of the tubular mitochondrial network to a clustered mitochondrial morphology after acetic acid treatment (180 mM, 60 min) and quantification of the percentage of cells displaying the clustered morphology for strains W303, pep4Δ, aac1/2/3Δ, W303 pDP34 and W303 pDP34-PEP4. Values are means ± SD of four independent experiments with at least 300 cells counted per sample. **P < 0.01; unpaired t-test.B. W303 and aac1/2/3Δ cells treated with H2O2 (3 mM, 30 min). H2O2 treatment also leads to formation of mitochondria aggregates in aac1/2/3Δ. Bar, 4 µm.C. Mitochondrial membrane potential in S. cerevisiae W303 and aac1/2/3Δ cells, non-treated and treated with acetic acid (AA; 180 mM, 30 min), was examined by Mito-Tracker Red staining (middle panels) and compared with mitochondrial matrix-targeted GFP (left panels) in the merged images (right panels). Bar, 4 µm.D. Quantification of mitochondrial membrane potential (relative fluorescence values) for strains W303, aac1/2/3Δ and pep4Δ along treatment with acetic acid (180 mM) assessed by flow cytometry using the probe DiOC6(3). Fluorescence at t0 was considered as 100%. The results presented are the mean values of at least three independent experiments.E. atp2Δ strain non-treated and treated with acetic acid (AA; 180 mM, 30 min). atp2Δ cells do not form clusters. Bar, 4 µm.
To discard the possibility that mitochondrial morphology in the aac1/2/3Δ mutant could be a consequence of low mitochondrial energetic levels (AAC proteins exchange cytosolic ADP for mitochondrial synthesized ATP across the mitochondrial inner membrane), we monitored mitochondrial morphology changes accompanying death induced by acetic acid in an atp2Δ strain. This mutant is deleted for subunit β of the ATPase complex. We could confirm that the spots originated from the fragmentation of the mitochondrial network in the atp2Δ strain were of normal size and similar to those observed in the W303 strain (Fig. 8E).
Depolymerization of actin filaments disrupts the mitochondrial clusters formed in the absence of AAC and Pep4 proteins
In yeast, mitochondria associate with actin filaments, and depolymerization of these filaments alters the normal mitochondrial morphology giving rise to short tubular or small spherical structures (Boldogh et al., 1998). Latrunculin-A (lat-A) is a drug used for rapid depolymerization of F-actin (Spector et al., 1983). The mitochondrial network was broken within 30 min of treatment with 0.25 mM lat-A (dissolved in DMSO) in W303 and pep4Δ (data not shown) as well as in aac1/2/3Δ mutant cells (Fig. 9A), whereas the same cells treated with an equal volume of DMSO presented no alterations in the mitochondrial network organization. Figure 9A illustrates the effect of lat-A or DMSO addition to acetic acid-treated aac1/2/3Δ cultures (180 mM, 30 min). The percentage of aac1/2/3Δ cells containing clustered mitochondria decreased to about one half (46.4% decrease), while the number of cells containing small spots of mitochondria increased (Fig. 9A, lower panels). In addition, incubation of the cells with lat-A prior to acetic acid treatment also prevented formation of the clusters. Taken together, these results reinforce the idea that clusters are composed of aggregates of mitochondria and show that actin filaments are responsible for the formation and maintenance of such mitochondrial clusters.
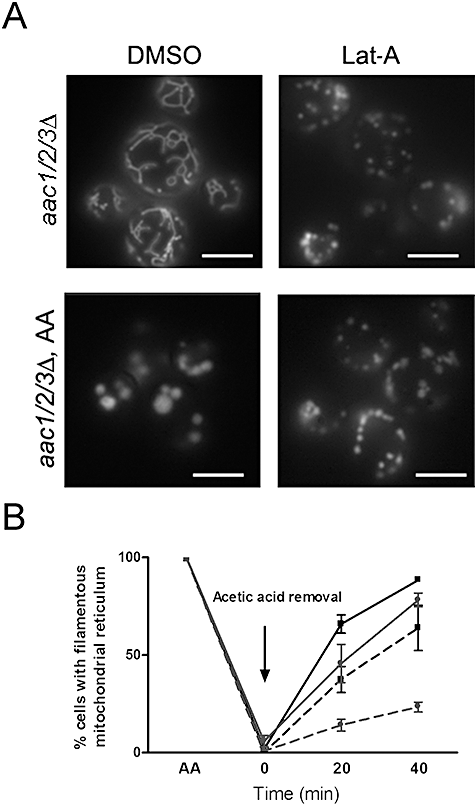
Mitochondrial clusters in the Δaac1/2/3 mutant are disrupted by treatment with latrunculin-A (lat-A), an actin-depolimerizing agent.A. aac1/2/3Δ cells expressing a mitochondrial matrix-targeted GFP were grown until mid exponential phase and non-treated or treated with acetic acid (180 mM, 30 min). DMSO alone (the vehicle) or 0.25 mM lat-A were added to non treated (upper right panel) or acetic acid (AA) treated cells (lower right panel) and incubated for 30 min at 37°C before visualization. Bar, 5 µm.B. At early times of treatment with acetic acid, aac1/2/3Δ clustered mitochondria can be reversed to the original filamentous structures after acetic acid removal, although not as efficiently as the normal fragmented wild-type mitochondria. Cells were treated with 180 mM acetic acid for 30 or 200 min, washed once and incubated in the SC media without acetic acid. Samples were taken after 20 or 40 min of recovery in media without acid. W303 is represented by black lines (with squares) and aac1/2/3Δ by grey lines (with circles); full lines correspond to 30 min and dotted lines correspond to 200 min of acetic acid treatment.
Formation of these clusters appears to be a reversible event. Removal of acetic acid after up to 30 min of treatment allowed an almost full recovery of the tubular shape of the mitochondrial network both in the W303 and aac1/2/3Δ strains, though the recovery of the latter strain was slower than that of the W303 strain (Fig. 9B). For longer periods of incubation with acetic acid, the ability of both strains to recover normal mitochondrial morphology declined, and this was even more apparent in the aac1/2/3Δ mutant, likely due to its altered mitochondrial morphology. These observations further strengthen the idea that the clustered mitochondria induced by acetic acid treatment in aac1/2/3Δ and pep4Δ strains are not internalized by the vacuole and most likely reside in the cytosol, hence allowing for recovery of their filamentous shape.
Discussion
Mitochondrial degradation has been shown to occur in a number of systems following apoptosis induction and usually involves an autophagic process. However, mitochondrial degradation proceeded normally in a strain inactivated for ATG5 during the lens and erythroid cell differentiation (Matsui et al., 2006). Therefore, it has been suggested that degradation system(s) other than autophagy may account for mitochondrial degradation in distinct cellular settings. Our results suggest that this also happens during acetic acid treatment of yeast, because there is no uptake of proteins from the cytosol to the vacuole or an increase in Atg8p, two events typically observed during autophagy. Recently, Pep4p was shown to leave the vacuole during hydrogen peroxide- (Mason et al., 2005) or actin stabilization-induced apoptosis (Gourlay and Ayscough, 2006). In the first case, it was also shown that Pep4p, like its mammalian orthologue cathepsin D (Tang and Wong, 1987), is released without major vacuolar rupture and is involved in nucleoporin degradation (Mason et al., 2005).
We observe that Pep4p is also released from the vacuole during acetic acid-induced apoptosis and has an important role in mitochondrial degradation during the apoptotic process. Whether Pep4p acts directly on mitochondria or activates other proteases remains to be elucidated. In contrast to what we observe for acetic acid treatment, the pep4Δ strain shows a cell survival similar to the wild-type strain when death is induced by H2O2 (Mason et al., 2005), whereas it exhibits a shortened lifespan during chronological ageing (Marques et al., 2006). We demonstrate that deletion of PEP4 and consequent impairment in mitochondrial degradation enhances acetic acid-induced death, while the opposite phenotype is observed for PEP4 overexpression. Therefore, the process of removal of damaged mitochondria apparently has a protective role in acetic acid-treated cells, although it is likely not the only factor affecting cell viability. We have previously described (Pereira et al., 2007) that aac1/2/3Δ glucose-grown cells are more resistant to acetic acid than wild-type cells. However, when the aac1/2/3Δ mutant is grown in galactose medium, the delay in mitochondrial degradation is associated with a cell survival identical to the wild-type, rather than with a higher sensitivity as observed for the pep4Δ mutant. This difference is probably due to the protection afforded to the aac1/2/3Δ mutant by its defect in mitochondrial permeabilization. A protective role for mitochondrial degradation has also been suggested for cells in prolonged stationary phase cultures (Tal et al., 2007). In Bax-induced death, impairment of mitochondrial uptake by the vacuole leads to a higher resistance (Kissova et al., 2006). However, this is due to the switch from a regulated to a necrotic death occurring at a slower rate.
Although the role of mitochondrial degradation in cell death is still unclear, there is a consensus regarding the apparent beneficial effects of degradation of dysfunctional mitochondria for cell survival (Wallace, 2005; Maiuri et al., 2007; Terman et al., 2007). In our model, this beneficial effect is unlikely due to the prevention of the release of pro-apoptotic proteins because significant mitochondrial degradation occurs mainly after mitochondrial permeabilization and cytochrome c release. Removal of damaged mitochondria to avoid ATP consumption (Gellerich et al., 2004) and subsequent necrosis is also not supported by our results, because acetic acid treatment leads to a similar decrease in the ATP pool of both wild-type and PEP4-deleted and overexpressing strains (Fig. S5). Although in the absence of Pep4p we did not observe a significant difference in superoxide accumulation (Fig. S4) or in the levels of oxidized proteins (Fig. S6), we could detect an earlier emergence of chromatin condensation and loss of plasma membrane integrity in response to acetic acid. These observations suggest that the mitochondrial degradation-resistant pep4Δ mutant commits to an accelerated apoptosis associated with an earlier secondary necrosis. Further studies are needed to elucidate the molecular mechanisms underlying the protective role of Pep4p during acetic acid-induced apoptosis.
Because we have previously shown that AAC proteins are required for mitochondrial outer membrane permeabilization and cytochrome c release induced by acetic acid (Pereira et al., 2007), we addressed the role of AAC proteins in mitochondrial degradation. The aac1/2/3Δ strain displays a mitochondrial aggregation pattern associated with a decrease in degradation of mitochondria similar to the pep4Δ mutant. Taking into consideration that overexpression of PEP4 results in a decrease in aggregation associated with an increase in mitochondrial degradation, the results indicate that mitochondrial aggregation is a consequence of the diminished degradation. Moreover, the clustering of mitochondria in the aac1/2/3Δ and pep4Δ mutants seems to be dependent on actin, because disrupting actin filaments also partly disrupts clusters. Additionally, Pep4p is still released from the vacuole in AAC-deleted cells, indicating that the delay in mitochondrial degradation observed in the aac1/2/3Δ mutant is not due to a blockage in the release of this protease, but is associated with a subsequent event. Taken together, these observations suggest that vacuole and mitochondria destabilization, measured by Pep4p and cytochrome c release, respectively, are events in the cell death cascade. Although cathepsin D, the mammalian orthologue of Pep4p, was shown to have a role in cell death by triggering mitochondrial dysfunction and subsequent release of mitochondrial proteins, some studies showed an inhibitory role for cathepsin D in apoptosis (Roberg et al., 1999; Bidere et al., 2003; Boya et al., 2003; Jaattela et al., 2004; Chwieralski et al., 2006; Liaudet-Coopman et al., 2006; Minarowska et al., 2007). Nonetheless, a role for cathepsin D in mitochondrial degradation in mammals has not been assessed so far.
Lysosomes, the mammalian organelle akin to the yeast vacuole, were considered to be only involved in necrotic cell death until recently. Increasing evidence indicates that lysosomes communicate with mitochondria through selective leakage of proteins and activate some forms of apoptotic cell death, while necrosis follows only with massive lysosomal permeabilization (for reviews see Kroemer et al., 2007; Terman et al., 2007). Herein, we demonstrate that the vacuole communicates with mitochondria in yeast cells undergoing apoptosis. The cross-talk between these two organelles when autophagy is inhibited seems to involve a partial release of Pep4p engaged in the proteolytic degradation of mitochondria, rather than an extensive vacuolar permeabilization. Degradation of damaged mitochondria also appears to depend on the mitochondrial AAC proteins through a step downstream of Pep4p release.
In summary, while relevant differences in cellular processes exist between yeast and mammalian cells, our study identifying a novel role for Pep4p and AAC proteins opens new perspectives for an enhanced understanding of the role of vacuole and mitochondria in apoptosis. Because the importance of lysosomes in mammalian cell death is increasingly apparent, our study further reinforces the use of yeast as a valuable model of programmed cell death. Finally, as the accumulation of damaged mitochondria is associated with different human diseases, a deeper understanding of how mitochondrial degradation is activated and regulated during apoptosis can unravel novel attractive targets for the development of apoptosis-based therapies.
Experimental procedures
Strains and plasmids
The following S. cerevisiae strains were used in this study: W303 (MATα, ade2, his3, leu2, trp1, ura3, can1); W303 PHO8Δ60 (Kissova et al., 2004); W303 atg5Δ::KanMX4 (Kissova et al., 2004); W303 atg5Δ::KanMX4 PHO8Δ60 (Kissova et al., 2004); W303 atp2Δ::KanMX4 (Pereira et al., 2007), JL1-3Δ2Δ3 (W303; aac1::LEU2,Δaac2::HIS3,Δaac3::URA3) (Postis et al., 2005) and pep4Δ::HIS3 (Marques et al., 2006). The plasmids used were: pDP34 and pDP34-PEP4 (Rupp and Wolf, 1995) for PEP4 overexpression; pGAL-CLbGFP (Okamoto et al., 1998) and YX232-mtGFP (Westermann and Neupert, 2000) for mitochondria visualization; p416ADH and p416ADH-PEP4–EGFP (Mason et al., 2005) for Pep4p tagging.
Whenever strains were transformed the lithium acetate method (Ito et al., 1983) was used and the resulting transformants were grown in selective media lacking the appropriate amino acids.
Growth conditions and cell death assays
Yeast cells were grown in rich medium [YEPGal; 1% (w/v) yeast extract, 2% (w/v) bactopeptone, 2% (w/v) galactose] or synthetic complete medium [SC; 0.67% (w/v) Bacto-yeast nitrogen base w/o amino acids, 2% (w/v) galactose and 0.2% (w/v) Dropout mix] lacking the appropriate amino acids until exponential phase in an orbital shaker, at 26°C, 160 r.p.m. The strains were harvested and suspended (107 cells ml−1) in the treatment medium consisting of YEPGal or SC at pH 3.0 (set with HCl), containing the appropriate amounts of acetic acid or H2O2 and incubated as described for the growth conditions. For nitrogen starvation assays cells were grown in rich medium overnight, washed twice with distilled sterile water and transferred to nitrogen starvation media. Nitrogen starvation media consisted on 0.67% (w/v) Bacto-yeast nitrogen base w/o amino acids and ammonium sulphate (Difco) and 2% (w/v) glucose. Cells were then incubated at 26°C, 160 r.p.m., for 15 h.
Alkaline phosphatase assay
Alkaline phosphatase activity assays using α-naphthyl phosphate (Sigma) as a substrate were performed as described previously (Nothwehr et al., 1996). Fluorescence intensity was measured at 472 nm (excitation at 345 nm) in a Xenius spectrofluorimeter (Safas). Protein was quantified by the Biuret method and the ALP activities are expressed as fluorescence arbitrary units·min−1 mg−1 protein. ALP activity was measured in non treated cells; cells treated with 180 mM acetic acid (1 or 3 h) and in nitrogen-starved cells (15 h).
Western blot analysis
Preparation of protein samples, SDS-PAGE and Western blots were performed as described previously (Camougrand et al., 2003). The primary antibodies used were rabbit polyclonal anti-yeast cytochrome c (CYC1) antibody (1:1000, custom-made by Millegen), mouse monoclonal anti-yeast phosphoglycerate kinase (PGK1) antibody (1:5000, Molecular Probes), mouse monoclonal anti-yeast porin (POR1) antibody (1:5000, Molecular Probes), goat polyclonal anti-yeast Atg8p (1:250, Santa Cruz Biotechnology), and mouse polyclonal anti-yeast Tom22 (1:15 000, Millegen). Secondary antibodies against mouse, goat IgGs, coupled to horseradish peroxidase (Jackson Laboratories), were used at 1:5000 and revealed by chemiluminescence (ECL, Amersham). Quantification of protein amounts was done using the ImageJ program (NCBI).
Fluorescence microscopy
Mitochondria were visualized using a matrix-targeted GFP, either pGAL-CLbGFP (Okamoto et al., 1998) for strains W303, JL1-3Δ2Δ3, atg5Δ, atp2Δ and pep4Δ, or YX232-mtGFP (Westermann and Neupert, 2000) for strains W303 pDP34 and W303 pDP34-PEP4.
For Pep4p labelling, cells expressing the construction p416ADH–PEP4–EGFP were used. Cells were grown and treated as described in the growth conditions section, and immobilized in the slides by adding 0.5% (w/v) agar prior to microscopy.
Loss of plasma membrane integrity was monitored by PI staining. Cells (5.106 cells ml−1 in PBS) were incubated with 5 µg ml−1 of PI for 10 min at room temperature. When used, Mitotracker Red CMXRos (Molecular Probes) was added in culture medium at a concentration of 0.4 µg ml−1 and incubated for 20 min at 37°C.
Overnight cultures were analysed on a Leica Microsystems DM-5000B epifluorescence microscope with appropriate filter settings using a 100× oil-immersion objective. Images were acquired with a Leica DCF350FX digital camera and processed with LAS AF Leica Microsystems software.
Flow cytometry
Mitochondrial degradation was assessed by quantification of loss of mitochondrial GFP fluorescence by flow cytometry in strains W303, JL1-3Δ2Δ3, pep4Δ, W303 pDP34 and W303 pDP34-PEP4 carrying the plasmids described in the previous section. Cells with different relative volumes may show different levels of GFP fluorescence that may not reflect changes in mitochondrial content. To account for this issue, samples were normalized by calculating the ratio between the green fluorescence (FL1, log) and the relative size (FS, log). For quantification of loss of plasma membrane integrity, 5.106 cells ml−1 in PBS were processed as described in the previous section. For assessment of mitochondrial potential the probe 3,3′dihexyloxacarbocyanine iodide (DiOC6(3)) was used. Cells were collected and suspended at a concentration of 5.106 cells ml−1 in 10 mM MES buffer containing 0.1 mM MgCl2 and 2% (w/v) glucose. After addition of 1 nM DiOC6(3) cells were incubated for 30 minutes at 30°C in the dark.
Sample analysis was performed in an Epics® XL™ (Beckman Coulter) flow cytometer, equipped with an argon-ion laser emitting a 488 nm beam at 15 mW. Monoparametric detection of PI fluorescence was performed using FL-3 (488/620 nm) and detection of DiOC6(3) or GFP fluorescence was performed using Fl-1 (488/525 nm).
Thirty thousand cells were analysed per sample and experiments were reproduced independently at least four times. Data were analysed using WinMDI 2.8 software.
Acknowledgements
We thank V. Trézéguet and G. Lauquin (University of Bordeaux) for providing strain JL1-3Δ2Δ3. We thank Dieter H. Wolf (University of Stuttgart) as well as D. S. Goldfarb (University of Rochester) for generously providing pDP34/pDP34-PEP4 and p416ADH-PEP4–EGFP respectively. We thank B. Westermann (University of Bayreuth) for providing plasmid pYX232-mtGFP. We also thank Vítor Costa (University of Porto) for providing W303 pep4Δ::HIS3. This work was partly supported by Programa de Financiamento Plurianual (POCI 2010, Fundação para a Ciência e Tecnologia, Portugal). Stay of C.P. at CNRS/Université de Bordeaux 2 was partially supported by ‘Cooperação Luso/Francesa -Programa Pessoa 2004’. C.P. was supported by a Fellowship BD/13497/2003 from Fundação para a Ciência e Tecnologia, Portugal.


