Farnesol, a common sesquiterpene, inhibits PQS production in Pseudomonas aeruginosa
Summary
Farnesol is a sesquiterpene produced by many organisms, including the fungus Candida albicans. Here, we report that the addition of farnesol to cultures of Pseudomonas aeruginosa, an opportunistic human bacterial pathogen, leads to decreased production of the Pseudomonas quinolone signal (PQS) and the PQS-controlled virulence factor, pyocyanin. Within 15 min of farnesol addition, decreased transcript levels of pqsA, the first gene in the PQS biosynthetic operon, were observed. Transcript levels of pqsR (mvfR), which encodes the transcription factor that positively regulates pqsA, were unaffected. An Escherichia coli strain producing PqsR and containing the pqsA promoter fused to lacZ similarly showed that farnesol inhibited PQS-stimulated transcription. Electrophoretic mobility shift assays showed that, like PQS, farnesol stimulated PqsR binding to the pqsA promoter at a previously characterized LysR binding site, suggesting that farnesol promoted a non-productive interaction between PqsR and the pqsA promoter. Growth with C. albicans leads to decreased production of PQS and pyocyanin by P. aeruginosa, suggesting that the amount of farnesol produced by the fungus is sufficient to impact P. aeruginosa PQS signalling. Related isoprenoid compounds, but not other long-chain alcohols, also inhibited PQS production at micromolar concen-trations, suggesting that related compounds may participate in interspecies interactions with P. aeruginosa.
Introduction
Pseudomonas aeruginosa is both a ubiquitous Gram-negative soil bacterium and an important opportunistic pathogen. P. aeruginosa interacts with many plant and animal hosts, as well as with different microscopic eukaryotes (Rahme et al., 1995; Hogan and Kolter, 2002; Pukatzki et al., 2002). For example, clinical studies have shown that P. aeruginosa is commonly found in mixed infections with the opportunistic fungal pathogen Candida albicans (Hughes and Kim, 1973; Bauernfeind et al., 1987; Bakare et al., 2003; El-Azizi et al., 2004), and evidence suggests that P. aeruginosa represses C. albicans growth in the host (Kerr, 1994b; Burns et al., 1999). In vitro analyses of P. aeruginosa and C. albicans interactions have shown that these organisms interact in multiple ways. These interactions include P. aeruginosa biofilm formation on the surface of C. albicans hyphae, P. aeruginosa affecting fungal morphology, and P. aeruginosa killing fungal cells via the action of secreted factors such as phospholipases and phenazines (Kerr, 1994a; Kerr et al., 1999; Hogan and Kolter, 2002; Hogan et al., 2004). Many of the same secreted factors that have been shown to be involved in P. aeruginosa interactions with fungi also participate in P. aeruginosa virulence towards multicellular hosts, including insects, plants and mammals (Rahme et al., 1995; Mahajan-Miklos et al., 1999; Cosson et al., 2002; Hogan and Kolter, 2002; Pukatzki et al., 2002).
In P. aeruginosa, the production of numerous secreted factors that participate in interspecies interactions is regulated in accordance with cell density via the quorum-sensing regulatory network [for review, see Juhas et al. (2005) and Visick and Fuqua (2005)]. Two acylhomoserine lactones, 3-oxo-C12-homoserine lactone (3OC12HSL) and C4-homoserine lactone (C4HSL), and 4-hydroxy-2-alkylquinolines (HAQs), such as the Pseudomonas quinolone signal (PQS; 2-heptyl-3-hydroxy-4-quinolone) and HHQ (2-heptyl-4-quinolone), act in concert to control the expression of numerous genes (Pesci et al., 1999; Xiao et al., 2006a). PQS in concert with the transcription factor, PqsR (MvfR), regulates the production of extracellular proteases, hydrogen cyanide and redox-active phenazines including pyocyanin (Pesci et al., 1999; Gallagher et al., 2002; Deziel et al., 2005; Xiao et al., 2006a; Diggle et al., 2007).
Like P. aeruginosa, many other microbes produce an array of secreted molecules that participate in inter- and intraspecies interactions. C. albicans produces farnesol (see Fig. 7 for structure), a volatile sesquiterpene, that acts as a cell–cell signalling molecule and serves as an effector in interspecies interactions [see Hogan (2006) and Nickerson et al. (2006) for review]. In C. albicans cultures, farnesol accumulates in the extracellular medium to concentrations that repress the formation of hyphae and inhibit the colonization of surfaces (Hornby et al., 2001; Ramage et al., 2002). Farnesol has also been shown to affect both the viability and antibiotic resistance in a number of bacterial and fungal species (Brehm-Stecher and Johnson, 2003; Inoue et al., 2004; Jabra-Rizk et al., 2006; Semighini et al., 2006).
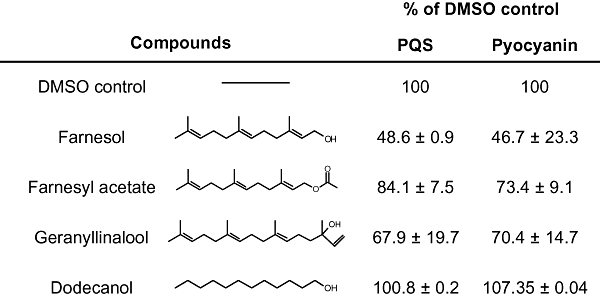
Effects of other sesquiterpenes on pyocyanin and PQS production by P. aeruginosa. Pyocyanin and PQS production by P. aeruginosa strain PA14 in the presence of 250 μM farnesol, 250 μM farnesyl acetate, 250 μM geranyllinalool and 250 μM dodecanol.
In this report, we show that farnesol inhibits the production of PQS and that this repression occurs by inhibition of transcription of the pqs operon. Because several farnesol-like molecules inhibit PQS production, we propose that this inhibition may be relevant in P. aeruginosa interactions with other plant and animal species that produce compounds with similar isoprenoid moieties. Furthermore, these results may represent an important finding that is significant to the development of quorum-sensing antagonists for use against P. aeruginosa infections.
Results
Pseudomonas aeruginosa pyocyanin and PQS production in the presence of farnesol
The addition of 250 μM farnesol to the medium of P. aeruginosa strain PA14 cultures led to a 72% decrease in pyocyanin production, relative to control cultures, when measured at OD600 of 2 (Fig. 1A). In stationary-phase cultures, pyocyanin was decreased by ∼56% upon growth with farnesol at time points up to 24 h (Fig. 1A). Similar experiments performed with P. aeruginosa strain PAO1 showed that growth with farnesol leads to a 95% reduction in extracellular pyocyanin production (data not shown).
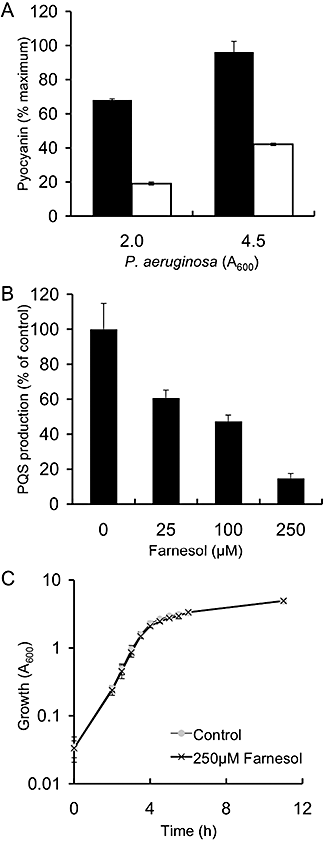
P. aeruginosa pyocyanin and PQS production, and growth in the presence of farnesol.A. P. aeruginosa strain PA14 pyocyanin production in the control cultures (black bars) and presence of 250 μM farnesol (open bars). Pyocyanin is presented as the percentage of that obtained in the wild-type strain PA14 in the absence of farnesol at OD600 of 4.5. Data are presented as the average of four separate experiments.B. PA14 PQS production in control cultures and in cultures grown with different amounts of farnesol. PQS production was determined by TLC analysis in the absence and presence of 25, 100 and 250 μM farnesol at 6 h (OD600 of 2.0) in P. aeruginosa strain PA14. PQS was quantified by comparison with a titration of an authentic PQS standard.C. P. aeruginosa strain PA14 growth in the absence and presence of 250 μM farnesol. The error bars represent the average of three replicate cultures.
Because pyocyanin production is regulated by PQS (Cao et al., 2001; Gallagher et al., 2002; Xiao et al., 2006a), the levels of PQS were determined in both farnesol-treated and control cultures. Farnesol inhibited PQS production in a dose-dependent manner, with 25 μM farnesol leading to a 39% decrease in PQS, and 250 μM farnesol leading to an 85% reduction in extracellular PQS levels, in comparison with control cultures that received vehicle alone (Fig. 1B). Growth curve analysis confirmed that P. aeruginosa growth kinetics were unaffected by the presence of farnesol (Fig. 1C).
Transcriptional analysis of pqsA and pqsR/mvfR in farnesol-treated cultures
To determine whether the decreased PQS levels in cultures grown in the presence of farnesol were due to decreased expression of the PQS biosynthetic operon, reverse transcription polymerase chain reaction (RT-PCR) and real-time PCR analyses of RNA from cultures grown in the presence of farnesol were performed. While RNA analysis of pqsA consistently showed lower levels in farnesol-grown cultures (data not shown), the effects were most striking when farnesol (250 μM) was added to cells during the period in which pqsA transcription is induced (Fig. 2). The period of pqsA-D upregulation was determined to be during mid-exponential phase growth (OD600 0.4–0.65) under these growth conditions (Fig. S1). In these experiments, early exponential-phase cultures (OD600 of 0.3) were divided equally, and were supplemented with either farnesol [dissolved in dimethylsulphoxide (DMSO)] or an equivalent volume of DMSO as a control. Cells were harvested for RNA extraction every 15 min after farnesol was added. RT-PCR and real-time PCR analysis was then used to monitor the transcription of pqsA, pqsR and rplU (a constitutively expressed control transcript). In control cultures, the levels of pqsA increased within 15 min and over the course of 1 h relative to both total RNA and the rplU control (Fig. 2). Increases in pqsA transcript, as determined by real-time PCR quantification, were 2.58-fold within 30 min and 46.39-fold at 60 min (Table 1). In cultures that received farnesol, pqsA transcript levels did not increase relative to those observed at the initial time point (Fig. 2 and Table 1). The addition of DMSO to control cultures did not affect pqsA transcription when compared with untreated cultures (data not shown). The levels of pqsR transcript, which encodes the transcriptional regulator of pqsA, did not change relative to control transcript over the course of the (1 h) experiment in either control or farnesol-treated cultures, suggesting that reduction in PQS production is not due to a decrease in pqsR transcription (Table 1). These data are consistent with previously published studies that show that pqsR transcription remains largely unchanged during exponential growth (Cao et al., 2001).
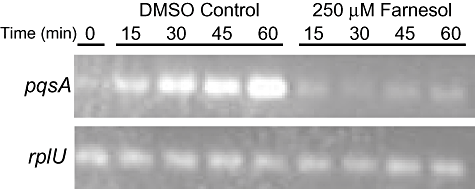
RT-PCR analysis of P. aeruginosa PA14 cultures pulsed with 250 μM farnesol. The levels of pqsA and rplU were measured in control cultures and cultures that had received farnesol for 15, 30, 45 and 60 min. The time (min) reflects the time since DMSO or farnesol addition to exponentially growing cultures.
| Time (min) | pqsA | pqsR | ||
|---|---|---|---|---|
| DMSO control | 250 μM farnesol | DMSO control | 250 μM farnesol | |
| 0 | 1.00 ± 0.00 | – | 1.00 ± 0.10 | – |
| 15 | 0.87 ± 0.00 | 0.64 ± 0.00 | 1.12 ± 0.04 | 0.97 ± 0.13 |
| 30 | 2.58 ± 0.00 | 0.51 ± 0.00 | 0.68 ± 0.08 | 0.82 ± 0.01 |
| 45 | 11.77 ± 0.01 | 0.46 ± 0.00 | 0.82 ± 0.11 | 0.89 ± 0.03 |
| 60 | 46.39 ± 0.13 | 1.12 ± 0.00 | 2.16 ± 0.15 | 1.47 ± 0.10 |
Analysis of pqsA transcription in an Escherichia coli heterologous system
To determine whether the inhibition of pqsA transcriptional activation was due to direct effects of farnesol, a heterologous E. coli system was developed. E. coli pEAL08-2 contains a plasmid with the gene encoding PqsR, driven by the tac promoter, and the pqsA promoter driving lacZ expression. The addition of PQS led to dose-dependent increases in β-galactosidase activity at concentrations between 12 and 120 nM (Fig. 3A and data not shown). The addition of 300 μM farnesol to E. coli pEAL08-2 cultures containing either 12 or 60 nM PQS resulted in a reduction of β-galactosidase activity (Fig. 3A). Furthermore, the addition of farnesol (30–300 μM) to cultures containing 30 nM PQS caused a dose-dependent reduction in β-galactosidase activity (Fig. 3B). The observations that farnesol caused decreased pqsA transcript accumulation in P. aeruginosa and decreased induction of pqsA–lacZ transcription by PQS in E. coli suggest that farnesol is affecting the transcription of pqsA by interfering with the PqsR-mediated transcriptional activation.
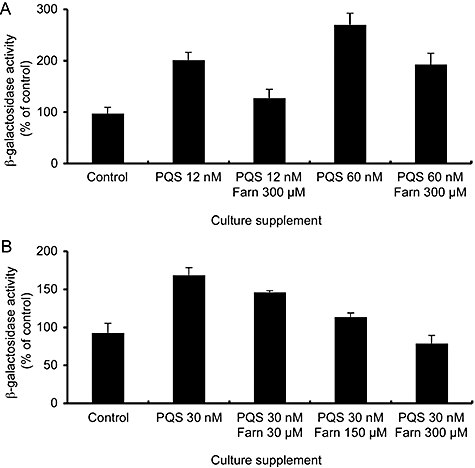
Analysis of PqsR-mediated transcription from the pqsA promoter using a pqsA–lacZ fusion in E. coli.A. β-Galactosidase activity was measured from early exponential-phase cultures grown with 12 or 60 nM PQS in the presence and absence of 300 μM farnesol for 2.5 h. The values represent per cent of β-galactosidase activity in control cultures. The error bars represent standard deviation between three biological replicate cultures.B. β-Galactosidase activity was measured from early exponential-phase cultures grown with 30 nM PQS and 0, 30, 150 or 300 μM farnesol.
Electromobility shift assay (EMSA) analysis of the PqsR interaction with the pqsA promoter in the presence of farnesol
The transcription of the pqsA-D operon is dependent on PqsR, which positively regulates transcription in response to PQS (Wade et al., 2005). Because farnesol caused a large decrease in pqsA, but not pqsR, transcript accumulation (Table 1), and the addition of farnesol reduces lacZ transcription from the pqsA promoter (Fig. 3A–B), the effects of farnesol on PqsR interaction with the pqsA promoter were examined. Gel mobility shift assays were performed using a pqsA promoter DNA fragment and cell lysates from E. coli containing pDSW8, which contains pqsR controlled by the inducible tac promoter (Wade et al., 2005). E. coli (pDSW8) cells were grown in the presence or absence of PQS, farnesol or both compounds. As expected, control reactions (Fig. 4A, lanes 1–3) showed that addition of PQS promotes an increased PqsR interaction with the pqsA promoter region, resulting in an apparent, increased electromobility shift (Wade et al., 2005; Xiao et al., 2006b). This shift was not altered when farnesol was present in addition to PQS (Fig. 4A, lane 5). Surprisingly, the presence of farnesol alone caused a mobility shift that was identical to that seen with PQS alone (Fig. 4A, lane 4). This unexpected result suggested that farnesol promotes the association of PqsR and the pqsA promoter. Dodecanol, another aliphatic alcohol with a comparable chain length (Fig. 7), had no effect on the ability of PqsR to interact with pqsA promoter DNA (Fig. 4B).
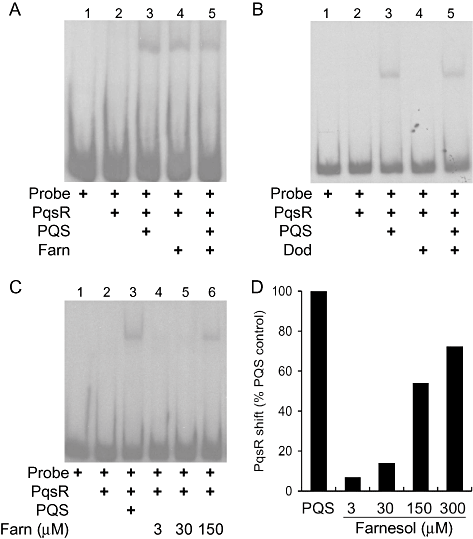
DNA mobility shift analysis of PqsR interaction with the pqsA promoter in the presence of farnesol, PQS and/or dodecanol.A. Mobility shift analysis of the effects of farnesol (300 μM), PQS (30 μM) or both on the ability of PqsR to bind to a 253 bp pqsA promoter fragment.B. Analysis of PqsR interaction with the pqsA promoter fragment in the presence of PQS (30 μM) and/or dodecanol (300 μM).C. Dose-dependent effects of farnesol (3–150 μM) compared with PQS (30 μM) on PqsR binding to the pqsA promoter region.D. Quantification of PqsR–DNA band intensities in the presence of 3, 30, 150 or 300 μM farnesol as compared with 30 μM PQS shown in A and C.
A direct comparison of electrophoretic mobility shifts induced by lysates prepared with comparable concentrations (30 μM) of PQS or farnesol (Fig. 4C, lanes 3 and 5) suggested that PQS binds PqsR with a higher affinity than does farnesol. The electrophoretic mobility shift induced by farnesol is dose-dependent at concentrations of 30, 150 and 300 μM (Fig. 4C, lanes 4–6, and Fig. 4D), and is 14%, 54% and 72% of PQS alone respectively.
The presence of both compounds did not result in a supershift, suggesting that PqsR interacts with the same or similar regions of the probe while in the presence of either farnesol or PQS (Fig. 4). This was further examined using a probe with a mutated PqsR binding site. PqsR has previously been reported to recognize a 13 nt region of dyad-symmetry, and deletion of a portion of this sequence within this site abolished PqsR–probe interactions (Xiao et al., 2006b). Consistent with these published results, it was observed that the addition of PQS and PqsR to the wild-type probe caused an increased shift in DNA, whereas no shift was observed with the mutated promoter fragment (Fig. 5, lanes 4 and 8). While PqsR in the presence of either PQS or farnesol (Fig. 5, lanes 3 and 4) caused a shift of the wild-type pqsA promoter DNA, the shift was not observed when the probe with the mutated PqsR binding site was used (Fig. 5, lanes 7 and 8). These results suggest that PqsR, in the presence of either PQS or farnesol, recognized the same control element in the pqsA promoter, despite the fact that PQS stimulated, and farnesol repressed, pqsA transcription.
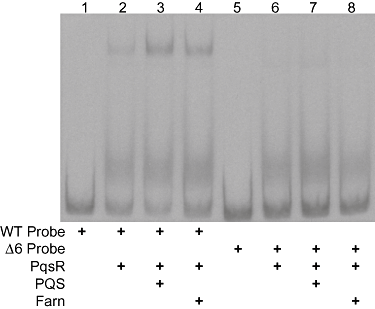
DNA mobility shift analysis of PqsR interaction with the wild-type (wt) and mutated pqsA promoter in the presence of farnesol or PQS. The Δ6 probe has a 6 bp deletion within the previously characterized PqsR binding site. PQS and farnesol were added at 30 and 300 μM respectively.
Pseudomonas aeruginosa pyocyanin and PQS production in the presence of C. albicans
To determine whether C. albicans produces sufficient amounts of farnesol to inhibit the production of PQS and PQS-controlled virulence factors when grown in co-culture with P. aeruginosa, mixed-species growth experiments were performed. Pyocyanin and PQS levels in P. aeruginosa–C. albicans co-cultures were compared with P. aeruginosa single-species control cultures and P. aeruginosa grown with 250 μM farnesol. During co-culture with C. albicans, pyocyanin levels were reduced to 42.1% relative to the P. aeruginosa only control, and to 42.2% in farnesol-treated P. aeruginosa cultures (Fig. 6). In P. aeruginosa cultures grown with either C. albicans or farnesol, PQS levels were similarly reduced to 24.7% and 24.4% of the PA14 only controls. There were no differences in the numbers of P. aeruginosa when the co-cultures were compared with the single-species cultures at the 24 h time point as measured by total planktonic colony-forming units (data not shown). The observation of decreased pyocyanin and PQS production in co-cultures suggests that the presence of C. albicans-produced farnesol impacts P. aeruginosa PQS signalling.
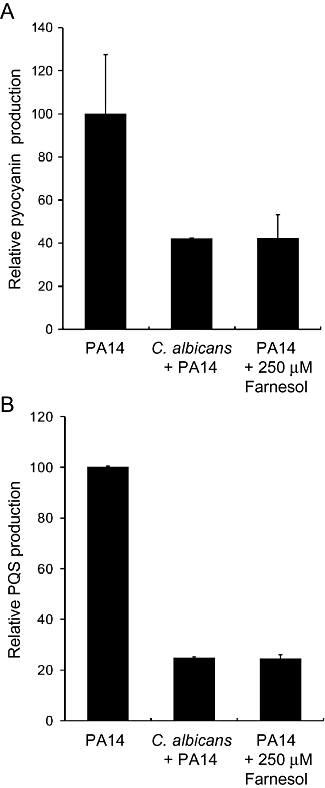
PQS and pyocyanin production by P. aeruginosa grown in co-culture with C. albicans tup1/tup1 or with 250 μM farnesol. Cultures were grown for 24 h in MOPS minimal medium prior to analyses of PQS and pyocyanin levels respectively, from the culture supernatants. The values are presented as percentage relative to the P. aeruginosa only control, and error bars represent the standard deviation between replicate cultures.
Pseudomonas aeruginosa growth and pyocyanin production in the presence of other naturally occurring compounds
To determine which moieties of the farnesol molecule were essential for repression of PQS production, we tested the effects of compounds with either a similar chain length (dodecanol) or isoprenoid backbone (farnesyl acetate and geranyllinalool) (Fig. 7). While dodecanol had no effect on either PQS or pyocyanin levels, farnesyl acetate and geranyllinalool both caused a reduction in PQS and pyocyanin, although neither was as potent as farnesol, indicating that chain saturation could be important (Fig. 7). None of the compounds tested affected the growth rate of P. aeruginosa.
Discussion
Here, we show that farnesol caused a decrease in PQS production by P. aeruginosa without affecting the overall growth kinetics. P. aeruginosa pqsA transcriptaccumulation was decreased in cultures grown with farnesol, and PqsR-mediated transcriptional activation of pqsA was inhibited by farnesol in E. coli. PqsR, in the presence of PQS, activates transcription by binding to a LysR-type protein recognition sequence that is located at −45 bp relative to the pqsA transcriptional initiation site (Wade et al., 2005; Xiao et al., 2006b), and EMSA analyses indicated that both PQS and farnesol stimulated PqsR interaction with a pqsA promoter fragment in the region of this PqsR binding site. Together, these findings lead us to propose that farnesol caused a non-productive interaction with the pqsA promoter that does not lead to transcriptional activation of the pqsA-E operon.
The data presented here suggest that farnesol and related compounds would most effectively inhibit PQS production when PQS concentrations are low, for instance during the period of PqsR-mediated induction of the pqs biosynthetic genes. EMSA experiments indicated that 30 μM PQS led to 10-fold increase in PqsR affinity for the pqsA promoter when compared with PqsR affinity for the promoter in the presence of 30 μM farnesol (Fig. 4). In a heterologous E. coli system with PqsR and a pqsA–lacZ fusion, PQS stimulated transcription from the pqsA promoter at nanomolar concentrations (12–60 nM), while 30–300 μM farnesol is required for repression. The induction of the pqsA–lacZ fusion at nanomolar concentrations is consistent with other published data (Xiao et al., 2006a). Other experiments that required higher concentrations of PQS (2 μM) to stimulate PqsR-mediated transcription were performed in P. aeruginosa strain PAO1 using a pqsA–lux fusion (Diggle et al., 2007). Furthermore, in the same work by Diggle et al. (2007), different promoter constructs required different concentrations of PQS for induction. In addition to experimental differences, E. coli may have different pqsR expression levels or PQS uptake/efflux mechanisms in comparison with P. aeruginosa. Similarly, E coli and P. aeruginosa may be different in their ability to take up farnesol.
Farnesol is referred to as a C. albicans quorum-sensing molecule for its ability to inhibit hyphal growth in dense populations (Hornby et al., 2001). Farnesol concentrations in the extracellular medium of dense C. albicans cultures are reported to be between 10 and 50 μM (Hornby et al., 2001), or 0.12–0.13 mg of farnesol per g of cell (dry weight) (Hornby and Nickerson, 2004). Farnesol concentrations as low as 25 μM caused significant decreases in the levels of PQS produced by P. aeruginosa (Fig. 1B). In the same way that bacterial signalling molecules accumulate in microbial communities (Charlton et al., 2000; Hogan et al., 2004), the local concentrations of farnesol in C. albicans colonies and biofilms may be far higher than the planktonic concentrations measured. Consistent with the hypothesis that C. albicans can produce sufficient quantities of farnesol to inhibit the production of PQS and PQS-controlled factors, such as pyocyanin, P. aeruginosa–C. albicans co-cultures were found to have reduced levels of both PQS and pyocyanin (Fig. 6). Because pyocyanin is toxic to C. albicans, this chemical interaction likely promotes C. albicans survival (Kerr et al., 1999).
Farnesol has been shown to affect other microbial species. At concentrations between 10 and 250 μM, farnesol has been shown to cause apoptosis in Aspergillus nidulans and cell cycle arrest in Saccharomyces cerevisiae (Machida et al., 1999; Semighini et al., 2006). The growth of a number of bacterial species, including Staphylococcus aureus, is inhibited by farnesol (Akiyama et al., 2002; Inoue et al., 2004; Jabra-Rizk et al., 2006), and farnesol can potentiate bacterial susceptibility to antibiotics (Brehm-Stecher and Johnson, 2003; Jabra-Rizk et al., 2006).
In addition to farnesol, other long-chain isoprenoid compounds with related structures also inhibit PQS production (Fig. 7). Such compounds are naturally occurring volatile products of plants, mammals and insects. In many cases, the biological roles of these compounds have not yet been elucidated, but some are thought to play a role as inter- and intraspecies signalling molecules (Cruz-Lopez et al., 2005; Goff and Klee, 2006; Mendgen et al., 2006). There is a precedent for such compounds acting as antimicrobials or in virulence attenuation. For example, the plant-derived compounds such as artemisinin, a sesquiterpene lactone, and the alkaloid berberine are effective antiparasite agents (Kaneda et al., 1991; Balint, 2001; Hawrelak, 2003). The bacterium Xanthomonas campestris produces cis-11-methyl-2-dodecenoic acid as a signalling molecule that regulates the expression of numerous quorum sensing-regulated genes and inhibits C. albicans filamentation in a manner similar to that of farnesol (Wang et al., 2004). The fact that this molecule can mimic the action of farnesol in yeast opens up the possibility that it can also inhibit PQS production in P. aeruginosa or in other bacteria that may produce PQS and related HAQs under PqsR regulation (Diggle et al., 2006).
The ubiquitous nature of farnesol-like molecules in the environment suggests the possibility that other organisms may have the potential to modulate P. aeruginosa virulence by disrupting PQS production and PqsR-mediated transcriptional activation. Because PqsR is necessary for the expression of numerous virulence-related genes, inhibition of PqsR could significantly decrease P. aeruginosa virulence (Pesci et al., 1999; Cao et al., 2001; Diggle et al., 2003; McGrath et al., 2004; Deziel et al., 2005). PQS has been detected in sputum and bronchoalveolar lavage fluid from the lungs of individuals with cystic fibrosis with chronic P. aeruginosa infections, and thus both PQS-mediated signalling and PQS and related HAQ molecules themselves may contribute to P. aeruginosa damage and inflammation of host tissues (Collier et al., 2002; Guina et al., 2003; Hooi et al., 2004; Calfee et al., 2005). Because P. aeruginosa infections associated with cystic fibrosis are resistant to current therapies, molecules that inhibit PQS production and signalling may attenuate the infections and potentially aid in the clearance of this pathogen. The studies presented here both indicate that farnesol or compounds with related moieties may serve as a basis for the development of molecules that effectively inhibit PQS production by P. aeruginosa in humans, and demonstrate the utility of studying bacterial–fungal interactions for the purpose of understanding novel ways to mitigate bacterial virulence.
Experimental procedures
Bacterial strains and culture conditions
Bacterial and fungal strains used are listed in Table 2. Cultures were grown in Luria–Bertani (LB) at 37°C with vigorous shaking unless otherwise noted. All compounds – farnesol (Sigma # 277541), dodecanol (Aldrich #04023TB), farnesyl acetate (Fluka # 45895) and geranyllinalool (Fluka # 48809) – were prepared as a 500 mM stock solution in DMSO immediately prior to each experiment. Farnesol and its analogues were added to a final concentration of 250 μM at the time of inoculation, and control cultures received an equivalent amount of DMSO.
| Strain and plasmid | DH# | Description | Source |
|---|---|---|---|
| Strain | |||
| P. aeruginosa PA14 | 122 | Wild type | Rahme et al. (1995) |
| P. aeruginosa PAO1 | 120 | Wild type | Stover et al. (2000) |
| P. aeruginosa PA14ΔlasI | 132 | In-frame deletion of lasI | Hogan et al. (2004) |
| P. aeruginosa pqsB::TnphoA | 125 | TnphoA-insertion mutant | Deziel et al. (2004) |
| E. coli DH5α | – | F′/endA1 hsdR17 supE44 thi-1 recA1 gyrA relA1 (lacZYA-argF) U169 deoR[80 dLac (lacZ)M15 recA1] | Woodcock et al. (1989) |
| C. albicans | 36 | BCa2–10; tup1/tup1, URA3/ura3 | Braun and Johnson (1997) |
| Plasmid | |||
| pDSW8 | – | tacp-pqsR on pEX1.8 | Wade et al. (2005) |
| pLP0996 | – | pqsA′–lacZ transcriptional fusion; bla | McGrath et al. (2004) |
| pEAL08-2 | 618 | pLP0996 fused to pDSW8 | This study |
| pCR2.1-TOPO | – | Cloning vector | Invitrogen |
| pCR2.1pqsA+5 | 912 | pqsA promoter region in pCR2.1-TOPO | This study |
| pCR2.1pqsAD2 | 913 | Mutated pqsA promoter region in pCR2.1-TOPO | This study |
Growth curve analyses
Overnight cultures of P. aeruginosa were diluted 200-fold into 100 ml of pre-warmed LB, which was then divided into two 50 ml of cultures in 250 ml Erlenmeyer flasks prior to addition of compound. Aliquots were taken at each indicated time point and fixed by dilution with 750 μl of phosphate-buffered saline containing 0.2% formaldehyde. Optical density of the fixed cultures was measured at 600 nm (OD600) at the end of the experiment. The growth curves represent the average of four different experiments performed on different days.
Pyocyanin production
To achieve balanced growth prior to compound addition, overnight cultures of P. aeruginosa were diluted 200-fold in pre-warmed medium and allowed to achieve an absorbance (OD600) of 0.3. Cultures were then diluted 200-fold into 50 ml of pre-warmed medium, and farnesol or equivalent amounts of DMSO were then added. At the specified time point or optical density, aliquots were removed and passed through a 0.22 μm filter. Each aliquot (1 ml) of cleared supernatant received 500 μl of chloroform, samples were vortexed for 30 s, centrifuged for 2 min, and 200 μl of the lower chloroform layer was removed. A second extraction of the same 1 ml aliquot was performed, and 300 μl of the chloroform layer was collected and combined with the first extract. The chloroform extracts were acidified by the addition of 500 μl of 0.1 N HCl, and the aqueous layer, containing pyocyanin, was removed. The pH was neutralized by addition of an equal volume of 200 mM Tris-HCl (pH 8). An absorbance spectrum from 300 to 800 nm was obtained, with maxima at 308 and 378. Relative pyocyanin amounts are based on the amount of pyocyanin produced by the wild-type control strain PA14 (Ingledew and Campbell, 1969). The values represent pyocyanin production from four separate experiments.
PQS production
Pseudomonas aeruginosa were grown as described above prior to transfer into medium amended with farnesol or its analogues (250 μM) or DMSO. Samples were obtained at an OD600 of 2.0 unless otherwise indicated, and were prepared as previously published with modifications as described (Gallagher et al., 2002). At each time point, 300 μl culture was added to 900 μl acidified ethyl acetate, and samples were vortexed for 2 min and centrifuged for 2 min at 13 000 g (Gallagher et al., 2002). A portion of the ethyl acetate layer (450 μl) was removed to a clean tube and allowed to dry down at 37°C. Extracts were resuspended in 50 μl of 1:1 acidified ethyl acetate : acetonitrile by vortexing for 10 min at low speed. For TLC analysis, aluminum TLC sheets (EMD Chemicals, silica gel 60 F254) were activated in a 0.5% KH2PO4 solution, air dried, and baked at 100°C for 1 h prior to use. Samples (2 μl) were applied to each plate using 1 μl glass capillaries, and synthetic PQS (25 μg) was loaded for comparison (Gallagher et al., 2002). The TLC solvent used is 17:2:1 methylene chloride : acetonitrile : dioxane. Plates were visualized using a handheld long-wave UV light, and photographs were taken using a digital camera. Fold changes in spot intensity were determined with ImageJ (Abramoff et al., 2004).
RNA isolation, RT-PCR and real-time PCR
To examine the timing of the effects of farnesol on pqsA and pqsR expression, 100 ml of culture was grown to an OD600 of 0.3, then divided into two 50 ml portions, which were supplemented with either 250 μM farnesol or an equivalent amount of DMSO. Aliquots (1 ml) for RNA extraction were taken at 15 min intervals post farnesol exposure. Cells were harvested by centrifugation, the supernatants were removed, and cell pellets were frozen in a dry ice–ethanol bath and stored at −80°C until RNA extractions were performed.
To isolate P. aeruginosa RNA, 100 μl of 3 mg ml−1 lysozyme solution was added to cells and samples were allowed to sit at room temperature for 3 min The Qiagen RNeasy kit was used for subsequent steps with modifications. Qiagen on-column DNase treatment was used according to the manufacturer's instructions. Additional DNase treatment was performed using Promega RQ1 according to the manufacturer's instructions. DNase was removed using the RNeasy kit. RNA was quantified using a NanoDrop spectrophotometer. PCRs using the purified RNA as the template and rplU primer set (see below for sequence) were carried out to ensure no DNA contamination of the RNA. The purified RNA was then used as a template to construct cDNA using Invitrogen SuperScript III, according to the manufacturer's instructions, and random decamer primers [(NS)5, Invitrogen]. The resulting cDNA was used as a template in PCRs completed with the following primers: 5′-GCAGCACAAAGTCACCGAAGG-3′ (rplU forward), 5′-CCGTGGGAAACCACTTCAGC-3′ (rplU reverse), 5′-CGTTCTGCGATACGGTGAGC-3′ (pqsR forward), 5′-ACGAACGCCTTGGTGTAGCC-3′ (pqsR reverse), 5′-CCATGTGTTCCTCGCCAACC-3′ (pqsA forward) and 5′-GCCAGTAACCCGGACTCAGC-3′ (pqsA reverse). Cycling was 10 min at 94°C; 30 s at 94°C, 30 s at 54°C, 1 min at 72°C, repeat 30 cycles; and 15 min at 72°C.
Real-time PCR was conducted with an Applied Biosystems (ABI) 7500. Primers, cDNA and cycling conditions were identical to those used in the previous PCRs, with the exception of the addition of a dissociation curve cycling amended to the end of the 15 min at 72°C hold. The ABI Power SYBR Green PCR kit (4368577) was used in the reactions.
Transcriptional analysis in E. coli
Plasmid pEAL08-2 was generated by fusion of plasmid pLP0996, which contains the pqsA promoter–lacZ transcriptional fusion and plasmid pDSW8, containing the tacp-pqsR on pEX1.8 (McGrath et al., 2004; Wade et al., 2005). Overnight cultures of E. coli pEAL08-2 were diluted 1:50 in LB with appropriate antibiotics, and incubated at 37°C with shaking until they reached an OD600 of 0.2. Aliquots (5 ml) were supplemented with either DMSO (3 μl), 30–300 μM farnesol (3 μl dissolved in DMSO), or 12–60 nM PQS (in ethyl acetate). PQS was added to test tubes, and the ethyl acetate was evaporated using N2 prior to the addition of the cell suspension. β-Galactosidase activity was measured at 2.5 h post induction with PQS and adjusted for cell density based on OD600 and farnesol alone cultures. β-Galactosidase activity was expressed as per cent of the DMSO control relative to reference cultures that received either vehicle or farnesol alone.
DNA mobility shift assays
Polymerase chain reaction was used to generate DNA fragments containing the pqsA promoter region (253 bp) as described previously (Wade et al., 2005). DNA fragments were radiolabelled with [γ-32P]ATP (Perkin-Elmer, Wellesley, MA) by using T4 polynucleotide kinase (Invitrogen, Carlsbad, CA). Protein samples were obtained by mechanically disrupting (French press) cells of E. coli strain DH5α harbouring plasmid pDSW8 after growth to mid-logarithmic phase in LB media containing PQS (30 μM), dodecanol (300 μM), farnesol (3–300 μM), or no addition. Cultures were supplemented with IPTG (1 mM) 2 h prior to harvesting in order to induce tacp-pqsR expression from pDSW8. The binding assays were carried out in buffer containing 10 mM Tris-HCl (pH 8.0), 60 mM KCl, 1 mM EDTA, 1 mM dithiothreitol and 10% glycerol (Medina et al., 2003). Each reaction mixture contained 0.3 μg of salmon sperm DNA, 104 cpm-radiolabelled DNA, and 20 μg of protein. Reaction mixtures were incubated at room temperature for 20 min and separated by electrophoresis at 4°C on a native 6% polyacrylamide gel in 0.5 × Tris-borate-EDTA buffer. Radiolabelled bands were visualized by autoradiography.
For DNA mobility shift analysis, using the mutated pqsA promoter, a 165 base-pair fragment was generated consisting of the pqsA promoter region containing a 6-nucleotide deletion corresponding to the first half of the dyad-symmetry of the LysR box (Xiao et al., 2006b). Two PCR products were generated using P. aeruginosa PA14 genomic DNA and the primer sets pqsAprobe1 (5′-GGGTGTGCCAAATTTCTCGCGG-3′) and pqsAprobe2 (5′-GGGCGAAGCGCGATATTCGGAGCGAAAAAGTTTCGGGGAGAAG-3′), and pqsAprobe3 (5′-CTTCTCCCCGAAACTTTTTCGCTCCGAATATCGCGCTTCGCCC-3′) and pqsAprobe4 (5′-CGTTCCCTCTTCAGCGATATGC-3′). The resulting fragments were used as templates for a splice overlap extension, PCR using the pqsAprobe1 and pqsAprobe4 primers. A 171 bp fragment corresponding to wild-type DNA without the mutation was made using P. aeruginosa PA14 genomic DNA, and the primers pqsAprobe1 and pqsAprobe4. PCR products for both fragments were inserted into pCR2.1-TOPO vector and transformed into One Shot TOP10 cells. Resulting fragment sequences were verified against the PA14 published genome. Prior to EMSA, the fragments were obtained from the plasmids by EcoRI digestion. EMSA analysis was carried out similar to above, including the following controls where WT-probe and Δ6-probe were grown with DH5α (pEX1.8) lysates to account for the non-specific binding seen in lanes 4–6 and 8–10 of Fig. 5, confirming their presence in samples containing vector sequence.
Pseudomonas aeruginosa and C. albicans co-cultures
Overnight cultures of C. albicans tup1/tup1 and P. aeruginosa PA14 were grown in modified MOPS media [1 × MOPS base (Neidhardt et al., 1974), 0.2% glucose, 10 mM choline, 0.6 mM CaCl2, K2HPO4, K2SO4]. C. albicans tup1/tup1 (5 ml) was pelleted and cells were resuspended in 20 ml of MOPS, which was dispensed into 5 ml aliquots that received 100 μl of the P. aeruginosa PA14 culture. Comparable P. aeruginosa single-species cultures received 250 μM farnesol or vehicle. Cultures were incubated at 37°C on a roller drum. Samples were taken for PQS and pyocyanin analysis at 9 h and 24 h respectively post incubation. Samples were processed as described above.
Acknowledgements
This publication was made possible by the Cystic Fibrosis Foundation, the Pew Biomedical Scholars Program, and NIH Grant Number 1 P20 RR018787 from the Institutional Development Award (IDeA) Program of the National Center for Research Resources (D.A.H.). Additional support was provided by the National Institutes of Health Molecular Pathogenesis Training Grant T32 AI07519 (C.C.). M.W.C., J.M.F and E.C.P were supported by a research grant from the National Institute of Allergy and Infectious Diseases (Grant RO1-AI46682).


