Significant soil acidification across northern China's grasslands during 1980s–2000s
Abstract
Anthropogenic acid deposition may lead to soil acidification, with soil buffering capacity regulating the magnitude of any soil pH change. However, little evidence is available from large-scale observations. Here, we evaluated changes in soil pH across northern China's grasslands over the last two decades using soil profiles obtained from China's Second National Soil Inventory during the 1980s and a more recent regional soil survey during 2001–2005. A transect from the central-southern Tibetan Plateau to the eastern Inner Mongolian Plateau, where Kriging interpolation provided robust predictions of the spatial distribution of soil pH, was then selected to examine pH changes during the survey period. Our results showed that soil pH in the surface layer had declined significantly over the last two decades, with an overall decrease of 0.63 units (95% confidence interval = 0.54–0.73 units). The decline of soil pH was observed in both alpine grasslands on the Tibetan Plateau and temperate grasslands on the Inner Mongolian Plateau. Soil pH decreased more intensively in low soil carbonate regions, while changes of soil pH showed no significant associations with soil cation exchange capacity. These results suggest that grassland soils across northern China have experienced significant acidification from the 1980s to 2000s, with soil carbonates buffering the increase in soil acidity. The buffering process may induce a large loss of carbon from soil carbonates and thus alter the carbon balance in these globally important ecosystems.
Introduction
The primary agents of acid deposition around the world are atmospheric sulfur dioxide (SO2) and nitrogen oxides (NOx) originating largely from fossil-fuel combustion and agricultural fertilization. The rate of SO2 emissions has reduced across Europe and eastern North America since the 1990s (Oulehle et al., 2011), but remains high in East Asia (Zhao et al., 2009). Meanwhile, the contribution of anthropogenic N to acid deposition continues to be a concern (Bowman et al., 2008). Globally, the increase in anthropogenic reactive N emissions has induced atmospheric N deposition at a mean rate of 105 Tg N yr−1 (Galloway et al., 2008). Continuous acid deposition to terrestrial ecosystems may lead to soil acidification (Lu et al., 2011). Soil acidity, usually described using soil pH, is an important factor that regulates biodiversity and biogeochemical cycles in terrestrial ecosystems, impacting for example, plant species richness (Chytrý et al., 2007) and greenhouse gas emissions (Bouwman et al., 2002). Anthropogenic soil acidification could then alter both the structure and function of land ecosystems (Kirk et al., 2010). Understanding the scale and nature of soil pH changes can thus provide valuable information for predicting the responses of terrestrial ecosystems to acid deposition.
The dynamics of soil pH in terrestrial ecosystems have recently received considerable attention, but the direction and magnitude of pH changes are highly variable among studies. For instance, Guo et al. (2010) reported that soil pH in the major croplands of China had declined significantly during 1980s–2000s, by 0.13–0.80 units among various soil groups. In contrast, Kirk et al. (2010) demonstrated that soil pH across England and Wales exhibited a widespread increase between 1978 and 2003 at a rate of 0.004–0.029 units yr−1 among various land use types, indicating that soil became less acidic over the survey period. Such contrasting results may be explained largely by the operation of different drivers in different regions. Soil acidification in China's croplands, for example, was ascribed to the combination of high-N fertilizer inputs, plant uptake and removal of base cations from soil, and acid deposition, with the dominant effect from the overuse of N fertilizer (Guo et al., 2010). By contrast, the increase in soil pH across England and Wales from 1978 to 2003 was largely due to the decreased sulfur deposition from the atmosphere, and increased liming practices on arable land (Kirk et al., 2010). Nevertheless, contrasting results among various studies highlight that more regional observations are required to reveal soil pH dynamics and to identify their principal drivers.
The dynamics of soil pH depend on the balance between acid and non-acid cations on colloid surfaces and the balance between hydrogen (H+) and hydroxide (OH−) ions in soil solution (Brady & Weil, 2008). The additional inputs of H+ ions into soils could then induce an increase in soil acidity. However, to some degree, the magnitude of soil pH changes may depend on soil buffering capacity (Brady & Weil, 2008). It has been suggested that soils go through a transition among different buffering ranges during acidification, which are linked with the weathering and release of different elements (Bowman et al., 2008). Soil pH change is strongly buffered by calcium carbonates for soils of high pH (>7.5). At intermediate pH (4.5–7.5), most of the buffering is provided by soil cation exchange capacity (CEC). During the acidification process, soils release base cations (e.g. Ca2+ and Mg2+) held on soil surfaces, exchange them with H+, and so neutralize the increase in soil acidity. Once base cations have been exhausted, aluminum is released from soils, and thus the dynamics of soil pH could be buffered by aluminum compounds at low pH (<4.5). This hypothesis has been partly validated by a site-level N addition experiment conducted in an alpine ecosystem in the Western Tatra Mountains of Slovakia (Bowman et al., 2008). However, little evidence comes from large-scale observations across various ecosystem types.
China's grasslands provide an ideal region to examine soil pH dynamics and their buffering mechanisms at a large spatial scale. As the third largest grassland ecosystem in the world, China's grasslands cover diverse grassland types, extending from alpine grasslands on the Tibetan Plateau, temperate grasslands on the Inner Mongolian Plateau, to mountain grasslands in the Xinjiang area (Liao & Jia, 1996). Similar to other ecosystems around the world, China's grasslands have experienced significant atmospheric N deposition during the past several decades (Lü & Tian, 2007). Meanwhile, China's grasslands, particularly those distributed on the Inner Mongolian Plateau, have also been suffering from atmospheric S deposition for long periods (Zhao et al., 2009). This continuous acid deposition, including both N and S deposition, would be predicted to have increased soil acidity across these regions. However, a comprehensive assessment of soil pH dynamics and its potential buffering mechanisms across China's grasslands has not yet been reported.
This study examines changes in soil pH across northern China's grasslands during the past two decades. We sampled 327 sites across the study area by conducting five consecutive regional soil surveys during 2001–2005. We then detected changes in soil pH along a transect by comparing our concurrent measurements with historical records of 275 soil profiles derived from China's Second National Soil Inventory during the 1980s. Specifically, this study aims to test the following two hypotheses: (1) soil pH across northern China's grasslands decreased during 1980s–2000s, and (2) the magnitude of soil pH decrease depended on soil buffering capacity (i.e. the amount of soil carbonates, and soil CEC). Considering that soil pH > 7.0 in most part of the study area, we further hypothesized that changes in soil acidity were dominantly buffered by soil carbonates stored in grassland ecosystems.
Materials and methods
Study area
The study area included alpine grasslands on the Tibetan Plateau, temperate grasslands on the Inner Mongolian Plateau, and mountain grasslands in the Xinjiang area (Fig. S1). Our sampling sites covered the entire study area, extending between latitudes from 29.25° to 49.51° N and longitudes from 74.93° to 120.06° E. Mean annual temperature (MAT) and mean annual precipitation (MAP) ranged from −6.2 to 8.8 °C and 92.3 to 694.0 mm, respectively. The vegetation is dominated by six grassland types, including alpine steppe, alpine meadow, desert steppe, typical steppe, meadow steppe, and mountain meadow (Chinese Academy of Sciences, 2001). The soil types related to these six grassland types are defined as cold calcic soils, felty soils, brown calcic soils, castanozems, chernozems, and mountain meadow soils in China's soil classification system (Xiong & Li, 1987). These are categorized as corresponds to cambisols, haplic calcisols, kastanozems, hernozems, and umbric leptisols/dystric cambisols, respectively, in the soil taxonomy system of the Food and Agriculture Organization (FAO) of the United Nations (Xie et al., 2007).
Data sources
The soil pH datasets used in this study were derived from two sources. The first was 275 representative grassland soil profiles (Fig. S1), which were obtained from China's Second National Soil Inventory during the period 1979–1989 (Wu, 1991; Hou & Zeng, 1992; Feng & Wang, 1993; Zhao, 1993; Gong, 1994; Liu, 1995). The dataset contains layer thickness, soil pH, calcium carbonate, cation exchange capacity (CEC), and geographic locations for each soil profile. The second part of the soil pH dataset was derived from a recent regional soil survey conducted during 2001–2005 (Yang et al., 2010a). The inventory sampled 327 sites across the northern part of the country (Fig. S1). At each site, three soil profiles were excavated to take soil samples at depths of 0–10, 10–20, 20–30, 30–50, 50–70, and 70–100 cm. Soil samples were sieved through a 2-mm mesh, handpicked to remove plant detritus, and ground into a fine powder in a ball mill (NM200; Retsch, Hann, Germany). For comparison with those measurements from the National Soil Inventory, soil pH in the top 10 cm was determined to detect changes in soil acidity between the two sampling periods. Soil pH was measured using a pH meter in soil water suspension, with a soil: water ratio of 1 : 2.5 (Bao, 2005), which is exactly the same approach that was used for the National Soil Inventory during 1979–1989. For more details about field samplings and experimental measurements during 2001–2005, see Yang et al. (2010a).
Data analyses
Soil pH datasets were analyzed using the following three steps. First, we generated spatial distributions of soil pH in the surface layer for both sampling periods by interpolating site-level measurements to the whole study area. The data points of original datasets of soil pH were averaged within the same grid (0.05° × 0.05°), and then directly used for Kriging interpolation due to their normal distributions (Kolmogorov–Smirnov test, P > 0.05). During Kriging analysis, a semivariogram was constructed to explore spatial dependence in the target variable (e.g. Wittmer et al., 2010). Moreover, cross validation was conducted to evaluate the general performance of spatial interpolation, using mean error between estimated and measured values across sampling sites (e.g. Holmes et al., 2006). In addition, the variance distribution was generated to reveal the uncertainties involved in spatial interpolation (e.g. Zhang & McGrath, 2002). In this study, we tested three common types of semivariance models (i.e. Gaussian, Exponential, and Spherical) to describe the relationship between the semivariance and lag distance for soil pH. All semivariograms were optimized to obtain the best goodness-of-fit (evaluated as mean error) between models and data, and on which the subsequent spatial interpolation was based. An exponential model was finally adopted on the basis of subsequent results from cross validation (i.e. mean error was closest to zero). The optimized semivariogram was generated using the software ArcGIS 10.0 (Environmental Systems Research Institute, Inc., Redlands, CA, USA), and spatial interpolation was then conducted using the software IDRISI32 (Clark Labs, Worcester, MA, USA).
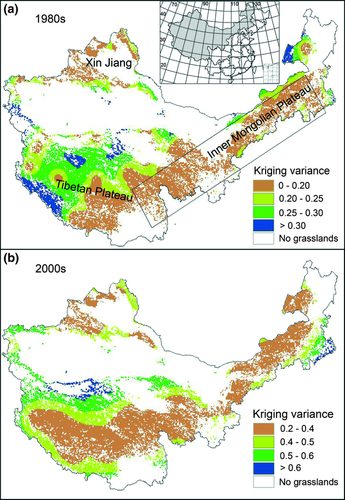
Second, we examined soil pH dynamics along a transect where Kriging variance approached a minimum during the two sampling periods (Fig. 3). The transect ranged from the central-southern Tibetan Plateau to the eastern Inner Mongolian Plateau, covered an area of 89.4 × 10⁴ km2 and 45.5% of total China's grassland area, including 53 major grassland community types (Chinese Academy of Sciences, 2001). Soil pH dynamics between the two sampling periods were determined by the difference of Kriging-based pH distributions across the transect. To quantify uncertainties involved in our estimations, we evaluated the 95% confidence interval of soil pH and its changes using a Monte-Carlo approach (e.g. Vandenbygaart et al., 2004; Beilman et al., 2008; Yang et al., 2009). Two-stage Monte-Carlo sampling was conducted to evaluate uncertainties derived from both spatial interpolation and field survey: (1) to account for potential errors from spatial interpolation, we randomly sampled from a normal distribution with the Kriging-based estimation of mean and variance of soil pH for each grid across the transect for both the 1980s and 2000s, from which we obtained the difference between the two periods; and (2) to account for potential errors from the field surveys, we then randomly sampled a certain size of grid and calculated the average for both periods and also the difference. The sampling size was determined by the number of sites investigated across the transect during the field survey. We replicated the above processes 10 000 times, from which we estimated the mean value and the corresponding 95% confidence interval (i.e. 250th and 9750th as the 2.5% and 97.5% boundaries).
Third, we explored the relationships between soil pH and climatic factors, and between soil pH dynamics and soil buffering capacity. Climate information on MAP and potential evapotranspiration for each sampling site was extracted from a national climate database (Peng et al., 2011). To examine the effect of soil buffering capacity on changes in soil acidity, we first generated spatial patterns of soil inorganic carbon (SIC) density (carbon amount per area; Y.H. Yang, unpublished data) and soil CEC (Fig. S2) at a resolution of 0.05° × 0.05°, by interpolating actual measurements from China's Second National Soil Inventory to the whole study area. We then extracted data of SIC density and soil CEC for 53 community types within the transect from their corresponding spatial distributions. We further examined the relationships of soil pH change with SIC density, soil CEC, and initial soil pH during the 1980s across 53 community types. Lastly, a general linear model (GLM) was used to evaluate integrative effects of these variables on soil pH dynamics. All statistical analyses except Kriging analysis were conducted using the software package R (R Development Core Team, 2007).
Results
Spatial patterns of soil pH across northern China's grasslands
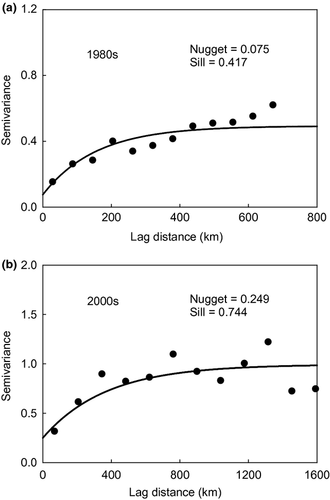
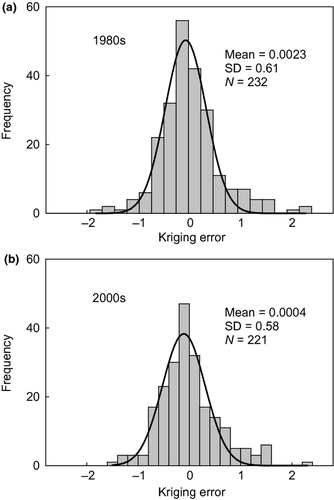
The semivariograms of soil pH in the surface layer during the two sampling periods were well characterized by exponential models (Fig. 1), with a nugget:sill ratio of ~1 : 5.5 for the 1980s and ~1 : 3 for the 2000s, respectively. The low proportion of nugget to nugget + sill demonstrated strong spatial dependence of soil acidity across the study area. Moreover, results from cross validation showed that predicted soil pH was consistent with measured values for both sampling periods, with a mean error of 0.0023 for the 1980s and 0.0004 for the 2000s, respectively (Fig. 2). The low mean error illustrated that Kriging interpolation was able to provide reliable estimates of spatial patterns of soil acidity across the study area for both sampling periods.
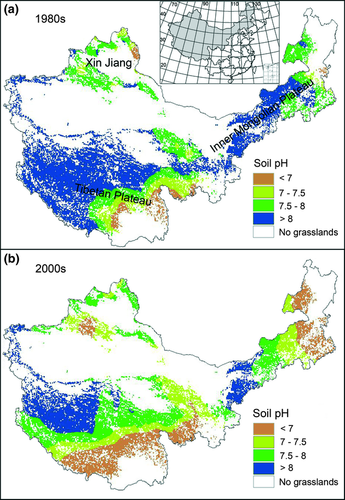
Although the Kriging interpolation provided a reliable prediction for most study areas, uncertainties remained in some areas, such as the northwestern Tibetan Plateau (Fig. 3). The relatively large uncertainties in these regions were caused by the lack of actual measurements due to the extreme climatic conditions and sparse traffic network in these areas (Fig. S1). Nevertheless, it should be noted that spatial interpolation generated the most robust estimation of soil acidity along a transect from the central-southern Tibetan Plateau to the eastern Inner Mongolian Plateau for both sampling periods (Fig. 3). Kriging results indicated that soil pH exhibited explicit spatial patterns across the study area (Fig. 4). It increased from the southeast to the northwest of the Tibetan Plateau, and also from the southwest to the northeast of the Inner Mongolian Plateau. In contrast to the Tibetan Plateau and Inner Mongolian Plateau, soil pH did not show explicit spatial patterns in the Xinjiang area.
Temporal dynamics of soil pH across northern China's grasslands
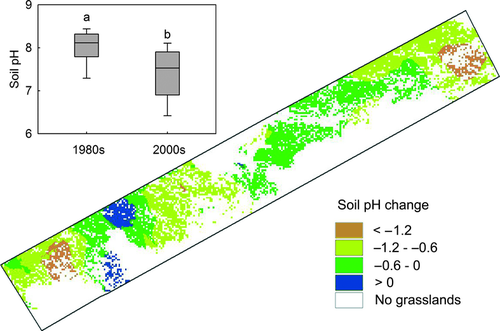
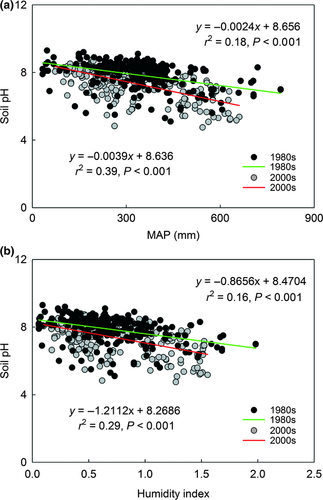
The transect-scale comparison of soil pH between the two sampling periods indicated that soil pH changes exhibited spatial heterogeneity (Fig. 5). Soil pH decreased in 94.6% of total pixels along the transect, while it increased in the remaining 5.4%. Mean soil pH declined significantly over the past two decades (P < 0.05), from 7.84 during the 1980s to 7.21 during the 2000s (Table 1). The net decrease in soil pH was estimated at 0.63 units, with a 95% confidence interval of 0.54–0.73 units. These results obtained from transect-scale analysis were consistent with the shift of the linear regression between soil pH and water availability (Fig. 6). Soil pH exhibited a strong negative relationship with MAP for both sampling periods (r 2 = 0.18, P < 0.001 for the 1980s, and r 2 = 0.39, P < 0.001 for the 2000s), with the linear regression moving downward from the 1980s to the 2000s (Fig. 6a). The downward shift of the regression indicated a decline of soil pH between the two sampling periods. A similar pattern was observed for the linear regression between soil pH and the humidity index (Fig. 6b).
| Grassland type | pH during the 1980s | pH during the 2000s | pH change |
|---|---|---|---|
| Alpine steppe | 7.80 [7.61, 7.98] | 7.32 [7.06, 7.57] | −0.48 [−0.72, −0.24] |
| Alpine meadow | 7.29 [7.10, 7.46] | 6.68 [6.50, 6.85] | −0.61 [−0.79, −0.43] |
| Desert steppe | 8.35 [8.26, 8.44] | 7.80 [7.60, 8.00] | −0.55 [−0.73, −0.37] |
| Typical steppe | 8.17 [8.07, 8.28] | 7.50 [7.26, 7.73] | −0.67 [−0.86, −0.50] |
| Meadow steppe | 7.90 [7.68, 8.11] | 7.10 [6.65, 7.56] | −0.80 [−1.15, −0.46] |
| Overall | 7.84 [7.74, 7.94] | 7.21 [7.07, 7.34] | −0.63 [−0.73, −0.54] |
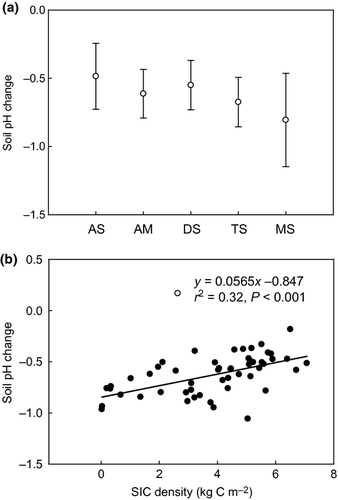
Soil pH dynamics exhibited substantial differences among five major grassland types along the transect (Fig. 7a). The largest decrease (0.80 units) was observed in meadow steppe on the Inner Mongolian Plateau, while the minimum decrease (0.48 units) occurred in alpine steppe on the Tibetan Plateau (Table 1). These variations in soil pH dynamics among various grassland types were closely associated with the amount of soil carbonates stored in grassland ecosystems (Fig. 7b). The magnitude of soil pH change increased with soil inorganic carbon density (r 2 = 0.32, P < 0.001), suggesting that larger pH decreases occur in those regions with low carbonate content. A GLM analysis further demonstrated that soil carbonates explained the largest proportion (32.4%) of the variation in soil pH dynamics, whereas soil CEC did not make a significant contribution (Table 2). In addition, the negative parameter value of initial soil pH (−0.147) in the GLM model indicated that larger soil pH decreases tended to occur in alkaline environments, although the effect of the initial soil pH was not statistically significant (P = 0.26).
| Source | df | Parameters | SE | MS | SS (%) |
|---|---|---|---|---|---|
| SICD | 1 | 0.038 | 0.025 | 0.59*** | 32.4 |
| CEC | 1 | −0.015 | 0.007 | 0.09 | 4.7 |
| pH1980s | 1 | −0.147 | 0.132 | 0.03 | 1.6 |
| Residuals | 48 | 61.3 |
- df, degree of freedom; SE, standard error; MS, mean square; SS, proportion of variance explained by the variable.
- ***P < 0.001.
Discussion
Soil acidification across northern China's grasslands
Soil pH across northern China's grasslands exhibited a widespread decrease during 1980s–2000s, supporting our first hypothesis. The decline of soil pH across the study area could have been caused by the following two drivers. First, the decrease in soil pH may be driven by the significant atmospheric N deposition across the study area during 1980s–2000s. Specifically, the rate of atmospheric N deposition along the transect selected to examine soil pH dynamics in this study, has been estimated at 5.2–18.7 kg N ha−1 yr−1, and this annual rate has accelerated during the past decade (Lü & Tian, 2007). The rate of atmospheric N deposition across northern China could be even higher after accounting for other components in atmospheric N deposition, such as particulate ammonium (NH4 +) in dry deposition and dissolved organic N (DON) in wet deposition (Liu et al., 2011). More importantly, rates of N deposition have been in excess of the critical loads that have detrimental impacts on receiving ecosystems in one of the major grassland distribution regions across northern China, i.e. the Inner Mongolian Plateau (Zhao et al., 2009). Atmospheric N deposition could thus be a principle driver of the decline of soil pH value observed across the study area.
Second, the decline of soil pH may also be related to the significant atmospheric S deposition across northern China's grasslands. During the past two decades, northern China has experienced rapid economic development, with an accompanying substantial increase in energy consumption in existing and newly industrialized parts of the country. Subsequently, a large quantity of SO2 emissions, largely from fossil-fuel combustion, has increased atmospheric S deposition in these regions during the 2000s, with maximum deposition occurring on the Inner Mongolian Plateau (Zhao et al., 2009). As one of the major components of acid deposition, atmospheric S deposition could also contribute toward soil acidification across the study area. In combination, both atmospheric N and S deposition could play a significant role in stimulating soil acidification across northern China's grasslands, although we cannot quantitatively differentiate their relative contributions, due to the lack of detailed spatial datasets of the drivers.
The decline in soil pH across northern China's grasslands between the 1980s and 2000s contrasts with the significant increase in soil pH in grassland ecosystems across England and Wales during a similar period (Kirk et al., 2010). Such a difference may be due to the different trends in the drivers of soil pH dynamics between China and the UK: significant atmospheric N and S deposition in China between the 1980s and 2000s, and legally enforced reductions in SO2 emissions in the UK leading to reduced S deposition (Fowler et al., 2005). A decrease in S deposition has been proposed to explain the recovery from acidification across the UK's grasslands (Kirk et al., 2010). The opposite direction of soil pH changes in grassland ecosystems in different parts of the world reflects the extent to which the production of major drivers of those changes (atmospheric S and N compounds) has been constrained by national legislation.
The degree of soil acidification depends on soil buffering capacity
The magnitude of soil pH changes across northern China's grasslands depended on the amount of soil carbonates, supporting our second hypothesis. Soil carbonates, rather than soil CEC, provide the primary buffering capacity, possibly due to the relatively high pH level across the study area. Based on our estimates, soil pH > 7.0 in 51 of the 53 grassland types within the transect (Fig. 4a). Such an alkaline environment is favorable for the accumulation of soil carbonates, and that is the case across northern China's grasslands (Pan & Guo, 2000; Yang et al., 2010b). The large amount of carbonates stored in grassland ecosystems may in turn provide a strong buffering capacity for increases in soil acidity (Brady & Weil, 2008; Kirk et al., 2010). To explore this possibility, we evaluated SIC dynamics across northern China's grasslands over the last two decades by comparing our concurrent measurements during 2001–2005 with historical records obtained from China's Second National Soil Inventory during the 1980s (Y.H. Yang, unpublished data). Our results revealed substantial carbon loss from soil carbonates across northern China's grasslands during the past two decades, with an average rate of 26.8 g C m−2 yr−1. The large amount of carbon loss from soil carbonates provides evidence for strong buffering processes during soil acidification across the study area.
Soils with high carbonate content have been considered to be relatively resistant to acidification due to their strong buffering capacity. In contrast to this view, our results demonstrate that grassland soils across northern China have experienced significant acidification from the 1980s to 2000s, although these soils have a relatively high inorganic carbon content (Pan & Guo, 2000; Yang et al., 2010b). Our results are supported by recent evidence revealed in other ecosystems. For instance, Lapenis et al. (2004) reported that forest soils developed on carbonate parent material in Russia became acidic between 1893 and the present. Likewise, Guo et al. (2010) observed that soil pH in China's cash-crop systems which store large amounts of carbonates, had declined significantly from the 1980s to 2000s. Interestingly, the mean soil pH decrease we observed across northern China's grasslands (0.63 units) is comparable with that (0.58 units) reported for one of China's cash-crop systems (Guo et al., 2010), which has a similar initial soil pH range (5.69–8.20) and a similar soil CaCO3 content (5–10%) as the grassland ecosystems examined in this study. Overall, all these lines of evidence consistently emphasize that carbonate-rich soils are also sensitive to acidification.
Potential consequences of soil acidification
It has been predicted that atmospheric N deposition in China will remain high for at least next 40 years (Galloway et al., 2008). Equally, atmospheric S deposition across northern China's grasslands cannot be expected to be alleviated in the short-term, although a controlling strategy of SO2 emissions has been implemented since 2006 (Zhao et al., 2009). Soil acidification across northern China's grasslands may thus be maintained for a long period. Sustained long-term soil acidification could induce the loss of base cations, and the release of mobile forms of aluminum, which are toxic to vegetation growth in grassland ecosystems (Bowman et al., 2008). Long-term soil acidification could also alter ecosystem structure and function in grasslands, such as the loss of plant biodiversity and the partial inhibition of carbon and N cycling processes (Liu et al., 2011). The increase in soil acidity in grassland ecosystems may be buffered to some degree by soil carbonates, but this process may induce a large amount of carbon loss from soil carbonates (Lapenis et al., 2004; Guo et al., 2010) and alter the carbon balance of these globally important ecosystems. To further improve our understanding of this issue, manipulation experiments with a gradient of N addition should be conducted to explicitly test potential responses of grassland ecosystems to soil acidification. More importantly, to slow the rate of soil acidification, a series of environmental policies, such as multi-pollutant control strategies that integrate measures to reduce both SO2 and NOx emissions (Zhao et al., 2009), should be implemented to gradually alleviate acid deposition across the country.
Acknowledgements
We thank members of the Peking University Sampling Campaign Team for their assistance in field investigations. We also thank members from Prof. Jingyun Fang's group for their assistance in laboratory analyses. We are grateful to J. Y. Fang, subject editor and four anonymous reviewers for their insightful comments on an earlier version of this manuscript. Pete Smith is a Royal Society-Wolfson Research Merit Award holder. This study was supported by the National Basic Research Program of China on Global Change (2010CB950600), National Natural Science Foundation of China (31021001 and 31170410), Strategic Priority Research Program of the Chinese Academy of Sciences (XDA05050503), and also contributed to the UK-China Sustainable Agriculture Innovation Network (SAIN).


