Modeling biophysical controls on canopy foliage water 18O enrichment in wheat and corn
Abstract
Leaf water 18O enrichment is an important factor controlling the H218O, C18OO, and O18O exchanges between the biosphere and the atmosphere. At present, there is limited capacity to explain the enrichment mechanisms in field conditions. In this study, three models of varying complexity were used to simulate the leaf water 18O enrichment at the canopy scale. Comparisons were made among the models and with high-frequency isotopic measurements of ecosystem water pools in wheat and corn. The results show that the steady state assumption was a better approximation for ecosystems with lower canopy resistance, that it is important to consider the effect of leaf water turnover in modeling the enrichment and not necessary to deal with time changes in leaf water content, and that the leaf-scale Péclet effect was incompatible with the big-leaf modeling framework for canopy-air interactions. After turbulent diffusion has been accounted for in an apparent kinetic factor parameterization, the mean 18O composition of the canopy foliage water was a well-behaved property predictable according to the principles established by leaf-scale studies, despite substantial variations in the leaf water enrichment with leaf and canopy positions. In the online supplement we provided a discussion on the observed variability of leaf water 18O composition with leaf and canopy positions and on the procedure for correcting isotopic measurements for organic contamination.
Introduction
In the process of transpiration, leaf water of terrestrial plants is more enriched in 18O than the water taken up by their roots, due to the slower diffusion (the kinetic effect) through the stomatal opening and the lower saturation vapor pressure (the equilibrium effect) of the heavier H218O molecules than the lighter H216O molecules. The enriched 18O signal is an important factor controlling the H218O, C18OO and O18O exchanges between the biosphere and the atmosphere and insights into its biophysical controls are highly relevant to issues of interest to biologists and global change scientists. The 18O tracer provides unique constraints on water and carbon cycles (Farquhar et al., 1993, 2007; Yakir et al., 1994), paleoclimate reconstruction (Gray & Thompson, 1976; Libby Pandolfi et al., 1976; Epstein & Yapp, 1977; Roden et al., 2000; Cullen et al., 2008) and the Earth's Dole effect (Dole et al., 1954; Bender et al., 1994; Hoffmann et al., 2004). During terrestrial photosynthesis, some of the CO2 entering chloroplasts is assimilated after having exchanged oxygen atoms with the 18O-enriched water, a process that transfers the leaf water 18O signal to plant materials (Farquhar et al., 1993). In recent years, an active area of research in global change concerns the 18O content in plant biomarkers as proxies of environmental conditions influencing the plant growth (Barbour et al., 2000; Evans & Schrag, 2004; Miller et al., 2006; Treydte et al., 2006; Barbour, 2007; Helliker & Richter, 2008; Sternberg, 2009; Kahmen et al., 2011). Central to these and other related studies is a mechanistic understanding on how biotic and abiotic factors influence the leaf water 18O/16O ratio (δL, in delta notation in reference to VSMOW).
A distinction should be made between leaf- and canopy-scale processes. The mechanistic models for foliage water 18O enrichment, reviewed below, are constructed at the leaf scale, requiring input variables measured immediately outside the leaf boundary layer. The above-mentioned applications, on the other hand, relate the enrichment to environmental conditions occurring outside the plant canopy, in the so-called atmospheric surface layer, and in this context, the appropriate modeling framework should be aimed at the canopy scale. Similarly, knowledge of the canopy scale 18O enrichment is a prerequisite for flux partitioning studies involving the C18OO and H218O tracers (Ogée et al., 2004; Lee et al., 2007). By providing the lower boundary conditions for global modeling systems of atmospheric H218O, C18OO and O18O (Farquhar et al., 1993; Ciais et al., 1997; Riley et al., 2002; Cuntz et al., 2003; Hoffmann et al., 2004), models of the 18O leaf enrichment at the canopy scale help to bridge field research, which generates local empirical knowledge, and a mechanistic understanding of the changes of these isotopologues in the atmosphere at the global scale.
Mathematical models for predicting δL are built on our understanding of fractionations associated with phase change of water during transpiration. The first model of the evaporative enrichment was based on the theory developed by Craig & Gordon (1965, referred to as C65 hereafter) and calculates δL with the assumptions of isotopic homogeneity in leaf water and the steady state, the latter of which states that the isotopic concentration of water entering the leaf equals that leaving the leaf. Dongmann et al. (1974, D74) employed C65 to calculate δL in non-steady state and retained the assumption that 18O is evenly distributed in the leaf water pool. In the non-steady state model of Farquhar & Cernusak (2005, F05), biotic controls are included by considering the heterogeneous isotopic composition of leaf water and temporal variations of leaf water content (W). Ogée et al. (2007) developed a two-dimensional model for non-steady state and associated the microscale spatial patterns of isotopic enrichment in the leaf with leaf geometry and nonuniform gas exchange parameters. Few studies have evaluated these models over full growing seasons and in field conditions (Wingate et al., 2010; Xiao et al., 2010; Griffis et al., 2011).
The goal of this modeling study is to evaluate the performance of the models C65, D74, and F05 against observations made in wheat and corn. Plant materials were collected at high temporal frequencies and in spatial replicates to characterize the canopy-scale δL. Data of this kind are rare because such a destructive sampling scheme may not be acceptable for natural ecosystems. As two major food crops, the areas of wheat and corn are over 31 and 24 million ha in China and over 230 and 160 million ha worldwide, respectively, according to the Food and Agriculture Organization of the United Nation, and represent two different photosynthetic modes (C3 and C4, respectively). Previous studies have shown that species with parallel vein structures, such as grasses, display much larger variations in δL with leaf position than species with reticulate venation such as cotton (Yakir et al., 1994; Wang & Yakir, 1995; Helliker & Ehleringer, 2000; Gan et al., 2002, 2003). Having parallel vein structures, wheat and corn may be good model systems for grassland ecosystems. By comparing the three models of varying complexity, we wish to quantify the influences of the Péclet effect, non-steady state and changes in leaf water content on the 18O enrichment at the canopy scale. We will investigate biotic (such as stomatal behavior and leaf water content) and abiotic controls (such as relative humidity and air turbulence) on the isotopic enrichment. Finally, we will test the hypothesis that despite substantial variations in δL with leaf and canopy positions (Appendix A, Online Supplement), the mean δ18O of foliage water at the canopy scale is a well-behaved property predictable according to the simple big-leaf model of biosphere-atmosphere interactions. In Appendix A, we present an analysis of the spatial variations with leaf position and canopy position observed in the wheat and corn experiments.
Materials and methods
Site and Data
The experiment was conducted at the Luancheng Agro-Ecosystem Experimental Station (37° 53′ N, 114° 41′ E, elevation 50 m), located in the North China Plain (Wen et al., 2012). Wheat (Triticum aestivum L.) was planted in November of 2007 and harvested on June 18, 2008 (day of year or DOY 170), with a maximum LAI of 4.5 and a maximum height of 0.75 m observed on DOY 120. Corn (Zea mays L.) was planted in the beginning of June before wheat harvest, with a maximum LAI of 4.2 and a maximum height of 2.77 m reached on August 16 (DOY 229). The wheat and corn cultivation was 16 ha in size. The fetch of the measurement site was greater than 200 m.
Isotopic measurements were made of ecosystem water pools. The O18/O16 ratio in water vapor was measured continuously using a tunable diode laser (TDL) trace gas analyzer (Model TGA100A; Campbell Scientific Inc., Utah, USA; Wen et al., 2012). Air was sampled at two heights above the canopy; they were increased from 0.6/1.6 m at the beginning to 1.1/2.1 m at the end of the wheat season and from 1.1/2.1 m at the beginning to 3.2/4.2 m at the end of the corn season, to adjust for plant growth. In this study, the measurement at the lower intake was used. Leaf, stem and soil samples were collected from four sampling plots within 50 m of the gas intakes. Leaf samples from the upper and lower canopy were archived separately, with the main leaf vein removed. In the case of corn, the leaf samples were a mixture of small sections from the upper, middle and bottom positions of the leaf. Soil samples were collected from the depths of 0–5, 15–20 and 40–45 cm. Water in these solid samples was extracted using a vacuum extraction system (West et al., 2006). Precipitation and dew water were also collected on an event-by-event basis. Precipitation was collected using an open container with mineral oil inside to block evaporation. During dew events, dew water was removed before dawn from the leaf surface using clean cotton balls and squeezed to sampling vials (Wen et al., 2012). Isotopic composition of the liquid water was measured with an isotopic ratio infrared spectroscopy (IRIS, Model DLT-100; Los Gatos Research, Mountain View, CA, USA) and corrected for organic contaminants following the procedure of Schultz et al. (2011). The average correction was 2.5‰ for leaf water samples and 1.1‰ for stem water samples. A subset of the leaf water samples was also measured with an isotope ratio mass spectrometer (IRMS, MAT 253; Finnigan Inc.) using a continuous flow method. The mean difference (standard deviation) between the IRIS and the IRMS measurements was −0.3‰ (±0.7‰, number of samples = 163). More details on the IRIS correction procedure are given in Appendix B.
For most of the experiment, collection of leaf, stem, and soil samples was made at midday between 12:00 and 14:00 LST every 2–4 days. On several days, additional collection was made at 06:00 and 18:00 LST. During four intensive periods (DOY 134-137, 142-144, 236-237, and 244-246), the samples were collected every 3–4 h. On DOY 256, five segments from the base to the tip of 4 corn leaves were sampled every 3 h from 6:00 to 18:00 LST.
Leaf water content (W, mol m−2 leaf area) was measured at the same time of leaf sampling. For the canopy-scale model simulations, the canopy foliage water content was computed as the product of W and LAI, in units of mol m−2 (ground area).
Supporting canopy-scale measurements included eddy covariance fluxes and routine meteorological variables. The latent heat, sensible heat, momentum, and CO2 fluxes were measured using a sonic anemometer (CSAT-3; Campbell Scientific Inc.) and a CO2/H2O infrared analyzer (LI-7500; Licor Inc., Lincoln, NB, USA) which were mounted at a 3-m height above the ground. Soil heat flux was measured at a depth of 2 cm with three heat flux sensors (HFP01; Campbell Scientific Inc.). Air temperature and humidity (HMP45C; Campbell Scientific Inc.), and wind speed (A100R; Vector Instruments, Rhyl, North Wales, UK) were measured at 1.4 m and 3.9 m heights. Net radiation was measured with a 4-component radiometer (CNR-1; Kipp & Zone, Delft, The Netherlands). Canopy temperature was measured with an infrared radiometer (IRTS-P; Apogee Instruments Inc., Logan, UT, USA). Soil temperature was measured using thermocouples (105T; Campbell Scientific Inc.) at 10, 20, and 50 cm depths. Soil water content was measured with water content reflectometers (CS616-L; Campbell Scientific Inc.) at 5, 20, and 50 cm depths. Precipitation was measured with a rain gauge (TE525MM; Campbell Scientific Inc.).
During the intensive periods, physiological measurement was conducted simultaneously with the leaf and stem sampling using a photosynthesis system (LI-6400; Licor Inc.). Stomatal resistance, transpiration, photosynthesis, leaf temperature (TL), and vapor pressure deficit (VPD) were measured at the same canopy positions of leaf sampling.
Models
Overall Model Structure
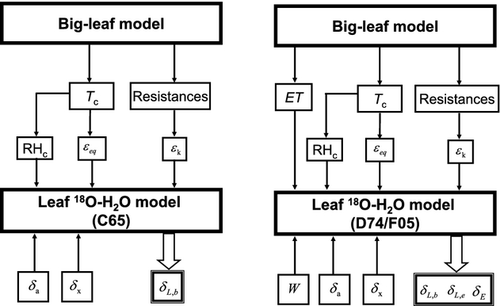
The simple isotopic land surface model (SiLSM) of Xiao et al. (2010) was modified here to simulate the H218O composition of foliage water. SiLSM was originally developed to simulate the isotopic exchanges of H218O and C18OO between ecosystems and the atmosphere. It consists of three submodels, i.e., a parameterization of the C18OO isoforcing, a submodel for H218O enrichment in foliage water and a big-leaf land surface model. In this article, the latter two submodels were employed. The H218O submodel of SiLSM is adopted from Farquhar & Cernusak (2005, F05). In this study, we also evaluated the performance of the leaf water enrichment submodels of Craig & Gordon (1965, C65) and Dongmann et al. (1974, D74). Fig. 1 shows the overall model structures, and Table 1 summarizes the key assumptions made by these isotope submodels. A detailed description of these modeling components is provided below.
| Models | W variation | Non-steady state | Péclet effect |
|---|---|---|---|
| Craig & Gordon (C65) | No | No | No |
| Dongmann et al. (D74) | No | Yes | No |
| Farquhar and Cernusak (F05) | Yes | Yes | Yes |
Isotopic Leaf Enrichment Submodels
 (1)
(1) (2)
(2) (3)
(3) (4)
(4) and δL,b are the 18O composite of bulk leaf water in steady and non-steady state, respectively, wi is the mole fraction of water vapor in the intercellular space, W is the leaf water content, rt is total resistance to the diffusion of water vapor, αk is the fractionation factor for diffusion (αk = 1 + εk/1000). The solution of Eqn 4 at time t is
 (5)
(5) is δL,b at time zero, and τ is a time constant given by
 (6)
(6) (7)
(7) (8)
(8)Big-leaf Model and Parameterizations
A big-leaf photosynthesis/transpiration model (Ronda et al., 2001) was employed to calculate the canopy evapotranspiration (ET), canopy temperature (Tc) and the resistance terms (ra, rb, and rc). Different values were used for the C3 wheat and C4 corn for the plant physiological parameters including the mesophyll conductance, the initial light use efficiency, the CO2 compensation point and the maximal primary productivity. The relative humidity referenced to canopy temperature (RHc), the equilibrium fractionation factor (εeq), and the apparent kinetic fractionation factor (εk), input variables required by the three isotopic submodels (Fig. 1), were then determined from the big-leaf model outputs.
The integrated model system was driven by observed meteorological and plant morphological variables. The input data common to the three isotopic models are the H218O composition of atmospheric water vapor (δa) and that of xylem water (δx). D74 and F05 also require data on W. A seasonal time series of W was established by linear interpolation between the weekly W measurements. Superimposed on the seasonal variation was a diurnal variation according to the diurnal composite W measured during the intensive periods. The input data of the big-leaf model include micrometeorological variables (air temperature, relative humidity, solar radiation, sky long-wave radiation, atmospheric CO2 concentration, wind speed, and friction velocity), soil temperature and moisture, leaf area index (LAI), and canopy height.
Tunable parameters of the model were optimized according to the observed latent heat flux and the foliage 18O content. The big-leaf model contains two tunable parameters in the stomatal resistance parameterization, the vapor pressure deficit constant D0 and the CO2 concentration constant a1 in eqn (11) of Ronda et al. (2001). They were tuned by a nonlinear least squares method to minimize the difference between the observed and the simulated latent heat flux. The optimization results were D0 = 0.50 kPa and a1 = 11.9 for wheat and D0 = 0.74 kPa and a1 = 4.2 for corn, using the complete dataset for each crop. The one free isotopic parameter Leff, the effective length in the Péclet number in F05, was tuned with the observed δL,b; the optimized value was essentially zero (Leff = 2.3 × 10⁻⁹ m) for both wheat and corn.
Results
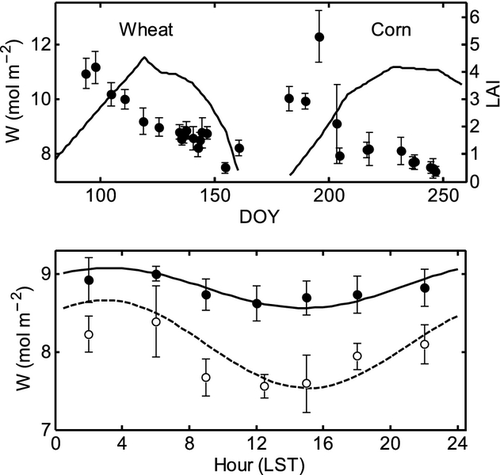
Leaf water content (W) is an important determinant of the non-steady state behavior of δL. The midday W decreased continuously from the early to the late growth season for both wheat and corn, and was low in midday and high in the early morning (Fig. 2). During the wheat season, the midday W decreased from 11.2 mol m−2 (mol water per m2 leaf area) on DOY 97 to 7.5 mol m−2 (DOY 154), with a seasonal total decline of 3.7 mol m−2. During the corn season, the midday W decreased from 12.3 mol m−2 (DOY 195) to 7.4 mol m−2 (DOY 246), with a change of 4.9 mol m−2. Measurements during the four intensive periods show that the day-to-night variation of wheat W ranged from 0.3 (DOY 144) to 1.1 mol m−2 (DOY 142), with a mean value of about 0.5 mol m−2, and that of corn W ranged from 0.8 (DOY 245) to 1.5 mol m−2 (DOY 244), with a mean value of 1.1 mol m−2. Thus both the seasonal and diurnal variations in W were smaller for wheat than for corn.
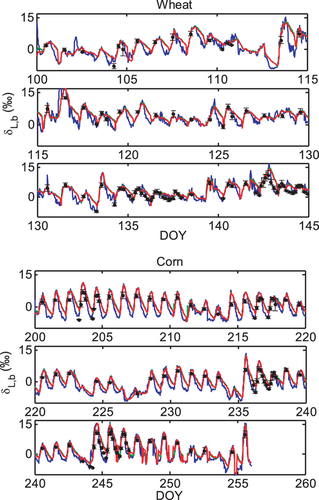
A notable feature is that the diurnal variations in wheat δL,b were smaller than those in corn δL,b (Fig. 3). The 24 h, midday (10:00–15:00 LST) and midnight (22:00–3:00 LST) mean values of the observed δL,b during the intensive periods were 2.7, 4.2, and 1.6‰ for wheat leaves, respectively, and 2.9, 8.0, and 0.1‰ for corn leaves, respectively, showing that the canopy mean δL,b of wheat was lower in midday and higher at night in comparison to that of corn, while the 24 h mean value of wheat was lower. For reference, the mean values of δx and δa were −6.8 and −11.5‰ during the wheat intensive periods, and −8.5 and −15.2‰ during the corn intensive periods, respectively.
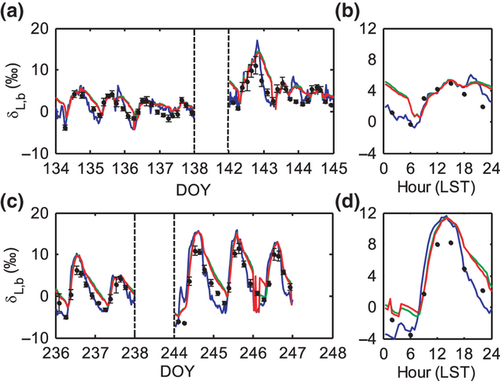
The observed diurnal variations were reproduced reasonably well by the three models (Figs 3 and 4), both on days with strongly diurnal variations (e.g., DOY 142) and on days that lacked variations (e.g., DOY 137 and 144). C65 slightly outperformed F05 and D74 in the simulation of the nighttime δL,b. The three models produced nearly identical results for the midday periods; the simulated midday δL,b was 4.4‰, 4.3‰, and 4.2‰ for wheat and 10.5‰, 9.8‰, and 9.6‰ for corn according to C65, D74 and F05, respectively. Larger differences were found in the simulated midnight δL,b, with mean values of 2.1‰, 4.7‰, and 4.4‰ for wheat and −2.0‰, 1.7‰, and 1.3‰ for corn according to C65, D74, and F05, respectively.
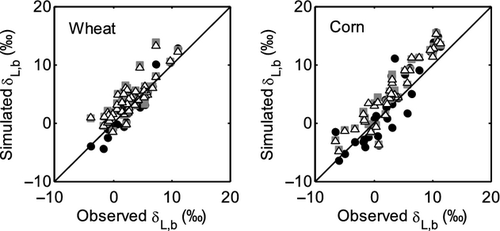
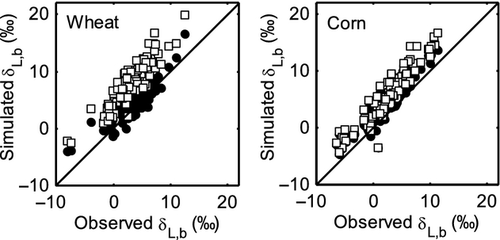
The three models also captured the seasonal variations (Fig. 5). Our measurement is among the few made on the seasonal time scale in the published literature (Welp et al., 2008; Wingate et al., 2010; Griffis et al., 2011; Kim, 2011). The mean model bias errors (ME) were less than 2.0‰, the root mean squares deviation (RMSD) less than 2.6‰ and index of agreement (IA) better than 0.90 (Table 2).
| C65 | D74 | F05 | ||||||||
|---|---|---|---|---|---|---|---|---|---|---|
| Crop | Period | IA | RMSD (‰) | ME (‰) | IA | RMSD (‰) | ME (‰) | IA | RMSD (‰) | ME (‰) |
| Wheat | Whole day | 0.95 | 1.6 | 0.4 | 0.90 | 2.1 | 1.0 | 0.91 | 2.0 | 1.0 |
| Nighttime | 0.88 | 1.8 | 1.0 | 0.73 | 3.6 | 3.3 | 0.75 | 3.3 | 3.0 | |
| Corn | Whole day | 0.92 | 2.6 | 1.6 | 0.91 | 2.6 | 2.0 | 0.92 | 2.5 | 1.9 |
| Nighttime | 0.83 | 2.4 | −1.7 | 0.76 | 3.5 | 2.3 | 0.80 | 3.0 | 1.8 | |
A summary of statistics on the model-predicted δL,b for the two crop seasons over three averaging periods (24 h, midday, and midnight) is shown in Table 3. Consistent with the results shown in Fig. 3, the difference among the three models mainly occurred at night, with the F05 and D74 predictions about 2.5‰ higher than the C65 prediction.
| Wheat | Corn | |||||
|---|---|---|---|---|---|---|
| C65 | D74 | F05 | C65 | D74 | F05 | |
| 24 h | 2.3 | 3.3 | 3.2 | −0.1 | 1.1 | 1.0 |
| Midday | 4.3 | 4.2 | 4.1 | 4.6 | 4.1 | 4.0 |
| Midnight | 1.0 | 3.4 | 3.1 | −3.4 | −0.6 | −0.9 |
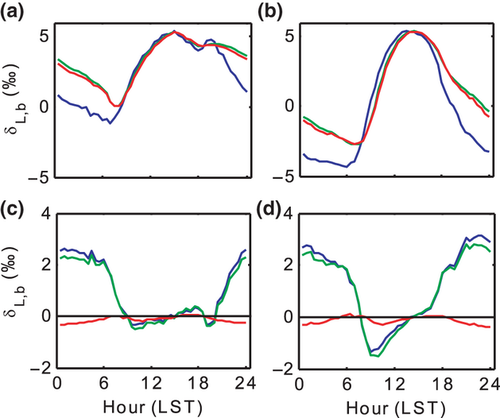
The model-to-model biases occurred primarily at night (18:00–06:00 LST) and between the steady state model C65 and the non-steady state models D74 and F05 (Fig. 6). Since the turnover time of leaf water was much longer at night (midnight average τ = 8.2 and 6.3 h for wheat and corn, respectively) than in the daytime (τ = 0.5 and 0.8 h), it took longer time for the leaf water to reach steady state, and therefore the effects of non-steady state on isotopic enrichment were more significant at night than during the day. The bias between F05 and D74 was negligible.
Our model simulations confirm the need to consider turbulent diffusion when calculating the canopy-scale foliage water 18O enrichment (Fig. 8). The apparent kinetic factor described by Eqn 3 is a canopy-scale property; it considers the different fractionation strengths associated with molecular and turbulent diffusion along the water vapor diffusion pathway (from the stomatal cavity to the atmospheric surface layer outside the canopy; Lee et al., 2009). For wheat, if the aerodynamic resistance ra was omitted in the apparent kinetic fractionation parameterization, the simulated δL,b was obviously biased high for all the models. For example, the F05 midday mean value of δL,b increased to 9.6‰ from the original 4.9‰. A similar model sensitivity has been shown for a soybean canopy (Xiao et al., 2010). Model performance for corn was less sensitive to the apparent kinetic fractionation formulation; omission of ra increased the midday F05 prediction by 1.1‰.
Discussion
Differences among the Three Models
Comparison of the three models of varying complexity (Table 1) allows us to differentiate the roles of various isotopic mechanisms underlying the observed variations. The relevant mechanisms include kinetic fractionation, leaf water turnover, time variations in W and the Péclet effect. With the inclusion of turbulent diffusion in the apparent kinetic fractionation formulation, all the three models captured reasonably well the observed seasonal variations of midday δL (Fig. 5 and Table 2). Numerous leaf- and canopy-scale studies have documented the effect of non-steady state (e.g., Farquhar & Cernusak, 2005; Lai et al., 2006; Seibt et al., 2006; Welp et al., 2008; Wingate et al., 2010; Griffis et al., 2011), the Péclet effect (Gan et al., 2002, 2003; Barbour & Farquhar, 2004; Farquhar & Cernusak, 2005) and the effect of the leaf water turnover rate (Griffis et al., 2011) on leaf water 18O enrichment. The modeling study of Xiao et al. (2010) suggests that for soybean the Péclet effect is less important to the leaf water 18O enrichment than the effect of non-steady state at the canopy scale. In this study, the optimized value of the scaled effective length Leff in the Péclet number was essentially zero for both the wheat and the corn ecosystem. The small Leff implies that at the canopy scale the Pélect effect was negligible so the only difference between D74 and F05 is that D74 did not consider the time variations in W whereas F05 did (Table 1). A comparison between the two suggests that the W time variations played a minor role on leaf water enrichment; their omission would introduce errors of no more than 0.3‰ at night (Fig. 6) and no more than 0.1‰ when averaged over the 24 h cycle (Table 3). The convergence of the F05 and the D74 predictions confirms the necessity to consider the effect of leaf water turnover in modeling δL and supports the postulation that it is not necessary to deal with changes in W in field conditions (Farquhar & Cernusak, 2005).
The roles of turbulent diffusion and leaf water turnover were not symmetrical through the course of the day. Omission of turbulence in the apparent kinetic fractionation parameterization would cause overestimation of δL primarily in the daytime hours, whereas omission of the leaf water turnover would cause underestimation of δL at night and with little consequence for the daytime. According to our sensitivity test, if both were omitted (as in the leaf-scale Craig-Gordon model), these errors would largely cancel out when averaged over periods of the diurnal cycle or longer, with the seasonal mean δL changing by less than 1.1‰ in comparison to the F05 predictions. However the mean values are misleading because the diurnal amplitude of δL would increase by 1.3‰ and 1.6‰ for wheat and corn, respectively, in comparison to the F05 predictions shown in Fig. 5.
The negligible difference between D74 and F05 indicates that the implicit assumptions made by D74 – that the 18O content is well mixed in leaf water and that W is invariant with time – are good approximations for canopy-scale applications. D74 has been used in regional and global scale models of atmospheric C18OO and H218O (Riley et al., 2002; Cuntz et al., 2003; Still et al., 2009). Although having a more rigorous treatment than D74 of the mass balance of the leaf water pool and having integrated the empirical knowledge about 18O diffusion in the pool, F05 is more difficult to use in regional and global models because of the tunable parameter Leff and the lack of information on the time variations in W. There are field measurements of W to help constrain the isotopic turnover time in several ecosystems (White, 1989; Yakir, 1998; Lai et al., 2006; Lee et al., 2007; Seibt et al., 2007; Xiao et al., 2010). W can also be inferred from satellite imagery (Yilmaz et al., 2008). However, few studies have reported the variations of W at fine enough time scales required by F05 (Farquhar & Cernusak, 2005; Xiao et al., 2010; Fig. 2).
Biotic versus Abiotic Controls on δL
In the C65 model, abiotic influences on δL, such as RHc and δa, are dealt with explicitly and biotic influences are realized through the alteration of the apparent kinetic fractionation factor by stomatal resistance (Farquhar et al., 1989). In the limit that kinetic fractionation is purely molecular, a situation equivalent to having either an infinite stomatal resistance or a negligibly small aerodynamic resistance, δL is constrained by two asymptotic values at low and high RH. Farquhar et al. (2007) show that δL – δx should equal the sum of the molecular kinetic factor (28‰) and the equilibrium factor (~9‰) at RHc = 0 and approximately zero at RHc = 1, giving a theoretical humidity sensitivity of about −0.40‰/% RH change (see also Still et al., 2009). The sensitivity observed in this study was about half of this theoretical value (−0.20‰/% RH). Welp et al. (2008) also observed a low sensitivity (−0.27‰/% RH) for a soybean system. According to the authors' unpublished data, the sensitivity was −0.33‰/%RH for a temperate deciduous forest (Kim, 2011) and −0.25‰/%RH for a short steppe grassland (Wen et al., 2012). It appears that δL is more sensitive to RH for natural ecosystems with larger stomatal resistance than for managed cropland ecosystems. Calculations with an isotopic large-eddy simulation model show that the sensitivity may also depend on surface roughness (Lee et al., 2012).
The strong negative correlation with RH can explain the larger daily variations of δL,b in corn than in wheat during the intensive campaigns (Fig. 3). The RHc diurnal variation was in the range of 31–96% for corn and of 44–96% for wheat. The larger RH variation in corn would result in a 3.7‰ larger variation in δL,b.
Because a weighting scheme was used to adjusting the apparent kinetic fractionation factor (Eqn 3), leaves with higher stomatal resistance are generally more enriched in H218O under similar hydrological conditions (Wang & Yakir, 1995; Barbour & Farquhar, 2000; Helliker & Ehleringer, 2000). C3 plants usually have lower stomatal resistance than C4 plants (Pearcy & Ehleringer, 1984; Knapp, 1993). In this study, the midday mean value of the canopy resistance rc was 0.8 m2 s mol−1 for wheat and 2.8 m2 s mol−1 for corn, respectively. The apparent kinetic fractionation factor εk of wheat was much lower than that of corn, with the midday mean values of 13.2 and 23.2‰, respectively. There were, however, negligible differences in the modeled seasonal mean δL between wheat and corn (Table 3). In other words, variations in abiotic conditions in the field can offset some or all of the stomatal effect.
The difference in canopy resistance contributed to the contrasting non-steady state behaviors between the two crops (Fig. 6). Largely because of the lower rc, wheat had a shorter isotopic turnover time (0.5 h) than corn (0.8 h) in the midday periods. As a result, its departure from steady state, as measured by the difference between the F05 and C65 models, was lower than 0.5‰ from 08:00 to 20:30 LST. Using this threshold, corn did not attain steady state except for a shorter duration in the afternoon (12:30–16:30 LST). Our results suggest that the steady state assumption is a better approximation in the daytime than at night and for ecosystems with lower canopy resistance (Cernusak et al., 2002, 2008).
Leaf water content W is a prescribed biological parameter in D74 and F05. The W value varies within the range of 3.4–18.4 mol m−2 (projected leaf area) in the literature (Farquhar & Cernusak, 2005; Lee et al., 2007; Seibt et al., 2007; Xiao et al., 2010), with a mean of 8.9 ± 4.2 mol m−2 (number of ecosystems = 7, including the two crops in this study). These studies suggest that the deviation from steady state at night should be greater for plants with larger W. For example, Seibt et al. (2007) compare nocturnal δL between a beech and a sitka spruce ecosystem. Their beech leaves have a low W value of 3.4 mol m−2 (the lowest among the studies cited above), and the difference between the D74 and C65 predictions is about 2‰ at midnight. In comparison, the difference between the two predictions is greater than 10‰ for the sitka spruce leaves having a high W of 11.8 mol m−2. Our W values fell between the values for their forests (Fig. 2) and the departure from steady state was approximately 3‰ at midnight (Fig. 6).
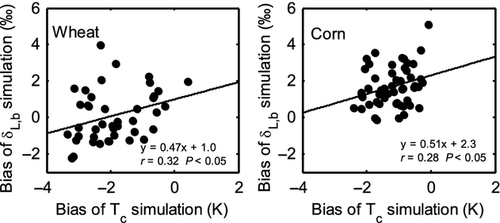
The modeled midday δL,b shows varying bias errors over the growing seasons (Fig. 5). The prediction errors do not seem to have stemmed from errors in the fractionation parameterizations because all the three submodels had similar biases. The bias of canopy temperature Tc simulation introduced errors in the wheat δL,b simulation (Fig. 7). The reader is reminded that Tc, an input variable to the isotopic submodels (Fig. 1), was solved from the surface energy balance equation in the standard LSM. A significant linear positive relationship was found between the bias of the Tc simulation and the bias of the δL,b simulation by F05 for both wheat (linear correlation r = 0.32, P < 0.05) and corn (r = 0.27, P < 0.05). Uncertainties in Tc is also a source of errors in δL,b simulated with the same isotopic LSM for a soybean ecosystem (Xiao et al., 2010). A low bias in Tc caused RH to increase which would decrease δL,b.
Leaf Scale versus Canopy Scale
The mean δ18O of foliage water at the canopy scale behaved in manners that were mostly predictable according to the mechanistic knowledge established by leaf- and plant-scale research. The large departure from steady state in the evening (Figs 3 and 6), the dominant role of RH and good accuracy of the C65 model in midday (Figs 3 and 5) are well-known features of δL at the leaf scale. However, this result is not intuitive given the large spatial variations in δL within the canopy layer (Appendix A). For example, it was common that the δL in the upper and lower canopy layers would differ by 5‰ in midday. Still larger variations were seen with leaf position: the base-to-tip gradient of the corn leaves could reach 15‰, a variation that was comparable to the temporal variations of the canopy mean δL over the whole growing season (Fig. 5). This last example is particularly noteworthy. Helliker & Ehleringer (2000) show that the Craig-Gordon model does not work for grass leaves because of a “string-of-lakes” effect or progressive enrichment along the parallel veins of these leaves. These large micro-scale “noises” were filtered out by our field sampling scheme (section on Materials and Methods) such that the δL values reported herein represented the algebraic mean across canopy and leaf positions. (Spatial replication further reduced the variability.) That the canopy δL was mostly predictable according to the Craig-Gordon model (Figs 3 and 5) while the microscale δL is not (Helliker & Ehleringer, 2000) suggests some strong compensation mechanism at the canopy scale.
The success of the δL models was helped by the canopy-scale apparent kinetic fractionation formulation (Fig. 8). A distinction between the canopy and the leaf scale is that the former involves turbulent diffusion in the atmospheric surface layer whereas the latter does not. Our results show that after turbulent diffusion has been accounted for in the apparent kinetic factor parameterization (Eqn 3), the leaf-scale enrichment models can be applied to the canopy scale with good accuracy. The effect of turbulent diffusion was stronger for wheat, which had lower canopy resistance, than for corn. We postulate that in global modeling studies the canopy-scale apparent kinetic formulation will improve model performance especially for productive ecosystems which generally have low canopy resistance.
The notion of the Péclet effect is, however, not transferable from the leaf scale to the canopy scale. At the leaf scale, this effect describes the process in which the H218O molecules diffuse, in the opposite direction of the mass flow of water, from the site of evaporation within the leaf to the less enriched water near the veins (Farquhar & Lloyd, 1993). At the canopy scale, however, the H218O molecules in the more enriched leaves (such as in the upper canopy at midday, Appendix A) cannot move via molecular diffusion to the less enriched leaves in another part of the canopy. This scale incomparability may be one reason why the canopy-scale version of the F05 model was forced to have a very small Péclet number. Thus, we are left with a paradoxical situation: The model implies a well mixed foliage water pool whereas the observations show that this pool was clearly stratified within the canopy (Appendix A). Overcoming this paradox will require more sophisticated multilayer models (Baldocchi, 1992; Leuning, 1995; de Pury & Farquhar, 1997; Ogée et al., 2003) than the simple big-leaf model used in this study.
The high model biases for corn (Figs 3 and 5) could have resulted from the simple upscaling schemes used both in the field measurement and in the models. Our leaf sampling strategy was meant to obtain the mean canopy 18O/16O ratio. In the case of corn, the samples were even mixture of small leaf segments taken at the base, middle, and tip of a selected leaf. The modeling study of Farquhar & Gan (2003) suggests that this method may have underestimated the true average because the H218O distribution with leaf position is not linear. In the LSM, the leaf photosynthesis and stomatal resistance were weighted by photosynthetically active radiation with a fixed canopy light extinction coefficient of 0.6. Unlike multi-layer and two-leaf models (de Pury & Farquhar, 1997), this scaling method is incapable of handling the interaction between stomatal behavior and leaf-scale humidity variations in the canopy. Strictly speaking, there is a fundamental difficulty in interfacing the two-leaf model with the isotopic parameterizations. This is because mass balance requires that we track the time rate of changes of both 18O and 16O masses in a fixed set of foliage (as in Eqn 7), but the fractions of sunlit and shaded leaves are variable with solar elevation. Now that the results were found to be insensitive to the temporal variations in W, it is not necessary to consider the time rate of changes in the two-leaf model.
In leaf-scale studies, a number of other biotic factors are proved to be important in controlling the leaf water 18O enrichment. Helliker & Ehleringer (2000) report that leaf water 18O enrichment of C4 grasses is greater than that of C3 grasses under controlled conditions; They attribute this to interveinal differences between the two functional groups. The modeling study of Ogée et al. (2007) suggests that it is the difference in mesophyll tortuosity between C3 and C4 plants rather than in leaf length or interveinal distance that contributes to the stronger enrichment in C4 leaves than in C3 leaves. Our big-leaf model does not consider these morphological traits through mathematical parameterizations.
Implications for Global Change Studies
The δ18O of foliage water is an important determinant of atmospheric O18O and C18OO budgets. The classic theories of the Earth Dole effect (Bender et al., 1994) and vegetation effects on atmospheric C18OO (Farquhar et al., 1993) have relied on the simple Craig-Gordon model for the δL calculation. That C65 performed equally well in daylight hours as the more sophisticated D74 and F05 suggests that the steady state assumption is acceptable for determining the photosynthetic O18O and C18OO fluxes at the canopy scale. Perhaps these theories can be improved by incorporating a variable, rather than a constant, kinetic fractionation factor. Since more productive ecosystems generally have lower canopy resistance rc and the apparent kinetic factor decreases with decreasing rc, this approach may alter the regional distributions of O18O and C18OO by reducing the contributions of cropland and native vegetation in warm and wet climates and increasing those in dry and cool climates.
For partitioning the net ecosystem CO2 flux into its gross component fluxes, 18O is a useful tracer. Flux partitioning is of interest to global change scientists because the eddy covariance technique can only measure the net flux but validation of carbon flux models requires data on the component fluxes. The 18O content of foliage respiration in the dark is extremely sensitive to δL and is much more enriched (Cernusak et al., 2004) than that of soil respiration (e.g., Wingate et al., 2010; Santos et al., 2011). Incorporating the non-steady behaviors in the δL calculation (Fig. 6) will further increase the difference between the two isotopic end members.
Acknowledgements
We thank the three journal reviewers whose comments have improved this article. This study was supported by the National Basic Research Program of China (grant 2010CB833501), the National Natural Science Foundation of China (grants 30970517, 31070408 and 31100359), the Strategic Program of Knowledge Innovation of the Chinese Academy of Sciences (grant KZCX2-EW-QN305), the U. S. National Science Foundation (grant ATM-0914473), the Ministry of Education of China (grant PCSIRT), NUIST scientific foundation (grants KLME1006 and 20100357) and the Jiangsu Provincial Government (grant PAPD).


