Phenology shifts at start vs. end of growing season in temperate vegetation over the Northern Hemisphere for the period 1982–2008
Abstract
Changes in vegetative growing seasons are dominant indicators of the dynamic response of ecosystems to climate change. Therefore, knowledge of growing seasons over the past decades is essential to predict ecosystem changes. In this study, the long-term changes in the growing seasons of temperate vegetation over the Northern Hemisphere were examined by analyzing satellite-measured normalized difference vegetation index and reanalysis temperature during 1982–2008. Results showed that the length of the growing season (LOS) increased over the analysis period; however, the role of changes at the start of the growing season (SOS) and at the end of the growing season (EOS) differed depending on the time period. On a hemispheric scale, SOS advanced by 5.2 days in the early period (1982–1999) but advanced by only 0.2 days in the later period (2000–2008). EOS was delayed by 4.3 days in the early period, and it was further delayed by another 2.3 days in the later period. The difference between SOS and EOS in the later period was due to less warming during the preseason (January–April) before SOS compared with the magnitude of warming in the preseason (June–September) before EOS. At a regional scale, delayed EOS in later periods was shown. In North America, EOS was delayed by 8.1 days in the early period and delayed by another 1.3 days in the later period. In Europe, the delayed EOS by 8.2 days was more significant than the advanced SOS by 3.2 days in the later period. However, in East Asia, the overall increase in LOS during the early period was weakened in the later period. Admitting regional heterogeneity, changes in hemispheric features suggest that the longer-lasting vegetation growth in recent decades can be attributed to extended leaf senescence in autumn rather than earlier spring leaf-out.
Introduction
Terrestrial vegetation occupies 75% of the Earth's land surface and is widely distributed all over the globe (United Nations Environment Programme, 2009). Changes in the vegetation growing season (i.e., phenology) are crucial factors that help us to understand the dynamic responses of the terrestrial ecosystem to climate change. Variations in the vegetation growing season affect changes in climate since they affect surface radiation, temperature, energy exchange, the hydrological cycle, and terrestrial carbon uptake (Myneni et al., 1997; Schaffer et al., 2005; Piao et al., 2007; Bonan, 2008; Sitch et al., 2008; Jeong et al., 2011). Furthermore, changes in the vegetation growing season can be considered when evaluating crop production in key production areas (Brown & de Beurs, 2008, 2010). Thus, understanding how vegetation growth has changed in response to observed changes in climate can help us to understand the significance of future ecosystem dynamics.
Changes in the vegetation growing seasons during the 1980s and 1990s have been widely documented. Several authors have analyzed field observation data on first-flowering and/or leaf-unfolding dates (e.g., Menzel & Fabian, 1999; Abu-Asab et al., 2001; Chmielewski & Rötzer 2001; Ho et al., 2006); these efforts are summarized in Table 1. In particular, Menzel (2000) documented that in Europe, during the period 1959–1993, leaf-unfolding in spring was generally advanced by 6 days during the whole period depending on the plant species. Moreover, Abu-Asab et al. (2001) found that the flowering dates of earlier-flowering species in the Washington, DC (USA) area advanced from −3.2 to −46.0 days during the period 1970–1999. In Korea, Ho et al. (2006) reported changes in flowering in Seoul; in particular, they reported that blooming occurred earlier than normal by −0.5 to −2.4 days decade−1. They obtained their results by analyzing the first flowering dates for a period of 83 years (1922–2004), which is one of the longest periods for which published records are available (Table 1). Thus, diverse local phenological observations around the globe (e.g., Europe, United States, and Asia) clearly show earlier starts to vegetation growth.
| Reference | Period | Type | Region | Change (days) | ||
|---|---|---|---|---|---|---|
| Start | End | Length | ||||
| Myneni et al. (1997) | 1981–1991 | PAL | Global | −8 | 12 | |
| Tucker et al. (2001) | 1982–1991 | AVHRR | 45–75°N | −6 | 4 | |
| Tucker et al. (2001) | 1992–1999 | AVHRR | 45–75°N | −2 | 0.4 | |
| Zhou et al. (2001) | 1981–1999 | GIMMS | Eurasia | −7 | 18 | |
| Zhou et al. (2001) | 1981–1999 | GIMMS | N America | −8 | 12 | |
| Stockli & Vidale (2004) | 1982–2000 | PAL | Europe | −10.8 | 19.2 | |
| Chen et al. (2005) | 1982–1993 | PAL | China | 17 | ||
| de Beurs & Henebry (2005) | 1985–1999 | PAL | N America | −9.3 | ||
| de Beurs & Henebry (2005) | 1985–2000 | PAL | Eurasia | −6.7 | ||
| Piao et al. (2006) | 1982–1999 | GIMMS | China | −14 | 6.65 | 19 |
| Julien & Sobrino (2009) | 1982–2003 | GIMMS | Global | −6.3 | 1.1 | 12.1 |
| Jeong et al. (2009a) | 1982–1999 | PAL | East Asia | −7 | ||
| Menzel & Fabian (1999) | 1951–1996 | P (L) | Europe | −6.3 | 4.5 | 10.8 |
| Beaubien & Freeland (2000) | 1987–1996 | P (F) | Canada | −8 | ||
| Menzel et al. (2001) | 1951–1996 | P (L) | Germany | |||
| Ahas et al. (2002) | 1951–1998 | P (F) | C and W Europe | −28 | ||
| Ahas et al. (2002) | 1951–1999 | P (F) | E Europe | 10 | ||
| Chmielewski & Rötzer (2002) | 1969–1998 | P (F) | Europe | −8 | ||
| Penuelas et al. (2002) | 1952–2000 | P (L,F) | Spain | −16 | 13 | 29 |
| Wolfe et al. (2005) | 1965–2001 | P (L) | NE USA | −6 | ||
| Sparks et al. (2005) | 1980–2000 | P (L) | UK | |||
| Ho et al. (2006) | 1922–2004 | P (F) | Korea | −13 | ||
| Schwartz et al. (2006) | 1955–2002 | P (L,F) | NH | −4.8 | ||
- AVHRR, Advanced Very High Resolution Radiometer; PAL, Path finder AVHRR Land; GIMMS, Global Inventory Modeling and Mapping Studies.
Beyond the local focus, many authors have analyzed the satellite-measured normalized difference vegetation index (NDVI), which indicates global or hemispheric changes in growing seasons (e.g., Myneni et al., 1997; Zhou et al., 2001; Gong & Ho, 2003; de Beurs & Henebry, 2005; 2008; Jeong et al., 2009a; White et al., 2009). Myneni et al. (1997) reported that for the Northern Hemisphere during the period 1982–1991, the start of the growing season (SOS) advanced by 8 days, and the end of the growing season (EOS) was delayed by 4 days; this indicates that the length of the growing season (LOS) (period between SOS and EOS) increased by 12 days in that decade. Zhou et al. (2001) extended the period considered in the analysis of NDVI data by Myneni et al. to 1997 and found that LOS increased by 18 days in Eurasia and by 12 days on the North American continent for the period 1982–1999. Additional analyses carried out by Tucker et al. (2001) for higher northern latitudes (40°–70°N) and the period 1982–1999 yielded similar results as previous studies: trends toward the earlier onset and delayed end of growing seasons were observed.
Longer vegetation growing seasons are mostly attributed to several climate factors, such as temperature, humidity, water availability, and insolation (Menzel & Fabian, 1999; Linderholm, 2006). The reproductive cycles of vegetation in temperate zones over the Northern Hemisphere are primarily controlled by temperature (Zhou et al., 2001; Gong & Ho, 2003; Ho et al., 2006; Piao et al., 2006; Jeong et al., 2009b). Some studies have also indicated that changes in the moisture availability for vegetation growth may lead to changes in water availability, particularly in arid regions (Angert et al., 2005; Piao et al., 2006; Brown & de Beurs, 2008). Thus, long-term variations in the growing seasons of temperate vegetation and changes over the Northern Hemisphere are mainly explained by changes in temperature and precipitation during the last several decades. Nevertheless, there still exist uncertainties regarding this conclusion because the time scale considered in most previous studies was limited (i.e., mostly confined between 1981 and 1999); furthermore, in previous studies, satellite-derived NDVI data were used, and only local perspectives were considered by collecting first flowering data. The predominant physical processes affecting vegetation growth vary significantly with regions and seasons; furthermore, although changes in EOS play an important role in LOS changes, long-term EOS variations have not been sufficiently understood compared with SOS changes.
The primary objective of this study was to evaluate long-term variations in the vegetative growing seasons over the Northern Hemisphere for 1982–2008 by using NDVI data. Recently, researchers carrying out some observational studies (Angert et al., 2005; Lotsch et al., 2005; Buermann et al., 2007) reported that intensified dry atmospheric conditions after 1999 caused a decline in vegetation greenness over the Northern Hemisphere. Their results also suggested that declining greenness may reflect changes in the vegetation phenology in that region. Furthermore, Cane (2010) reported that significant warming trends in the last two decades of the twentieth century have paused in the past decade. This pause can change the long-term trends in phenological events. In addition, because most satellite-derived phenological studies are focused on changes that occurred before 1999 except for Julien & Sobrino (2009) (see Table 1), we also compared the changes in vegetation growing seasons during the early period (1982–1999) with those over the entire period (1982–2008). The differences between the two periods can also help clarify whether the pattern of earlier and longer-lasting growing seasons during the early period has continued to prevail in recent decades. To our knowledge, the span of 27 years over which changes in satellite-derived temperate vegetation phenology have been recorded is the longest duration considered from a hemispheric perspective.
Data and methods
Data
NDVI data were obtained from advanced very high-resolution radiometers (AVHRRs) on NOAA's polar-orbiting satellites. NDVI is a quantitative measure of photosynthetically active vegetation and is calculated from solar energy reflected by land surface at visible (RVIS) and near-infrared (RNIR) wavelengths such that NDVI=(RNIR–RVIS)/(RNIR+RVIS). Healthy vegetation absorbs most visible light and reflects a large portion of NIR light and thus has higher NDVI; sparsely vegetated or bare surfaces reflect similar amounts of visible and NIR light and thus have lower NDVI. For this reason, NDVI is considered to be a general biophysical parameter that indicates the ‘greenness’ of vegetation. The data were produced by the NASA Global Inventory Monitoring and Modeling Systems (GIMMS) group with a spatial resolution of 8 km × 8 km and 15-day temporal resolution for the period 1982–2008. Several data corrections (e.g., aerosol, cloud, volcanic, and sensor degradation) were performed to improve the data qualification. Details on the data are found in Tucker et al. (2005).
To evaluate the environmental conditions related to changes in growing seasons, the daily mean temperature was examined. In general, variations in temperature are considered to be a main factor for regulating vegetation growth in temperate forests in mid- to high-latitude regions (Linderholm, 2006). Phenological events (e.g., leaf onset/offset, bud-burst, and flowering) are the function of accumulated or mean temperatures. The temperature data were obtained from the National Centers for Environmental Prediction/National Center for Atmospheric Sciences (NCEP/NCAR) reanalysis dataset (Kalnay et al., 1996). The data types have a 2.5°-grid resolution and show good agreement with global in situ observations (Kalnay et al., 1996; Adler et al., 2003). For this reason, these data types are widely used to evaluate changes in vegetation greenness, growing season, and phenology (Tucker et al., 2001; Slayback et al., 2003;Brown & de Beurs, 2008; Prince et al., 2009).
Methods
 (1)
(1)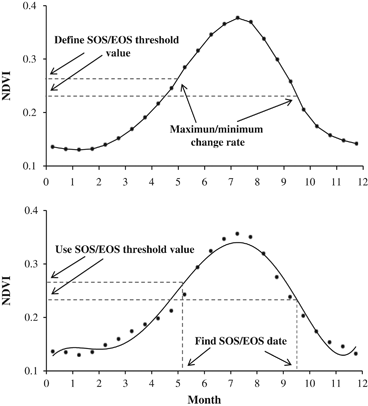
Method for retrieving SOS (start date of growing season) and EOS (end of growing season) using NDVI time series.
We determined the time t with the maximum NDVIratio and then used the corresponding NDVI(t) as the NDVI threshold for the SOS date. Likewise, we determined the time t with the minimum NDVIratio and the corresponding NDVI(t+1) at time (t+1) as the NDVI threshold for the EOS date. Using the NDVI threshold from climatology data, the SOS and EOS in each year were calculated. Furthermore, the LOS was obtained by defining the period between SOS and EOS in each grid point.
 (2)
(2)Periods of temperature related to SOS and EOS variations. To determine the changes in growing seasons over the Northern Hemisphere, changes in the related atmospheric environments (e.g., temperature) were examined for two different periods: 1982–1999 and 1982–2008. The reproductive cycles of vegetation in temperate zones are primarily controlled by temperature; in addition, preseason temperatures before phenological events (e.g., SOS and EOS) have been shown to affect the timing of SOS and EOS (Zhou et al., 2001; Ho et al., 2006; Piao et al., 2006; Jeong et al., 2009b). To determine the temperature periods with the most influence on the timing of SOS and EOS, correlation coefficients between the annual SOS (and/or EOS) and mean preseason temperature were calculated. The correlation coefficients between two variables are calculated by detrended values. The detrended values can help in obtaining more meaningful explanations for the relationships between two variables. Afterwards, statistically significant temperature periods were analyzed only for the analysis period.
Results
Climatology of SOS, EOS, and LOS
Figure 2 displays the spatial distributions for the climatology of SOS, EOS, and LOS over the Northern Hemisphere during 1982–2008. In Fig. 2a, the climatological SOS dates are widely distributed from 80 days (approximately March 21) to 140 days (May 20): lower values were observed at low latitudes and vice versa. Those progressive patterns from low to high latitudes are generally considered to be a ‘green wave’ or ‘vernal front,’ and their distributions are mainly attributed to the climatological temperature regime (Schwartz, 1994; Schwartz et al., 2006). In terms of longitude, the SOS of the Atlantic basin region (Europe and northeastern USA) was later than that of the Pacific basin region (East Asia and northwestern USA). This is likely due to different vegetation growth responses to atmospheric conditions (i.e., temperature and precipitation) resulting from sea surface temperature variations between tropical regions and the Atlantic basin (Reynolds & Smith, 1994).
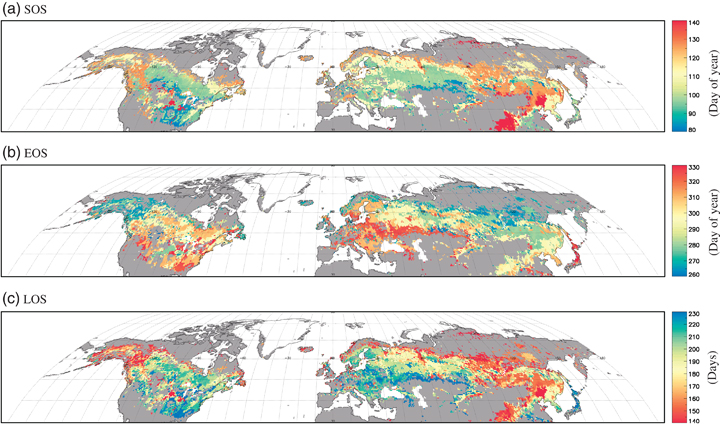
Spatial distributions of climatology of the SOS, EOS, and LOS of temperate vegetation in the Northern Hemisphere for 1982–2008.
The EOS dates range from 260 days (September 17) to 330 days (November 26), and their spatial distributions are inverse to the climatology of the SOS dates (Fig. 2b). The earlier start to vegetation senescence occurs where there is later emergence of vegetation. Regions with earlier mean SOS show longer LOS than regions with later mean SOS (Fig. 2c). Specifically, the LOS of lower latitudes are 50% longer than those of higher latitudes, and the LOS of the Atlantic basin are 48% longer than those of the tropical basin. These spatial distributions of climatological LOS are consistent with Koppen climate classifications in the temperate vegetation over the Northern Hemisphere (McKnight & TLHess, 2000). Therefore, these obtained SOS, EOS, and LOS values are appropriate for analyzing the regional differences of long-term variations of vegetative growing seasons.
Changes in SOS, EOS, and LOS
To examine variations in these three phenological parameters (SOS, EOS, and LOS) for the temperate vegetation over the Northern Hemisphere as a whole, the analysis domain was averaged to evaluate interannual variations. Figure 3 shows the interannual variations of the average SOS, EOS, and LOS for temperate vegetation during 1982–2008. The dashed line indicates the climatology of each event, and the blue line shows the 5-year moving average of each parameter. As seen in Fig. 3a, changes in SOS showed high interannual variations. Observed positive anomalies were predominant during the 1980s, whereas negative anomalies were observed during the 1990s and 2000s. Overall, long-term variations in SOS showed ‘earlier spring’ features, which is consistent with previous studies (see Table 1). Here, although the annual SOS advanced slightly during 1990s, the signal was reduced in the 2000s. When the NDVI data were analyzed with the 5-year moving average, weakening of the earlier signal was rather clearly observed during the 2000s. Because of data limitations, previous studies could not show these expanding features after 1999. Annual changes in EOS also have strong interannual variations (Fig. 3b). In contrast to SOS, negative anomalies were observed during the 1980s, whereas positive anomalies were observed during the 1990s and 2000s, which indicates a ‘delayed autumn’ in recent decades. Asymmetric long-term variations of SOS and EOS were shown to have led to increases in the total LOS (Fig. 3c). With the weakening of the earlier SOS trends, a more delayed EOS clearly led to longer-lasting LOS in the 2000s.
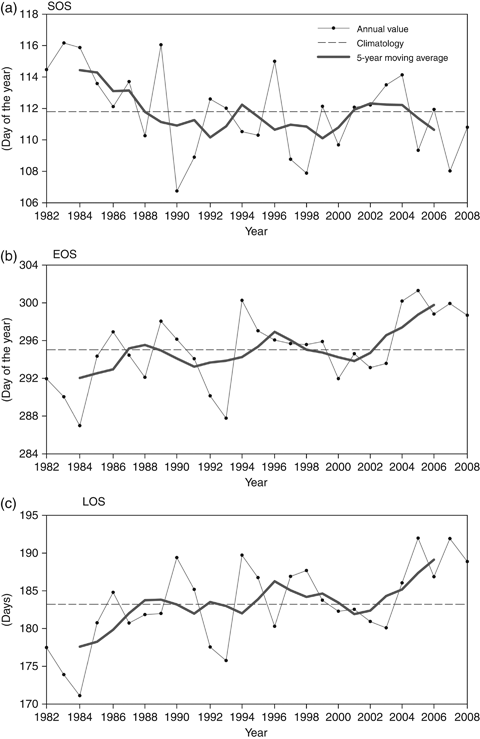
Interannual variations of area-averaged SOS, EOS, and LOS of temperate vegetation in the Northern Hemisphere for 1982–2008.
As seen in Fig. 3, there were likely observed changes in the magnitude of trends during the late 1990s. Thus, to find the years of inflection for the whole analysis period (1982–2008) of the SOS, EOS, and LOS, we evaluated the inflection point by changing-point analysis (e.g., Ho et al., 2006). First, because the purpose of this study was to evaluate long-term changes in the growing season, we removed high-frequency variability. Before applying the changing-point analysis, the annual value of each phenological events was smoothed using a 5-year moving window average to remove statistical uncertainties caused by the first and last values and individual outliers in the time-series. There were two changing points observed in the SOS and EOS time series. The first significant changes in the SOS and EOS anomalies over the entire analysis period were observed around 1988–1990 and 1993–1995, respectively. The second significant changes were observed around 1999–2001 and 1999–2002, respectively. These two peaks are clearly shown in the figure. In addition, when we changed the moving window from 5 to 10 years, the results were consistent. Furthermore, the differences between the periods before and after 1999 helped us to understand the changes in the growing season in recent decades compared with previous studies on growing season changes for 1982–1999. Using the results of the changing-point analysis and comparing the previous studies in the period 1982–1999, we picked the year 1999 as the division point for the whole analysis period.
Linear trends of SOS during 1982–1999 were negative at −0.28 year−1, while the magnitude of the negative trend was slightly reduced (e.g., −0.13 year−1) when the period was extended until 2008. Furthermore, the autocorrelations in the SOS trends for 1982–1999 were reduced from 0.55 to 0.36 after 1999, suggesting the reduced statistical significance for negative trends in recent decades. In contrast to SOS trends, the positive trends of EOS during 1982–1999 were slightly amplified when the period was extended to 2008 from 0.26 to 0.28 year−1. These two positive trends were found to be statistically significant at the 95% confidence level by using the one-tailed t-test. By summing up nonlinear relationships between changes in SOS and EOS, positive trends in LOS during 1982–1999 were slightly reduced in recent decades from 0.56 to 0.39 year−1. The reduced positive LOS trends can be mainly attributed to insignificant changes in SOS in recent decades.
The trends for SOS, EOS, and EOS, which were found in the area-averaged time series, may be related to diverse regional features. Thus, to evaluate more detailed spatial and temporal variations and compare them to previous results (shown in Table 1), the analysis period was divided into 1982–1999 and 1982–2008. Figure 4 shows the spatial distributions of the SOS linear trends for (a) 1982–1999 and (b) 1982–2008 These trends were determined using the standard least-squares fitting method, and the dotted marks in the figure outline statistically significant changes at the 95% confidence level by one-tailed student's t-tests. From 1982 to 1999, most of the Northern Hemisphere experienced advanced SOS with time except for central Asia and some parts of western and central North America (Fig. 4a). A strong negative SOS trend (>0.8 days yr−1) significant at 95% was observed in many regions, particularly over East Asia, northwestern Canada, and most parts of Europe. This is strongly consistent with previous studies on changes in the first-flowering date and bud-burst in those regions (Menzel & Fabian, 1999; Zhou et al., 2001; Ahas et al., 2002; Stockli & Vidale, 2004; Sparks et al., 2005; Ho et al., 2006; Karlsen et al., 2008; Jeong et al., 2009a; Julien & Sobrino, 2009). However, after 1999, linear trends of SOS for 1982–1999 over most parts of the Northern Hemisphere had changed their signs or magnitude of trends (Fig. 4b). Specifically, in northwestern Canada, statistically significant negative SOS trends for 1982–1999 changed to insignificant trends. Over the eastern United States and East Asia, strong negative SOS trends were reduced over the longer period. However, in southwestern Canada, insignificant positive trends turned into statistically significant positive trends over the longer period. In addition, strong negative SOS trends in Europe kept their magnitude in the last decade. Although the spatial heterogeneity of trends existed, overall negative SOS trends for 1982–1999 were reduced or changed their signs from negative to positive trends, which suggests the weakening of ‘earlier spring’ in recent decades.
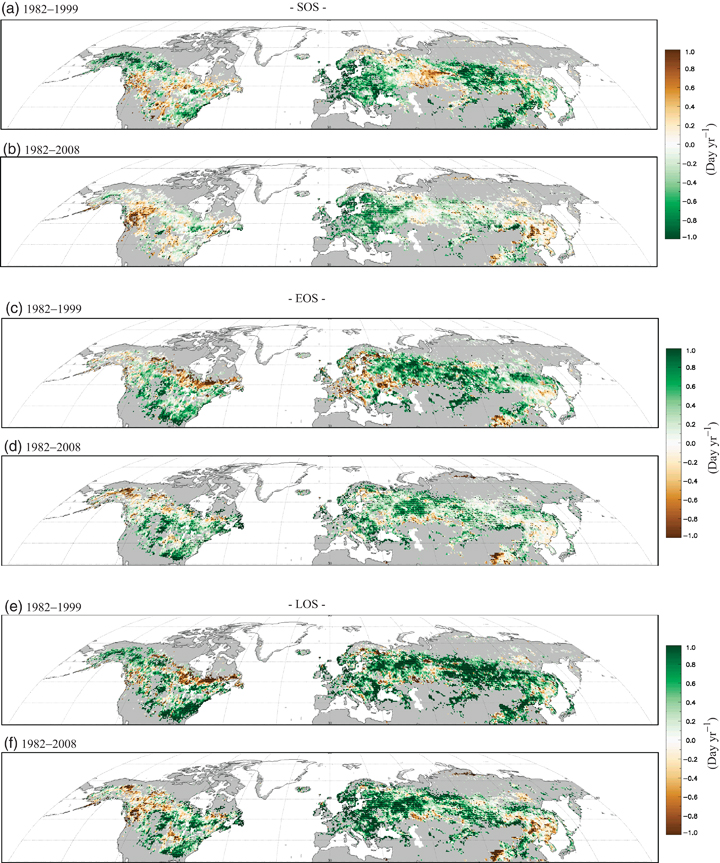
Spatial distributions of the SOS, EOS, and LOS linear trends for 1982–1999 (a, c, e), and 1982–2008 (b, d, f).
Figure 4 also shows the spatial distributions of the EOS linear trends for (c) 1982–1999 and (d) 1982–2008. From 1982 to 1999, most of the Northern Hemisphere experienced positive trends except for northeastern Canada and the central-eastern parts of Europe (Fig. 4c). Because of insufficient understanding of the long-term changes in EOS over many parts of the globe in previous studies (Table 1), the general features were not compared with previous studies. However, the positive trends reported for Europe (e.g., Menzel & Fabian, 1999) and China (e.g., Piao et al., 2006) are consistent with our study. Furthermore, our results indicate a ‘delayed autumn’ during 1982–1999. After 1999, when the data period was expanded to the longer period (1982–2008), the positive signs changed over many parts of the analysis area (Fig. 4d). Specifically, in northeastern Canada and most parts of Europe, statistically significant negative EOS trends for 1982–1999 changed to significant positive trends. Over eastern East Asia, strong positive EOS trends were reduced over the longer period. However, in southwestern Canada, insignificant negative trends turned into statistically significant negative trends over the longer period. In addition, the strong positive EOS trend for the United States kept its magnitude in the last decade. In general, in contrast to the changes in SOS, the overall positive EOS trends for 1982–1999 increased or confirmed their statistical significance, which suggests the amplification of ‘delayed autumn’ in recent decades.
In association with long-term changes in SOS and EOS, changes in LOS were also evaluated (Fig. 4e and f). From 1982 to 1999, because of the advanced SOS and delayed EOS, most of the Northern Hemisphere experienced lengthening of the growing season except for northeastern Canada (Fig. 4e). From 1982 to 1999, a strong increase in the LOS (>0.8 days yr−1) was observed for most of the Eurasian continent and the southeastern parts of United States. Significant negative trends in LOS over northeastern Canada can be attributed to the negative EOS trends in that region, whereas significant EOS trends over the northern part of central Asia led to a strong increase in EOS trends for that region. After 1999, the overall positive LOS trends changed, similar to the changes in SOS and EOS. Changes in LOS over Europe showed more strong positive trends over the longer period. Increasing negative SOS and positive EOS trends led to increasing LOS trends there. However, significant positive trends in LOS over northwestern Canada changed their signs to negative trends. Although most of the Eurasian continent kept their positive trends, some parts of East Asia changed their signs to negative trends. Consequently, the overall positive LOS trends for 1982–1999 remained over the longer period. This can be mainly attributed to the delayed EOS in the recent decades.
Temperature related to changes in growing seasons
To understand the changes in long-term trends of SOS, EOS, and LOS between the two periods 1982–1999 and 1982–2008, we analyzed temperature changes over the same periods. Figure 6 shows the spatial distributions for statistically significant periods of temperature related to SOS variations. As we previously mentioned, the correlation coefficients were calculated by the detrended values of temperature and SOS, EOS, and LOS. The effective temperature was negatively correlated with SOS variations for a range of 1–4 months ahead of the time of SOS (Fig. 5a), with most of the distribution in January–April. Statistically significant correlation coefficients had a range from −0.3 to −0.7. This is consistent with the results of previous studies showing that an increase in accumulated temperature during periods antecedent to phenological events (e.g., flowering, bud-burst, and leafing) lead to advancement in vegetation emergence (Cannell & Smith, 1983; Hunter & Lechowicz, 1992; Richardson et al., 2006; Jeong et al., 2009b).
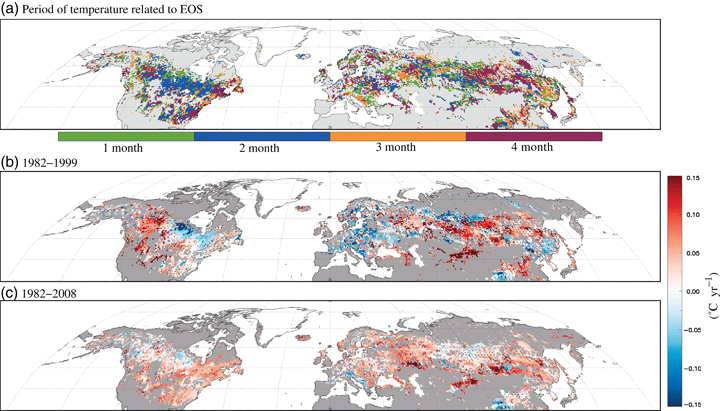
Spatial distributions of (a) statistically significant periods of temperature related to EOS, (b) linear trends of mean temperature related to EOS for 1982–2008, and (c) that for 1998–1999.
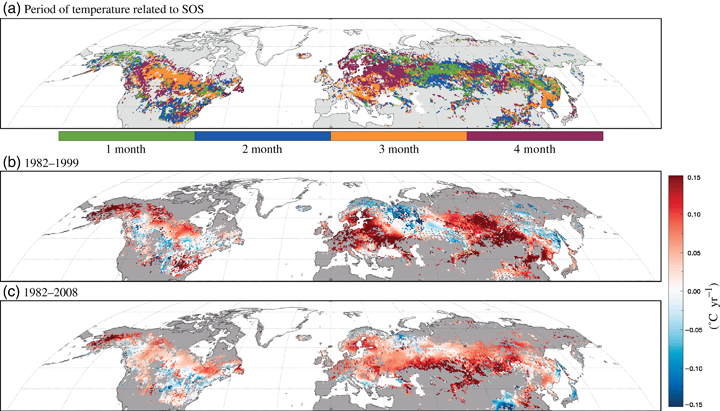
Spatial distributions of (a) statistically significant periods of temperature related to SOS, (b) linear trends of mean temperature related to SOS for 1982–2008, and (c) that for 1998–1999.
Figure 6 also shows the spatial distributions for the linear trends of mean temperature related to SOS for 1982–1999 and 1982–2008. From 1982 to 1999, most of the Northern Hemisphere experienced significant warming (Fig. 6b). The highest level of warming of over 0.2 °C was observed over eastern Europe, Alaska, Russia, Mongolia, and East Asia. The statistical significance of this warming signal exceeded the 95% confidence level over those regions. Although large areas over the Northern Hemisphere showed warming, vast parts of the North America warming trends were insignificant. Overall, the warming resembled negative SOS trends for 1982–1999 in terms of pattern. Large areas of Russia and central Asia showed cooling trends that were statistically significant at the 95% confidence level, and trends in SOS over that region showed positive trends. When the temperature data were extended to 1982–2008, the warming signal changed considerably with time (compare Fig. 6b and c). In general, the overall hemispheric warming signal has been slightly diminished in the past decade. This is consistent with a previous report that documented that the strong warming signal over the last two decades of the twentieth century was reduced after 2000 (Cane, 2010). This paused warming in recent decades was associated with the decreasing magnitude of negative SOS trends over the total analysis period (1982–2008). However, there are some exceptions. The cooling trends in central Asia, East Asia, and northeastern United States for 1982–1999 turned into warming trends in the last decade. Thus, the changes in the signs of the temperature trends have led to disappearing significant positive SOS trends over those regions. Summarizing the above results, during the period 1982–1999, hemispheric warming led to negative SOS trends over those regions, whereas reduced warming after 1999 triggered weakening of the negative SOS trends seen in the antecedent period.
Figure 7 displays the spatial distributions for statistically significant periods of temperature related to EOS variations. In contrast to the negative relation between temperature and SOS, statistically significant positive correlations were found between temperature and EOS (Fig. 7a). The effective temperature was distributed 1–4 months ahead of the time of EOS (Fig. 5a) in mostly June–September. Statistically significant correlation coefficients were in the range of 0.3–0.6. This is due to the fact that temperature increases in an antecedent period lead to the delayed senescence of vegetation growth over temperate regions in the Northern Hemisphere. In autumn, leaf senescence over the temperate forest is mainly modulated by cumulative cold temperatures below a certain threshold temperature (Richardson et al., 2006). Thus, increases in temperature can lead to delays in the time of senescence. This is the opposite of thermal accumulations in spring phenology.
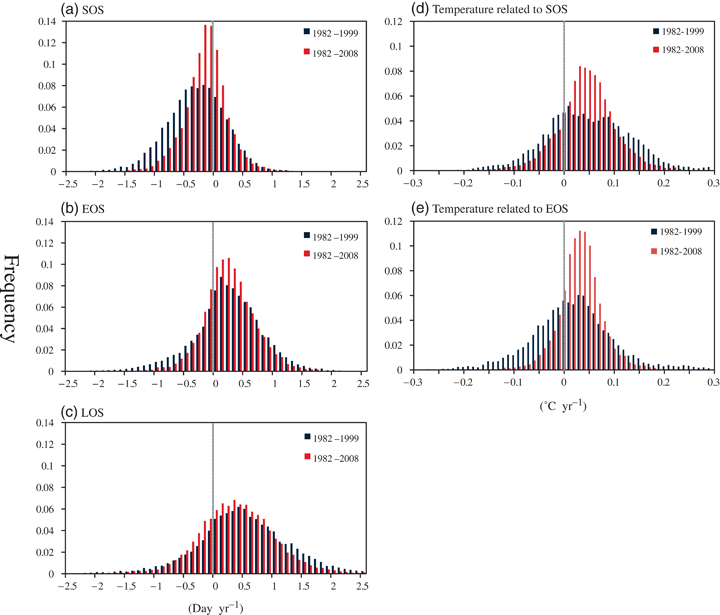
Distributions of the number of trends for SOS, EOS, LOS, temperature related to SOS, and temperature related to EOS per total number of grids in the Northern Hemisphere.
Figure 7 also shows the spatial distributions for the linear trends of mean temperature related to EOS for 1982–1999 and 1982–2008. From 1982 to 1999, most parts of the Northern Hemisphere experienced warming with regional heterogeneity (Fig. 7b). The most statistically significant warming (>0.15 °C yr−1) was observed in northwestern Canada and central Eurasia, which is similar to the strong positive EOS trends (over 1.0 days yr−1) in those regions. Some parts of Europe and northeastern Canada showed cooling trends, which were also associated with negative EOS trends in those regions. After the analysis period was extended to 1982–2008, the warming signal changed in different ways (Fig. 7c). Over the United States, insignificant warming for the antecedent period became statistically significant with increased magnitude. This amplified warming led to increasing positive EOS trends in that region. Further, in Europe, cooling trends during the period 1982–1999 turned into significant warming over the extended period. Changes in the signs of temperature trends were closely related to changes in EOS trends from negative to positive in Europe. In contrast, significant warming in central and eastern Eurasia was reduced, and this lesser warming in the recent decades likely reduced the magnitude of positive EOS trends in those regions.
In this study, only land temperature was analyzed to understand the changes in vegetative growing seasons. However, other factors (e.g., soil moisture, land-cover changes, and sea surface temperature) may contribute to changes in vegetative growing seasons. For example, changes in growing seasons may be the result of changes in soil moisture due to increases in precipitation rather than an increase in temperature. Those soil moisture effects are more prominent in arid regions than in temperate regions (McPherson, 2007). Therefore, acknowledging some minor effects of other factors on growing season variations does not seem to overrule our results.
Discussion
Phenological observations can provide information on diverse biological phases with high temporal resolution and locality. In the northeastern United States, Wolfe et al. (2005) found that spring flowering and leaf-out for a variety cultivated species (apple, grape, and lilac) indicated trends toward earlier flowering by 1–2 days decade−1. Beaubien & Freeland (2000) reported that first-bloom dates extracted from historical datasets for Edmonton, Alberta (Canada) showed progressively earlier development in spring flowering by 8 days decade−1. Analysis of historical data for up to 1000 sites in Europe also suggested that spring has advanced at the rate of 5 days decade−1, whereas in some parts of eastern Europe, it has been delayed by 2 days decade−1 (Menzel & Fabian, 1999; Ahas et al., 2002; Chmielewski & Rötzer, 2002; White et al., 2009). Consequently, regardless of region, phenological studies have provided consistent estimates of earlier springs and lengthening periods of plant growth. Additionally, warmer winter and early spring temperatures related to climate change are considered to be the main factor for earlier springs during the last several decades of the twentieth century (Menzel & Fabian, 1999; Beaubien & Freeland, 2000; Ahas et al., 2002; Chmielewski & Rötzer, 2002; Ho et al., 2006).
In contrast to direct phenological observations cited above, satellite-retrieved NDVI data have the advantage of high spatial coverage, which allows regional, hemispheric, and global studies. Because NDVI data represent a trajectory of vegetation growth, it lets us measure the start, end, and length of vegetation growth. This is one of the great benefits of satellite NDVI data. From Myneni et al. (1997) to Julien & Sobrino (2009), all analyses on changes in growing season unanimously reported the advancement and lengthening of the growing season. Specifically, in Europe, Stockli & Vidale (2004) reported that trends in phenological phases revealed a general shift to earlier (5.4 days decade−1) and prolonged (9.6 days decade−1) during the period 1982–2001. Although the magnitude was slightly different, the earlier and prolonged growing season is consistent with the present study. In the same time period, our study suggests that the start of growing season has been advanced by 3.5 days decade−1 and that the total growing season has been increased by 6.5 days decade−1. The difference between the two studies may be related to the different methods used for finding the phenological dates. Furthermore, analysis of the changes in the growing season in East Asia (Chen et al., 2005; Piao et al., 2006; Jeong et al., 2009a) suggests that canopy green-up has been advanced by 7 days decade−1 and that senescence has been delayed 3.3 days decade−1 for the period 1982–2000. Therefore, the corresponding growing season has been increased by 9.5 days decade−1. The present study also showed changes consistent to those in previous studies for East Asia for the same period (e.g., canopy green-up has been advanced by 5 days decade−1 and senescence has been delayed 3.5 days decade−1). Changes in vegetative growing seasons are regarded as an important dynamic response of terrestrial ecosystems to climate change. Thus, the exact evaluation of the long-term changes in growing season parameters is essential for predicting ecosystem changes in future climates. Many previous reports (Table 1) on the changes in growing seasons have been presented; the results in these studies were obtained by using first-flowering and bud-burst-date data obtained from stations as well as satellite-measured NDVI data. These reports are consistent with the observed lengthening of the growing seasons, which, in turn, is mainly explained by the earlier start of vegetation growth. However, most of those studies only focused on the period before 1999, and the role of EOS in the changes in LOS has not yet been understood in sufficient detail compared with the role of SOS.
In this study, some important results have been obtained by using satellite NDVI datasets obtained over an extended period, i.e., 1982–2008. Although most of the changes in the growing seasons from 1982 to 1999 were generally consistent with previous results, after 1999, the changes in SOS and EOS showed clear asymmetric variations. On a hemispheric scale, the earlier SOS signals from 1982 to 1999 were weakened in the 2000s, whereas the delayed EOS signals were amplified. Figure 7 shows the distributions of the number of trends in each growing season event (e.g., SOS, EOS, and LOS) and its related temperature per the number of total analysis grids. Over the longer period (1982–2008), the frequency of negative SOS trends was clearly reduced, whereas the number of positive temperature associated SOS trends was reduced. Likewise, the frequency of negative EOS trends was diminished for 1982–2008, and the frequency of negative temperature associated SOS trends was reduced. Furthermore, the role of EOS in changes in LOS was found to have increased in the 2000s in comparison with its role in preceding periods. Although the advanced SOS has been reported to be the main factor that causes longer-lasting growing seasons, in this study, the delayed EOS was found to be a more important factor that regulates the LOS changes during the 2000s. This was mainly attributed to the asymmetric seasonal warming patterns between periods during which temperature changes occur due to SOS variations and those during which temperature changes occur due to EOS variations. During the mean period related to SOS variations (January–April), an increase in precipitation in recent decades has resulted in reduced warming. However, in recent decades, greater warming during the mean period in which EOS variations occur (June–September) has led to a greater delay in EOS compared with the delay in the preceding periods; this suggests changes in hemispheric features show that the longer-lasting vegetation growth in recent decades can be attributed to extended leaf senescence.
Figure 8 further shows a summary of the changes in the growing seasons over North America, Europe, and East Asia, the regions in which the most significant changes were observed. At a regional level, significant delayed EOS patterns were clearly seen in North America and Europe. In North America, EOS was delayed by 8.1 days decade−1 from 1982 to 1999; afterwards, it was further delayed by 1.3 days decade−1. Because changes in EOS in North America were negligible, these delays are mainly explained by the longer LOS. In Europe, both SOS and EOS showed shifts to earlier and later dates. In particular, from 1982 to 1999, the earlier SOS was more dominant than delayed EOS, whereas in recent decades, the later EOS (8.2 days decade−1) was more significant than the earlier SOS (3.2 daysdecade−1). Over East Asia, although the longer-lasting growing season signal was the strongest compared with the seasons in other regions for the period 1982–1999, the lengthening of LOS was reduced in recent decades.
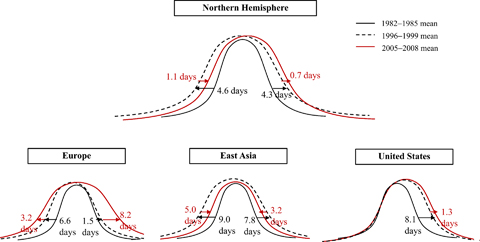
Schematic diagrams of summarized growing season changes over the Northern Hemisphere (≥30°N), Europe (0°–30°E, 40°N–60°N), East Asia (30°E–60°E, 110–130°N), and the United States (90–130°W, 30–50°N).
In this study, while multidecade changes in the growing seasons of temperate vegetation have been identified on the basis of changes in SOS, EOS, and LOS, further analysis must be carried out to confirm the results of this study. Here, we used only satellite-measured NDVI data, which have already been corrected several times (Tucker et al., 2005). However, some biases due to satellite drift, incomplete corrections, aerosol contamination, and human interruption may still remain in the GIMMS NDVI datasets. Thus, intercomparison with other NDVI or satellite-derived leaf area index analyses may confirm the results of the present study. In addition to data, the method for obtaining growing season events is also an important issue. Recently, White et al. (2009) reported that in order to evaluate variations in growing seasons, it is important to compare various methods of calculating changes in growing seasons by using different variables for the calculations (e.g., temperature, soil, and snow). These concerns will be addressed in follow-up studies.
We only used simple relationships between mean temperature and phenological events to examine the changes in growing season related to climate change. This is based on the concept that canopy green-up is mostly attributed to the temperature (i.e., heat accumulation). The thermal time using daily temperature is widely used to predict the spring phenology (Hunter & Lechowicz, 1992; Ho et al., 2006; Richardson et al., 2006; Fisher et al., 2007). However, increased late-chilling can reduce the thermal sum required for spring vegetation growth (Cannell & Smith, 1983; Zhang et al., 2007; Schwartz & Hanes, 2010). Thus, recent decreases in the magnitude of earlier spring trends in the present study may have been influenced by changes in chilling requirement. At present, compared with the analysis for finding mechanisms of the start of growing season, there is not sufficient agreement among researchers on the nature of autumn phenology since the date of leaf dropping has been observed to be quite consistent from year to year (Menzel et al., 2001; Lee et al., 2003). However, considering our results in this study, we should pay more attention to finding the precise mechanisms to the nature of autumn phenology. In addition, although the first-frost day was not considered in the present study, its variations may influence changes in the end of the growing season.
The results of the present study have important implications on long-term changes in the carbon cycle. Recently, Piao et al. (2007) reported that changes in growing season are closely related with the changes in grow primary productivity (GPP) and net primary productivity (NPP). Because the changes in GPP and NPP are a main factor in modulating terrestrial carbon uptake, changes in the growing season can have a critical influence on the variations in atmospheric carbon magnitude or content (Nemani et al., 2002; Piao et al., 2007). Furthermore, although the annual net carbon exchange may not change, changes in the timing of the start and end of growing season can change the atmospheric CO2 amplitude (Lucht et al., 2002; Nemani et al., 2002; Schaffer et al., 2005; Piao et al., 2007). Increased GPP in spring would amplify the drawdown, resulting in a lower minimum CO2. Likewise, increased respiration at other times of the year would amplify the CO2 buildup, resulting in a higher maximum CO2. Thus, by considering the results in the present study, we strongly suggest that the role of long-term changes in growing season in terrestrial carbon cycle should be evaluated. In particular, extended the end time of the growing season in recent decades can change the timing of the CO2 buildup.
Acknowledgements
This research was funded by the Korea Meteorological Administration Research and Development Program under grant CATER 2006–4204.


