Contrasting responses of Peromyscus mice of Yosemite National Park to recent climate change
Abstract
Accurately predicting the response of species to climate change is crucial for the preservation of contemporary species diversity. In the current study, we analyze the response of two congeneric small mammal species (Peromyscus maniculatus and Peromyscus truei) to recent climate change in the region of Yosemite National Park (California, USA). The generalist P. maniculatus did not change its distribution in response to climate change while the specialist P. truei substantially changed its geographic and elevational distribution in the region, expanding into Yosemite. Using molecular genetic techniques we found that a cryptic geographic shift in genetic variation may have occurred within the geographically stable P. maniculatus distribution. Using a combination of morphometric and molecular genetic techniques we confirmed that a P. truei subspecies previously identified as a habitat specialist expanded into new habitat types, suggesting that this subspecies is not in fact a habitat specialist. Instead, we propose that the range of this subspecies is instead limited by climatic variables currently varying in response to contemporary climate change. These results underscore the importance of verifying the natural-history-based assumptions used to develop predictive models of species' response to climate change.
Introduction
As we enter a period of profound changes in species distributions due to anthropogenic climate change (Parmesan & Yohe, 2003), it is crucial to refine our predictive models of how species will respond to climate change. Predictions of distributional shifts in response to climate change are typically based upon environmental niche models that quantify the abiotic and biotic needs of individual species and predict how the species will shift its distribution in response to shifts in these parameters (Pearson & Dawson, 2003; Hijmans & Graham, 2006). To date, generalist species are predicted to be more resistant to distributional shifts resulting from climate change than specialist species because of the vulnerability of specialist species to habitat degradation (Warren et al., 2001; Devictor et al., 2008). To ensure accuracy of these predicted shifts we must ensure that ‘specialist’ species are actually specialized for their current environmental conditions (Kearney, 2006; Schmolke et al., 2010).
Small mammals around Yosemite National Park (California, USA) have undergone recent (within the last century) large-scale shifts in geographic and elevational distribution in response to climate change (Moritz et al., 2008). Yosemite National Park has been a protected landscape since 1890, and thus these distributional shifts are postulated to be a response to an estimated 1 °C average increase in minimum monthly temperature in the region (Rubidge et al., 2011). In particular, the congeneric species Peromyscus maniculatus (deer mouse) and Peromyscus truei (pinyon mouse) displayed differing responses to climate change. The generalist species P. maniculatus did not shift its elevational or geographic distribution. A study of modern P. maniculatus in western North America found a contact zone between cryptic non-Californian and Californian genetic variants extending through Yosemite National Park (Yang & Kenagy, 2009). Recent climate change may have allowed mice with non-Californian genotypes to enter Yosemite despite the overall stability in P. maniculatus geographic distribution.
In contrast to P. maniculatus, the specialist species P. truei greatly shifted both its elevational and geographic distribution in the region and was recently detected within Yosemite National Park itself for the first time (Moritz et al., 2008). Peromyscus truei entered both western low-elevation (500 m) and eastern high-elevation (3000 m) areas of the park. The P. truei expansion into western low-elevation areas did not represent a shift in altitudinal or habitat range and thus here we focus on the expansion of P. truei into high-elevation areas of the park. Moritz et al. (2008) hypothesized that a neighboring Peromyscus truei truei population from the eastern slope of the Sierra Nevada colonized high-elevation areas of the park. The expansion into high-elevation areas represents a substantial shift of 37 km westwards and 1062 m upwards from this neighboring population (Fig. 1). This neighboring population is a subspecies (P.t. truei) that has been previously identified as a specialist for pinyon–juniper woodland (Grinnell & Storer, 1924; Hoffmeister, 1951) and this expansion into subalpine habitat, hypothetically by P.t. truei, would thus indicate that the subspecies is not a habitat specialist.
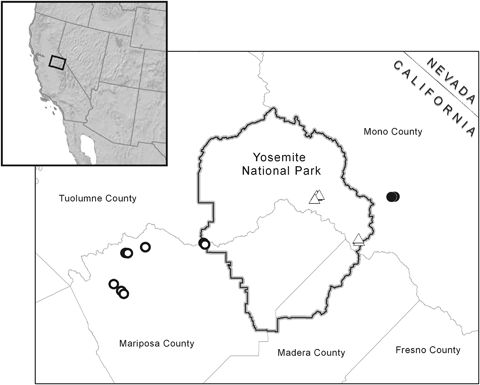
Map of sampling localities where Peromyscus truei specimens were collected. Open circles are Peromyscus truei gilberti sampling localities, closed circles are Peromyscus truei truei sampling localities, and open triangles are sampling localities of the previously undetected high-altitude populations in Yosemite National Park. A map of all sampling localities, including localities where P. truei were not collected, is included in fig. 1 of Moritz et al. (2008).
Here, we use morphometric and genetic study methods to gain further insight into the response of these species to recent climate change beyond changes in geographic and altitudinal distribution. Morphometric and genetic techniques allow us to test the hypothesis that the eastern slope P.t. truei population colonized high-elevation areas of Yosemite. Genetic sampling of both historic and modern Yosemite P. maniculatus populations allow us to detect changes in genetic diversity over time within the population, and determine whether the presence of non-Californian genetic variation in Yosemite is a recent phenomenon perhaps linked to climate change.
Methods
Sampling
Moritz et al. (2008) collected 21 P. truei and 623 P. maniculatus in Yosemite National Park during the years 2003–2005. The collecting localities, sampling protocol, and a discussion on the probability of species detection during historic collection efforts are included in Moritz et al. (2008). P. maniculatus: For genetic comparisons, we analyzed 86 modern specimens from 12 sampling localities in Yosemite and 32 historical specimens collected from 1914 to 1920 from five of the 12 modern sampling localities (supporting information Table S1). Peromyscus truei: we sampled 21 specimens from the high-elevation expansion into Yosemite, 28 P.t. truei specimens from the nearest neighboring population, and 32 Peromyscustruei gilberti specimens from another potential source population in the western Sierra Nevada foothills for genetic analysis. Of these mice we chose a subset of adults consisting of 17 Yosemite specimens, 21 P.t. truei specimens from the nearest-neighboring population, and 35 western Sierra Nevada P.t. gilberti specimens (three of whom were not included in the genetic analysis) for additional morphometric analysis (supporting information Table S2).
MtDNA sequencing
To observe population structure and infer relationships between populations, we sequenced 436 base pairs (bp) of the mitochondrial (mtDNA) control region for the modern P. truei and P. maniculatus samples. For the historical P. maniculatus samples, we sequenced 206 bp nested within the 436 bp sequenced for the modern samples. For all samples, we performed DNA extractions using the Qiagen DNEasy tissue kit and a standard protocol. In the case of the historical specimens, we took care to perform these extractions in an area not used for modern polymerase chain reaction (PCR) work or Peromyscus DNA work. Moreover, we included a negative extraction control alongside each set of skin extractions.
For the modern samples, we used the primers THR (5′-TCAAAGCTTACACCAGTCTTGTAAACC-3′; Kocher et al. 1989) and TDKD (5′-CCTGAAGTAGGAACCAGATG-3′; Kocher et al. 1993). For amplification of historical museum skin samples, we ran PCR reactions in a 25 μL volume with 2.5 μL 10 ×Taq buffer (Perkin-Elmer, Waltham, MA, USA), 2.5 μL 1 mg mL−1 Bovine Serum Albumin (New England Biolabs, Ipswich, MA, USA), 3 μL 25 mm MgCl2, 0.474 μL of a 40 mm dNTP mix, 2.5 μL of each 10 μm primer, 0.625 units of AmpliTaq Gold (Perkin-Elmer), and 11.4 μL of undiluted DNA template (5–40 ng μL−1). For these samples, we used the primers DSY3 (5′-GACATATCTGCGTTATCTTACATACAC-3′) and TDKD. Our thermal cycling conditions for historical skin samples were 94 °C for 10 min; 45 cycles of 94 °C for 1 min, 50 °C for 30 sec, 72 °C for 1 min; and 72 °C for 5 min. Each set of PCR reactions included a negative control to check for contamination.
PCR products were purified using ExoSAP-IT (USB Corporation, Cleveland, OH, USA) according to the manufacturer's protocol. We performed 10 μL sequencing reactions using the Big Dye terminator cycle sequencing ready reaction mix v3.1 (Applied Biosystems). We cleaned up the sequencing products using a standard Sephadex™ G-50 (Sigma, St. Louis, MO, USA) matrix protocol. Samples were then run on an ABI 3730 automated sequencer. We aligned the sequences by eye using sequencher 3.0 (Gene Codes Corp.). The P. truei samples were aligned within their own grouping, while both the modern and historical P. maniculatus samples were aligned together. Sequences were uploaded to GenBank (P. truei accession: HQ847583–847662, P. maniculatus accession: HQ 850291–850322).
Phylogenetic inference
To determine sufficient models of DNA substitution, we applied separate hierarchical likelihood ratio tests for each data set using modeltest 3.7 (Posada & Crandall, 1998) and paup* 4.0 b10 (Swofford, 2003). We then applied these models and values in phyml v2.4.4 (Guindon & Gascuel, 2003) to construct rooted maximum-likelihood trees with 100 bootstrap replicates for the P. truei, modern P. maniculatus, and historic P. maniculatus data sets. The P. maniculatus data sets also included non-Californian sequences from Yang & Kenagy (2009) to detect non-Californian haplotypes by comparison (GenBank accessions GQ860510–GQ860941). We rooted the trees with mtDNA sequences from Peromyscus keeni (Zheng et al., 2003).
Population genetic analyses
To determine whether P. maniculatus population genetic diversity in Yosemite has changed over the past 90 years we created a new comparative data set for this analysis by truncating the sequences of modern specimens down to the 206 bp sequenced for historic samples. Then, we reduced this new data set further by including only samples from the five localities also present in the historic data set. Next, we randomly resampled within each locality of this new modern data set to match the sample sizes for each locality in the historic data set (total n for modern samples =32). We performed this resampling 10 times for a total of 10 resamplings of the modern data set that replicated the number of base pairs and sample size for each locality found in the historic data set. We then calculated the amount of population differentiation between the historic and the comparative modern P. maniculatus data set by calculating Wright's FST (Wright, 1938) using arlequin v3.111 (Excoffier et al., 2005).
Morphometric analyses
We compared the cranial morphology of the recently detected Yosemite National Park population of P. truei to the potential source populations to the east (P.t. truei) and west (P.t. gilberti) of Yosemite. We measured 19 standard cranial variables (condylo-basal length, zygomatic breadth, interorbital constriction width, rostral length, nasal length, rostral width, orbital length, diastema length, molar tooth row length, incisive foramen length, parietal bridge length, alveolar width, occipital condyle width, mastoid breadth, basioccipital length, zygomatic plate width, cranial depth, bullae length, and bullae width) and log-transformed the data to reduce skew. We then performed a direct discriminant function analysis in statistica (StatSoft, Tulsa, OK) comparing the P.t. truei and P.t. gilberti samples and used this discriminant function to assign the morphologies of Yosemite mice to either P.t. truei or P.t. gilberti.
Results
Genetic stability of P. maniculatus
Phylogenetic analysis of the contemporary and historic P. maniculatus specimens revealed that non-Californian mtDNA haplotypes existed in both the historic and contemporary samples of mice from Yosemite (Fig. 2a and b). Similarly, the genetic composition of historic and contemporary populations has remained largely the same, with a mean FST of 0.041 (mean P=0.085) between the historic populations and the contemporary populations derived from resampling the comparative data set. Historic P. maniculatus with non-Californian haplotypes were found at the same elevations as mice with Californian haplotypes (two-tailed t-test: n=32, t=−.2, 2 df, P=0.86). Contemporary P. maniculatus with non-Californian mtDNA haplotypes were found at significantly higher elevations in Yosemite than mice with Californian haplotypes (two-tailed t-test: n=86, t=−2.57, 18 df, P=0.02) (Fig. 3).
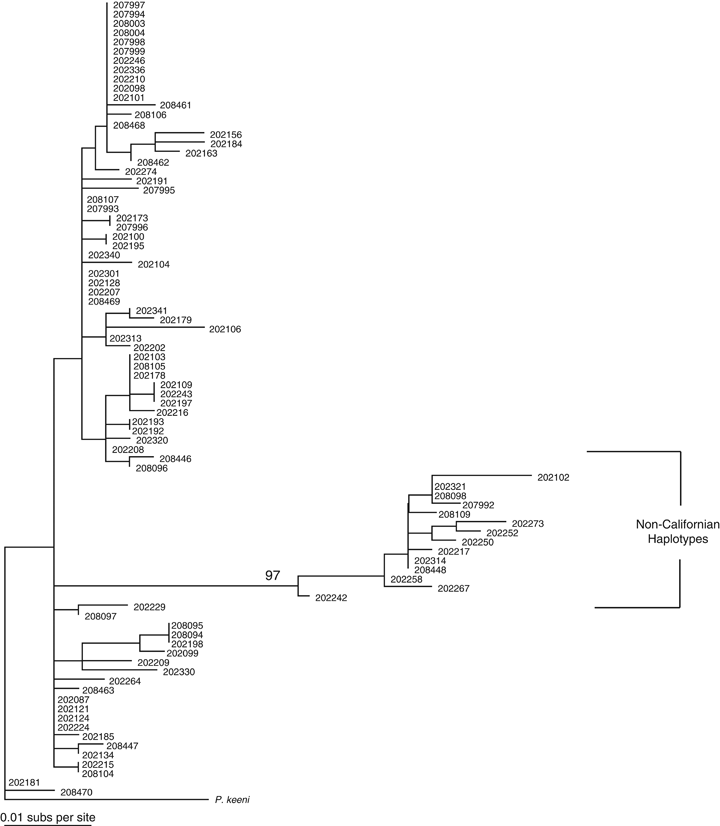
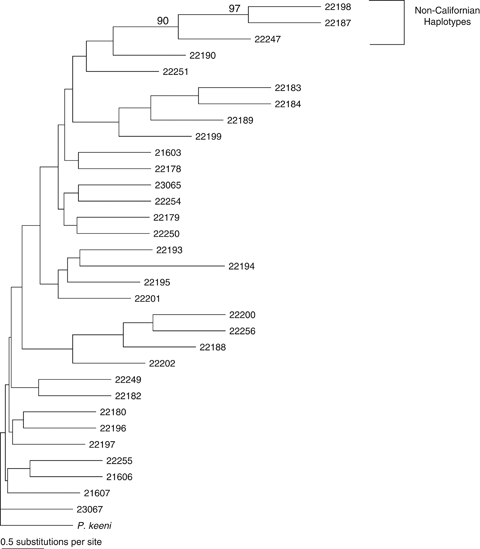
Maximum-likelihood phylogenetic trees of (a) contemporary and (b) historic Yosemite National Park Peromyscus maniculatus mtDNA control region. Branches are labeled with UC-Berkeley Museum of Vertebrate Zoology mammal collection numbers. Nodes with bootstrap support >90% are shown. Clades of non-Californian mtDNA haplotypes are labeled.
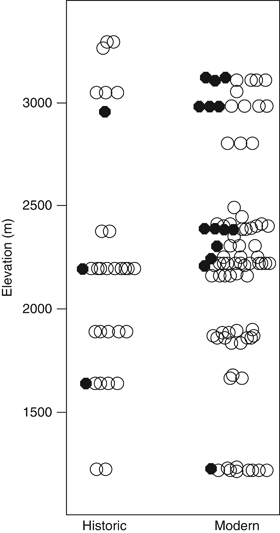
Altitudinal distribution of Peromyscus maniculatus mtDNA haplotypes. Data for both historic (n=32) and modern data sets (n=86) are given. Open circles are individuals with Californian mtDNA haplotypes and filled circles are individuals with non-Californian mtDNA haplotypes. In the modern data set, individuals with non-Californian mtDNA were found at significantly higher elevations than individuals with Californian mtDNA, a trend that did not exist in the historic data set.
Origin of expansion into Yosemite by Peromyscus truei
The sampled P. truei subspecies (P.t. truei and P.t. gilbert) were partially genetically distinct, but were not reciprocally monophyletic (Fig. 4) and the overall tree lacked strong phylogenetic structure (no nodes with >80% bootstrap support). In general, Yosemite P. truei individuals were most closely related to P.t. truei individuals but did not form a monophyletic clade with P.t. truei. For the morphometric data, the discriminant function analysis rejected membership in P.t. gilberti for every Yosemite mouse (P-values: <0.001–0.023, classification information in supporting information Table S2).
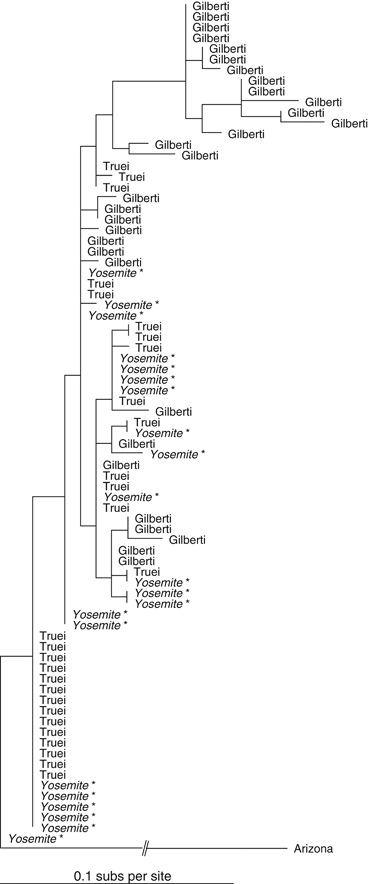
Phylogenetic tree of Yosemite region Peromyscus truei. Branches are labeled with subspecies designations. Samples from Yosemite National Park are italicized and starred. Tree is rooted with mtDNA sequence from an Arizonan population of P. truei (D.-S. Yang, unpublished data).
Discussion
Genetic stability within Yosemite P. maniculatus despite recent climate change
Genetic diversity in Yosemite P. maniculatus has remained unchanged over the past 90 years, despite the documented response to climate change in other small mammal species during this period. The overall historic and contemporary gene pools are statistically indistinguishable from each other. Non-Californian mtDNA haplotypes existed in both the historic and contemporary gene pools indicating that non-Californian mtDNA was not introduced by recent climate change. However, the elevational distribution of mice with non-Californian mtDNA haplotypes within the park has changed over time. Mice with non-Californian haplotypes are now found at higher elevations on average than mice with Californian haplotypes, a pattern that did not exist in the historical gene pool. The emergent association between elevation and haplogroup membership may indicate a climate-change-mediated shift in elevational distribution of haplotypes. This shift would parallel other climate-change-mediated genetic and distributional shifts previously observed in P. maniculatus (Pergams & Lacy, 2008; Myers et al., 2009). This elevational shift in haplogroup frequency could also be a response to direct selection as P. maniculatus mtDNA is under elevation-mediated selection (Gering et al., 2008) or may be linked to elevational variation in the cranial morphologies of Yosemite P. maniculatus (Grieco & Rizk, 2010).
Shifts in the distribution and natural history of Sierra Nevadan P. truei in response to recent climate change
The morphological and genetic analyses supported a colonization of high-elevation areas of Yosemite National Park by the P.t. truei population from the east. This colonization represents a substantial shift in the distribution of the subspecies. The subspecies increased its upper elevational limit by 1032 m upwards and expanded 37 km westwards by colonizing the high-elevation areas of Yosemite over the crest of the Sierra Nevada Mountains. This shift upwards does not represent an increase in the upper elevational limit of P. truei as a species, as P. truei had historically been detected at altitudes of up to 3350 m (Burt, 1934). Other P. truei populations have also recently extended their elevational range elsewhere in the Sierra Nevada (up to 4330 m, Geluso et al., 1997) and the Great Basin (up to 3261 m, Rickart et al., 2008). Thus, the elevational shift in P.t. truei described here may be part of a larger trend of P. truei populations increasing their upper elevational limit. The shift in elevational distribution described here suggests that high elevation habitats were previously inhospitable to P. truei. The presence of P.t. truei individuals in Yosemite indicates that recent climate change may have weakened this barrier to dispersal, allowing the observed shift in geographic and elevational distribution.
The expansion of P.t. truei into high-elevation areas of Yosemite also reveals that P.t. truei are not in fact specialized on pinyon–juniper vegetation. Grinnell & Storer (1924) and Hoffmeister (1951) described P.t. truei in the eastern Sierra Nevada as specialists limited to dry pinyon–juniper woodland habitat. In contrast, the species was present in upper Lyell Canyon (9800–10 300 ft) subalpine communities dominated by lodgepole pine (Pinus contorta) and whitebark pine (Pinus albicaulis), augmented with mountain hemlock (Tsuga mertensiana) and western white pine (Pinus monticola) at the lower elevations. Both pinyon pine (Pinus monophylla) and juniper (Juniperus sp.) were entirely absent. At Glen Aulin and nearby McGee Lake (7900–8200 ft), P. truei were associated with lodgepole pine on open granite slabs. Notably, the Sierra juniper (Juniperus occidentalis ssp. australis) was present. The average 48 in. of annual precipitation (http://cdec.water.ca.gov/) at these high-alpine sites greatly exceeds the 20 in. found in Californian pinyon–juniper woodland (Munz & Keck, 1963).
Our discovery of the presumed habitat specialist P.t. truei, including breeding and juvenile individuals, in non pinyon–juniper woodland habitat in Yosemite makes apparent that the range of this population of P. truei was not limited by interaction with pinyon–juniper woodland. Carraway et al. (1993) also found that the association between pinyon–juniper woodland and eastern Oregon P. truei was not strict. Narrowly, our results show that conservation efforts that rely on a strict correlation between vertebrate taxon distribution and typical Great Basin pinyon–juniper woodland might benefit from a deeper analysis of those correlations (Pavlacky & Anderson, 2009). More broadly, this result underscores the necessity of verifying that associations between the presence of ‘specialist’ species and environmental factors are causative rather than correlative if these environmental factors are to be used to accurately predict the response of species to environmental perturbation (Kearney, 2006; Schmolke et al., 2010).
At first glance, the changes (or lack thereof) in geographic and elevational distribution of P. maniculatus and P. truei in response to recent climate change are in keeping with their previously described disparate generalist and specialist natural histories. However, close examination reveals that while the overall range of generalist species P. maniculatus may not have shifted, the elevational distribution of mtDNA haplotypes within the species may have shifted. Similarly, though the distributional range of the specialist subspecies P. truei shifted greatly as expected, this shift revealed that the specialization of the P.t. truei subspecies on pinyon–juniper woodland is not strict, and thus predictive climate envelope models that incorporate a pinyon–juniper habitat specialization for this subspecies based may be incorrect. It is crucial to accurately predict shifts in response to anthropogenic climate change and here we show that predictions are potentially more difficult for ‘specialist’ species because specialists may not be habitat restricted after all and can potentially expand out of their documented habitat range. Despite the concordance of our results with the predicted contrasting responses of generalist and specialist species, our results highlight the necessity of continuing to test and verify the assumptions of predictive climate envelope models in order to efficiently conserve species diversity.
Acknowledgements
We would like to first thank Leslie Chow (USGS) and Steve Thompson (NPS) for their invaluable assistance and providing us with the opportunity to work in Yosemite in the first place. We would like to thank Hanna Shohfi, Carol Patton, and Alison Bidlack for their trapping effort during summer 2003. We would like to thank Tasha Belfiore, Beth Slikas, Meredith Mahoney, Michelle Koo, and all of the UC-Berkeley Museum of Vertebrate Zoology for their invaluable assistance in the lab and with data analysis. We would like to especially thank Jim Patton for conducting the bulk of the fieldwork and carrying out the morphometric analyses. We would like to thank J. Tewksbury and three anonymous reviewers for helpful comments on the manuscript. ESRI's Conservation Program generously supplied ArcGIS software. The National Park Service, the Museum of Vertebrate Zoology, and the UC-Berkeley Biology Fellows Program graciously provided funding.


