Negative effects of tropospheric ozone on the feed value of rice straw are mitigated by an ozone tolerance QTL
Abstract
High surface ozone concentrations are recognized as an emerging threat to food security in Asia. This study aimed at determining the effects of ozone on the nutritive quality of rice straw, a by-product of rice grain production and a major feed resource for ruminant livestock. Further, the question was addressed whether negative effects of ozone can be mitigated through molecular breeding. Rice plants from three different genotypes were exposed to four different ozone treatments in fumigation chambers from transplanting to maturity. These genotypes were (i) IR64, one of the most wide spread indica varieties in the world, (ii) Nipponbare, a typical japonica variety, and (iii) SL41, an ozone tolerant breeding line that carried chromosomal inserts at the ozone tolerance QTL OzT9 in the genetic background of Nipponbare. The treatments consisted of (i) charcoal filtered air, (ii) simulated ambient ozone concentration, (iii) 2 × ambient ozone concentration, and (iv) 2.5 × ambient ozone concentration. The effects of ozone on the chemical composition of straw were clearly dependent of the ozone level, and were significant even at ambient ozone concentration. Increases in crude ash, lignin and phenolics concentration adversely affected the digestibility as demonstrated in incubation experiments simulating rumen digestion in vitro. Negative ozone effects included reductions in the rate and extent of gas production due to inhibition of microbial fermentation, reduced formation of short chain fatty acids (SCFA), and a decrease in the true organic matter digestibility. The ozone tolerant genotype SL41 was less responsive to ozone than its more susceptible recurrent parent Nipponbare in terms of lignin and phenolics formation, organic matter digestibility and SCFA production. These data demonstrate that the feed quality of rice straw is affected by ozone even at ambient concentration, and that these negative effects are mitigated by the ozone tolerance QTL OzT9.
Introduction
High surface ozone concentrations are considered as an emerging threat to food security in Asia (Butler, 2009). Ozone is an aggressive oxidant that is formed in the troposphere via photochemical reactions of precursor gases such as carbon monoxide, nitrous oxides and volatile organic compounds (The Royal Society, 2008). While the emissions of these gases from anthropogenic sources has steadily declined in Europe and North America in the recent years due to successful environmental policies and technological advances, an increasing trend has been observed in Asia (Monks et al., 2009). Various models predict further increases in surface ozone concentration in many part of Asia during the coming decades due to combined effects of industrial development and global change (The Royal Society, 2008).
Ozone has long been known to compromise the growth and yield of agricultural crops (Fiscus et al., 2005), and the emerging prevalence of high ozone concentrations in Asia has sparked interest in its effects on rice – Asia's major food crop. Various studies reported negative effects of ozone on rice yields (summarized by Ainsworth, 2008), but the extent of yield loss varied widely depending on the ozone treatments, the reference treatment (ambient or charcoal filtered air), and the genotypes used. Recent field experiments conducted under fully open air conditions in China demonstrated yield losses in the range of 0–20% (depending on the genotype) as a result of a 50% increase in ozone concentration relative to ambient air (Pang et al., 2009; Shi et al., 2009).
Ozone exposure causes drastic changes in the rice plant metabolism, as shown in a transcript profiling study, in which around one-third of all rice genes where responsive to ozone (Frei et al., 2010a). It enters the leaves through the stomata and triggers stress response mechanisms such as antioxidant defense (Inada et al., 2008; Frei et al., 2010a), or programmed cell death (Kangasjärvi et al., 2005), and affects the photosynthetic performance (Pang et al., 2009). If such metabolic changes occur over extended periods of time due to chronic exposure to ozone during crop growth, they are very likely to alter the biochemical composition of plants, thus affecting the crop quality. In the rice plant, the straw would presumably be particularly responsive to ozone, because leaves are directly exposed to ozone over extended periods of time. In contrast, the grains are exposed to ozone for a shorter period of time, and are more protected because they are enclosed by a fibrous hull. But what is the significance of straw as a by-product of rice production in Asia?
In some parts of Asia rice straw is burned after harvest, incorporated into the soil, or used as a source of bio-energy (Devendra & Sevilla, 2002; Binod et al., 2010). However, in the mixed smallholder farming systems prevailing in large parts of South and Southeast Asia rice straw constitutes the most important feed resource for ruminant livestock. Devendra & Sevilla (2002) estimated that rice straw was the principal residue feed for over 90% of buffaloes, draught and beef cattle, sheep and goats kept in this part of the world. They reported particularly high utilization rates in Bangladesh and Thailand, where around 80% of all rice straw was used as a livestock feed, making it the single most important feed resource for millions of farmers. The quality of rice straw as a ruminant feed is fairly low, because of its usually high contents in silica, lignin, and phenolics, limiting the voluntary feed intake by animals and the degradability by rumen microbes. Little information is available as to how genotypic differences or the growth environment affect the straw quality, and how these factors could be managed to produce higher quality feed (Van Soest, 2006).
Previous short term laboratory experiments (Frei et al., 2010b) indicated that exposure to ozone during growth (18 days/7 h day−1/120 nL L−1) increased the lignin and phenolics concentration of rice shoots, resulting in a loss of nutritional quality. This study expands upon these earlier experiments by testing the effects of season-long ozone exposure on the quality of mature rice straw. Two major research questions were addressed. Firstly the study examines effects of different levels of ozone on the chemical composition of straw and its implications for the digestibility in an in vitro incubation system. Secondly, the study addresses the question of genotypic differences in the response to ozone, and explores the possibility of alleviating negative ozone effects by molecular breeding.
Materials and methods
Experimental procedures
Plants were grown during the 2009 rice growing season from April to October in the Akagi Testing Center, CRIEPI (Maebashi, Japan). The three rice varieties selected for this study were: (i) IR64, one of the most wide-spread rice varieties in the world (IRRI, 2009), which represents a typical indica variety grown in tropical Asia; (ii) Nipponbare, a typical japonica variety grown in temperate climate, which was previously shown to be moderately sensitive to ozone (Frei et al., 2008); (iii) SL41, a chromosome segment substitution line derived from a cross between Nippobare and the aus-type landrace Kasalath. It contained introgressions from Kasalath at the ozone tolerance QTL OzT9, which was previously shown to reduce the formation of leaf symptoms (Frei et al., 2008, 2010a). Seeds were geminated and grown in a nursery for about 4 weeks and then transplanted to 15 L pots filled with 0.05 m2 volcanic ash soil (four plants per pot). Three weeks after transplanting a compound fertilizer (Kumiai 444-D80, N-P2O5-K2O=14-14-14) was applied at a rate of 200 kg N ha−1. Pots were kept water saturated throughout the growth period.
Pots containing plants were placed inside glasshouse-type fumigation chambers (Fig. 1). The air stream into the chambers was passed through charcoal filters and subsequently supplemented with ozone at the intended treatment levels. Ozone was generated by an electrical discharge ozone generator (Oz-24-UA, Ebara Corp., Tokyo, Japan) using oxygen-enriched dry air as the source gas. Ozone-enriched air was passed through a water scrubber to remove highly reactive by-products such as N2O5 before introducing into a fan box (Fig. 1). Concentrations of ozone at 90 cm above the floor were continuously monitored in each chamber at 3-min intervals using a UV absorption ozone analyzer (ML9810, Monitor Labs, Englewood, CO, USA). The ozone concentrations in the chambers were regulated by mass flow controllers combined with a PID controlling system for maintaining the designated concentrations.
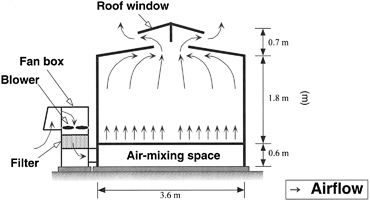
Schematic graph of the ozone fumigation chambers used for the experiment.
Ozone treatments were simulated based on the mean ambient ozone concentration during the rice cropping season (May–September) measured by the Center for Environmental Sciences (CEES) in Saitama (Japan) during the years 2000–2007. The fumigation was initiated just after transplanting of rice plants to the pots, and continued for 15–16 weeks until maturity. Ozone concentrations followed a diurnal pattern that reached a peak at 14.00 hours (Fig. 2). The four ozone levels were (i) CF=charcoal filtered air without ozone added; (ii) 1 ×=ambient ozone concentration; (iii) 2 ×=twice the ambient ozone concentration and (iv) 2.5 ×=2.5 times the ambient ozone concentration. Mean and cumulative ozone exposure values in the different treatments and in the ambient air outside the chambers are summarized in Table 1. In addition, temperature and relative humidity in each chamber and outside the chambers were automatically recorded at 10-min interval throughout the experiment (Table 1).
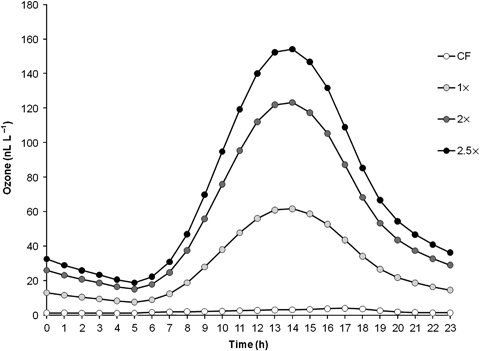
Diurnal ozone exposure pattern in the different treatments.
| Treatment | Temperature (°C) | Relative humidity (%) | Ozone concentration (nL L−1) | Cumulative ozoneexposure* (ppm-h) | ||||||
|---|---|---|---|---|---|---|---|---|---|---|
| 12 h mean | 24 h mean | 12 h mean | 24 h mean | 12 h mean | 24 h mean | Mean daily maximum | IR64 | Nipponbare | SL41 | |
| CF | 21.9 | 19.8 | 71.6 | 77.7 | 4.5 | 5.1 | 9.7 | 18.2 | 19.1 | 18.9 |
| 1 × | 21.9 | 19.8 | 71.8 | 77.9 | 38.7 | 27.9 | 56.9 | 99.2 | 105.2 | 104.5 |
| 2 × | 22.2 | 20.0 | 69.8 | 76.4 | 82.3 | 54.8 | 110.2 | 192.1 | 203.8 | 202.4 |
| 2.5 × | 22.0 | 19.9 | 70.4 | 76.8 | 110.5 | 69.2 | 144.9 | 244.4 | 258.8 | 257.1 |
| Ambient# | 21.3 | 19.1 | 71.1 | 77.7 | 38.9 | 34.8 | 53.7 | – | – | – |
- Measurements of environmental conditions and ozone concentrations were recorded at 3 and 10-minute interval throughout the experiment, respectively. Average values of the two replicate chambers per treatment are shown. 12 h means were calculated for the period from 6:00 to 17:59 hours.
- * 24 h cumulative ozone exposure (AOT00) from transplanting to final harvest, # refers to ambient values measured outside the chambers.
Analyses
After maturing (October 2009) plants were cut at soil level and the harvested grains and straw were dried in a forced air oven at 45 °C for 3–5 days. Subsequently they were weighed and the straw (stems and leaves) was finely ground to pass a 1 mm mesh. Dry matter (DM) and crude ash (CA) content were determined according to AOAC (1990). Nitrogen concentration was determined using a Vario max CN-Analyzer (Elementar Analysesysteme GmbH, Hanau, Germany) and converted to crude protein (CP) concentration by multiplying with the factor 6.25. Structural fiber fractions were determined by sequential detergent treatment (van Soest et al., 1991). Samples were first boiled in acid detergent solution for 1 h and then dried and weighed to obtain the acid detergent fiber (ADF) fraction inclusive of residual ash. Subsequently they were digested in sulfuric acid for 3 h to determine the lignin(sa) fraction as defined by Udén et al., (2005). Lignin(sa) values are hereafter referred to as ‘lignin’. The concentration of nonstructural phenolics was determined by the Folin–Ciocalteu method using 70% acetone for extraction and the results expressed as gallic acid equivalent (Makkar et al., 1993). All analyses were carried out in duplicate and repeated if the deviation of the replicates from the mean was >5%.
 (1)
(1) (2)
(2) (3)
(3)The concentration of short chain fatty acids (SCFA, acetic acid, propionic acid, and butyric acid) in the medium recovered after 24 h of incubation was determined by gas chromatography (Hoeltershinken et al., 1997). The instrument (GC14A, Shimadzu, Kyoto, Japan) was equipped with a stainless steel column (3 mm diameter, 1800 mm length) packed with GP10%SP™-1000/1%H3PO4 on 100/120 Chromosorb WAW (Supelco Inc., Bellefonte, PA, USA). The carrier gas was a mix of nitrogen (1.2 kg/cm2), hydrogen (0.5 kg/cm2), and air (0.5 kg/cm2), and the injection volume was 1 μL. The initial oven temperature of 130 °C was gradually raised to 165 °C at a rate of 2 °C/min, subsequently raised further to 180 °C at a rate of 40 °C/min and held for 1 min. The temperature was then decreased back to 130 °C at a rate of 40 °C/min and held for 30 s before injection of the next sample. Concentrations were quantified using an external standard mixture and corrected with an internal standard (methylvaleric acid).
Statistics
Each ozone treatment was replicated twice in randomly assigned independent fumigation chambers. Within each chamber the pots containing plants were arranged in five randomized complete blocks, each of which contained one pot per genotype. Data were analyzed by employing a mixed model (Piepho et al., 2003) using sas 9.2, with treatment, genotype and genotype × treatment interaction as fixed effects and chamber and chamber × block interaction as random effects. This model treated the pseudo-replicates of genotypes within the same chamber as sampling units but not as independent replicates. Principal component analysis was conducted using spss 17.0, and factor loadings of the principal components 1 and 2 were displayed graphically.
Results
The yield response of rice plants to ozone exposure was only moderate in this experiment (Table 2). Among the three rice varieties tested, only IR64 showed a significant reduction in total biomass, grain yield, and straw yield in the 2.5 × treatment compared with the CF control. No significant reductions in biomass were noted in the other two genotypes Nipponbare and SL41 in any of the ozone treatments. A significant treatment by genotype interaction was seen in the straw yield but not in the other yield components, presumably because the reduction in straw yield was particularly pronounced in IR64 in 2.5 × , while it remained nearly constant in the other two genotypes. Consistent with the expected QTL effect, SL41 showed less visible symptoms of oxidative damage than its parent Nipponbare (Fig. 3).
| Total biomass (g plant−1) | Rough rice (g plant−1) | Straw (g plant−1) | |||||||
|---|---|---|---|---|---|---|---|---|---|
| anova | |||||||||
| Treatment | P<0.001 | P<0.001 | P<0.001 | ||||||
| Genotype | P<0.001 | P<0.001 | P<0.001 | ||||||
| Interaction | ns | ns | P<0.01 | ||||||
| LS means (standard error) | |||||||||
| IR64 | Nipponbare | SL41 | IR64 | Nipponbare | SL41 | IR64 | Nipponbare | SL41 | |
| CF | 55 (2) | 38 (2) | 40 (2) | 14 (1) | 10 (0) | 10 (1) | 37 (1) | 25 (1) | 28 (1) |
| 1 × | 54 (2) | 38 (2) | 44 (2) | 15 (1) | 11 (0) | 11 (1) | 36 (1) | 25 (1) | 31 (1) |
| 2 × | 55 (2) | 39 (2) | 44 (2) | 15 (1) | 11 (0) | 11 (1) | 37 (1) | 26 (1) | 31 (1) |
| 2.5 × | 44 (2) | 37 (2) | 39 (2) | 12 (0) | 10 (0) | 10 (1) | 29 (1) | 25 (1) | 27 (1) |
- anova results are based on mixed model analysis in sas 9.2. Straw data do not include straw material from the panicle.
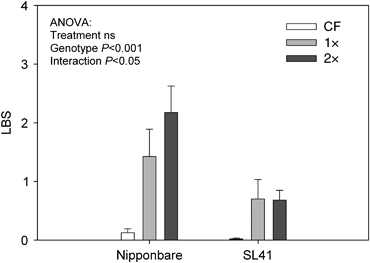
Leaf bronzing scores (LBS) of two contrasting rice genotypes exposed to ozone. LBS were determined on the four youngest fully expanded leaves of each plant after 29 days of ozone exposure, according to the scale used by Wissuwa et al. (2006) ranging from 0 (no symptoms) to 10 (deal leaf). Data bars indicate mean values±standard errors (n=10). Plants in the 2.5 × treatment were not scored.
The lack of an appreciable yield response was in strong contrast to the biochemical composition of rice straw, which was affected at all ozone levels (Fig. 4): CP, nonstructural phenolics, CA and lignin all increased with increasing ozone level. The genotypes showed contrasting response to ozone. Phenolics increased significantly only at 2.5 × in IR64, but Nipponbare showed a significant increase even at 1 × , which was not the case in the more tolerant SL41. CA increased significantly at 1 × in IR64 but only at 2.5 × in Nipponbare and SL41. Lignin content increased significantly at 1 × in IR64, and at 2 × in Nipponbare, but only at 2.5 × in SL41.

Effect of ozone level on straw components determining the feed quality. Data bars indicate mean values±standard errors (n=10). Whole model anova results are based on mixed model analysis in SAS 9.2 (treatment n=2). Asterisks above the data bars indicate a significant difference (P<0.05) of the respective ozone treatment from the CF control by pair-wise comparison.
These changes in the chemical composition of straw led to a decrease in gas production that was correlated with the ozone level during growth (Fig. 5). Both the extent (V) and the rate (c) of gas production tended to decrease with increasing ozone level (P<0.05 and nonsignificant, respectively). Some genotypic differences were seen: IR64 (Fig. 5a) exhibited constitutively lower gas production than the other two genotypes (P<0.001), and showed a significant decrease in gas production even at 1 × (P<0.05). Comparing SL41 (Fig. 5c) and its recurrent parent Nipponbare (Fig. 5b), only minor genotypic differences were seen in the extent of gas production (V). SL41 had constitutively higher V, but both genotypes decreased to a similar extent in the ozone treatments. A slight genotypic differences (however nonsignificant) was seen in the rate of gas production (c), which decreased in Nipponbare with increasing ozone level, while it was constant in SL41 up to 2 × and decreased only at 2.5 × . The digestibility of organic matter (dO) as calculated from 24 h gas production confirmed the results obtained from the 96 h incubation (Fig. 6a).

Effect of ozone level on in vitro gas production determined by 96 h incubation in buffered rumen fluid. (a) IR64, (b) Nipponbare, (c) SL41. Gas production was measured in duplicate in 10 replicates per treatment/genotype combination and values were fit to the model y=V(1−e−ct) to estimate the parameters V and c. Modeled gas production curves are displayed.
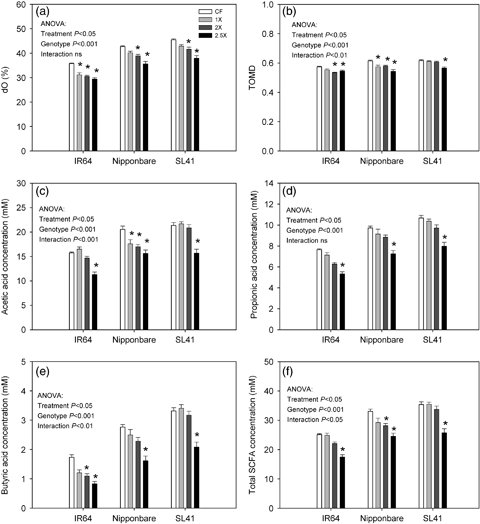
Effect of ozone level on in vitro digestibility parameters determined by 24 h incubation in buffered rumen fluid. (a) dO, organic matter digestibility calculated from gas production, was determined using 200 mg of sample material. All other parameters (b–f) were determined using 500 mg of sample material. TOMD, true organic matter digestibility, SCFA, short chain fatty acid concentration in the medium. Data bars indicate mean values±standard errors (n=10). Whole model anova results are based on mixed model analysis in SAS 9.2 (treatment n=2). Asterisks above the data bars indicate a significant difference (P<0.05) of the respective ozone treatment from the CF control by pair-wise comparison.
A further incubation experiment was carried out using a larger sample volume (500 mg) in order to determine the true digestibility of organic matter (TOMD, Fig. 6b) and the formation of SCFA in the incubation medium (Fig. 6c–f). TOMD showed a similar trend as the digestibility parameters estimated from gas production, but genotypic differences were more clearly resolved in this experiment. While Nipponbare showed significantly decreased TOMD even at 1 × , SL41 showed no effect at 1 × and 2 × and decreased only at 2.5 × . A similar genotypic difference was seen in acetic acid and total SCFA production (Fig. 6c and f). Propionic and butyric acid production were also affected by the ozone treatment, but did not show appreciable differences between genotypes.
Principal component analysis was conducted to detect correlations between chemical composition and digestibility parameters (Fig. 7). In all genotypes, two negatively correlated clusters of variables were seen, i.e. the chemical composition (lignin, CA, ADF, phenolics, and CP) and the digestibility parameters (V, c, dO, TOMD, SCFA). Lignin and CA appeared to be the dominant factors limiting digestibility, followed by ADF (which contains the lignin fraction). Phenolics showed inverse relation with digestibility for the individual genotypes (Fig. 7a–c), but seemed to be uncorrelated with all other variables when all genotypes were aggregated (Fig. 7d).
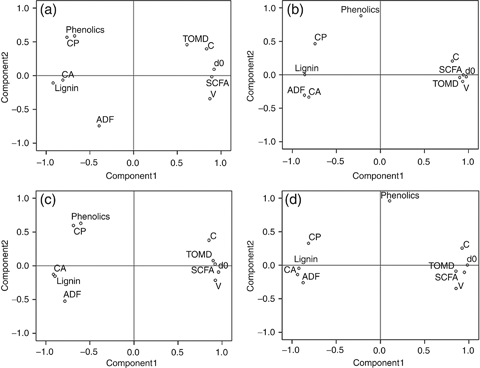
Principal component analysis of straw chemical composition and digestibility parameters. Factor loadings of the principal components 1 and 2 are displayed. (a) IR64 (n=40), (b) Nipponbare (n=40), (c) SL41 (n=40), (d) all genotypes (n=120). CA, crude ash, CP, crude protein, ADF, acid detergent fiber, TOMD, true organic matter digestibility, c, rate of gas production, V, extent of gas production, dO, digestibility of organic matter calculated from gas production, SCFA, short chain fatty acids. The percentages of variance explained by components 1 and 2 were, respectively: IR64 62% and17%; Nipponbare 69% and 13%; SL41 73% and 13%; all genotypes 73% and 13%.
Discussion
Experiments on the effects of ozone on crop performance have employed different fumigation methods, including open top chambers, indoor growth chambers, greenhouses, or fully open air concentration enrichment (Ainsworth, 2008; Feng et al., 2008), and the results may be influenced by the fumigation method. In this study, fumigation chambers were used that had an open roof-top to prevent the inflow of air (Fig. 1). This method was very effective in maintaining close to zero ozone concentrations in the CF control, and in maintaining the designated ozone levels in the other treatments (Table 1). However, two limitations need to be considered (i) the microclimate inside the chambers was slightly different from the ambient climate (Table 1), and (ii) the ozone flow inside the chambers was from the bottom to the top, which is contrary to natural ozone flow. These factors may affect the ozone uptake by plants and need to be considered when comparing the results to those from other studies. However, they do not compromise the comparison of ozone levels and genotypes within this experiment.
By far the most extensively discussed effect of tropospheric ozone on agricultural crops is that of a reduction in yields. Negative yield effects have been demonstrated for many crop species and rice had long been considered as moderately sensitive to ozone. Recent data from field experiments in China reported substantial yield losses up to 20% due to an increase in ozone concentration by 50% (Pang et al., 2009; Shi et al., 2009), but some genotypes did not show any yield response at all. A similar range was observed in this experiment, although yield losses were generally quite moderate. In fact they occurred only on the highest ozone level (2.5 ×), where one genotype, IR 64, showed significant reductions in the total biomass yield (around 20%), the grain yield (around 14%), and the straw yield (around 22%). Surprisingly, no effect was seen in Nipponbare, a variety that showed moderate but clearly visibly symptoms of oxidative stress in previous experiments (Frei et al., 2008, 2010a; Sawada & Kohno, 2009), and in this study (Fig. 3). The lack of a yield response in this variety seems to confirm the view that leaf symptoms and rice grain yield are not necessarily correlated (Frei et al., 2008; Sawada & Kohno, 2009).
Compared with yields, a completely different response pattern was seen in the straw quality parameters, which were affected at all ozone levels (4-6). It is possible that the decline in nutritive quality was partly caused by changes in the leaf/stem ratio. In rice – unlike with other cereals straws – the stem tends to have a higher nutritive value for ruminants than the leaves (van Soest, 2006). However, such morphological parameters were not measured in this study, and we limit our discussion to changes in chemical components, which may partly be caused by shifts in the leaf/stem ratio. Chemical analyses of the straw showed that ozone exposure influenced four components determining the feed value: CP, CA, phenolics, and lignin.
Increases in CP due to ozone exposure were observed previously in forage crops such as clover (Sanz et al., 2005). The authors explained these increases with a ‘concentration effect’ due to ozone, because less biomass was produced with the same amount of available nitrogen. However, this explanation is only partly applicable to this study, because increases in CP were seen at all ozone levels, and in all genotypes, even if no reduction in biomass occurred. An alternative explanation could be the induction and accumulation of stress defense proteins in the plant tissue due to exposure to ozone stress (Cho et al., 2008). From a nutritional point of view, this trend would be positive, because a sufficient level of CP is essential in ruminant diets to maintain an intact microbial population in the rumen. Moreover, as rumen microbes can utilize any source of nitrogen for the synthesis of high-quality microbial protein, the qualitative composition of the CP fraction is not essential (Mould, 2003). However, principal component analysis (Fig. 7) showed that CP content was strongly negatively correlated with digestibility, suggesting that increases in CP due to ozone did not have any positive effects on the straw degradation. In conclusion, the digestibility was not limited by CP content but by other factors.
Among these factors was probably CA, which showed strongly negative correlation with the digestibility parameters (Fig. 7). The CA fraction of rice straw largely consists of silica, which, apart from being indigestible itself, negatively impacts the fiber digestibility through incrustation (van Soest, 2006). In the rice plant, silica is involved in many physiological processes including phenolics synthesis and cell wall protection, and its transport is actively regulated (van Soest, 2006). It is thus very likely that accumulation of silica constitutes a stress response mechanism under ozone exposure.
An even more obvious stress response mechanism was the accumulation of lignin and phenolics in rice straw (Fig. 4b, d). Lignin is a structural cell wall fraction essentially consisting of aromatic polymers of monolignols that cannot be degraded by rumen microbes (Boerjan et al., 2003; Sarnklong et al., 2010). Apart from being indigestible itself, lignin associates with other cell wall fractions such as hemicelluloses and thus inhibits their microbial degradation (Van Soest, 2006). Similarly, nonstructural phenolics can perturb the enzymatic degradation of feeds by inhibiting rumen microbial enzymes, thus negatively affecting the feed digestibility (Makkar, 2005). In the current study, however, lignin was more influential on straw digestibility than phenolics (Fig. 7). Both lignins and nonstructural phenolics originate from the central phenylpropanoid metabolism of plants (Boerjan et al., 2003; Vogt, 2010). That the phenylpropanoid metabolism of rice is stimulated by ozone was clearly reflected in gene expression data obtained from a previous transcript profiling study (Frei et al., 2010a; see supporting information). The majority of the genes involved in phenypropanoid biosynthesis were upregulated, and some showed drastic response to ozone with up to 107-fold upregulation. This is an expected response to ozone, as many phenylpropanoids have been characterized as essential in the stress defense of plants due to their antioxidant or structural properties (Vogt, 2010).
The ozone-induced changes in the chemical composition of straw led to significant reductions of the straw degradability in the incubation experiments. In vitro methods for estimation of the feed value either measure the generation of fermentation products such as gas and SCFA, or they measure substrate disappearance. Both approaches were taken in this study. Gas production techniques take advantage of the close association between rumen fermentation of carbohydrates and the amount of gas (mostly CO2 and CH4) released. A close association between gas production during 96 h incubation in BRF and in vivo feed digestibility is well established (Menke et al., 1979; Getachew et al., 1998). The reductions in gas production demonstrated in this study (Fig. 5) would thus lead to reduced feed intake by cattle, slower passage rate of feed through the rumen, lower metabolizable energy content, and ultimately a decrease in cattle performance. That ozone treated straw was indeed associated with reduced available energy was reflected in the reduced amounts of SCFA (a source of energy for the animal) formed (Fig. 6). While gas production reflects the formation of SCFA during rumen fermentation, TOMD (a measure of substrate disappearance) is more closely associated with the formation of microbial biomass in the rumen, which constitutes the most important source of protein for the animal (Blümmel et al., 1997). It was clearly shown (Fig. 6) that TOMD showed a similar trend as the digestibility parameters estimated from gas production, i.e. a decrease with increasing ozone level.
These drastic effects of ozone on the straw digestibility raise the question whether the problem can be addressed through the breeding of resistant varieties. The molecular breeding of rice varieties tolerant to a broad range of environmental stresses has experienced substantial progress in the recent years (Ismail et al., 2007; Wassmann et al., 2009), but the focus of most breeding programs was on yield stability and not on crop quality. As for ozone, quantitative trait loci (QTL) were reported that conferred tolerance in terms of visible symptoms (OzT9) and dry weight (OzT8) formed under ozone stress (Frei et al., 2008). The genotype SL41 contains introgressions from the QTL donor variety (Kasalalth) in the genetic background of its recurrent parent Nipponbare. Consistent with the expected QTL effect it showed less visible symptoms than Nipponbare (Fig. 3), and this lack of stress symptoms was associated with reduced formation of phenylpropanoids (lignin and phenolics, Fig. 4). Moreover, SL41 showed a less significant decrease in nutritive value, as reflected in the particularly informative quality parameters TOMD and SCFA production (Fig. 6). Assuming that visible symptoms are indicative of oxidative stress (Kangasjärvi et al., 2005), this suggests an association between oxidative stress avoidance and the maintenance of a higher feed value under ozone stress. The mechanisms of oxidative stress avoidance in SL41 are not fully understood. However, previous gene expression and biochemical analyses suggested that SL41 was able to maintain a high level of reduced ascorbic acid when exposed to ozone, probably due to suppressed expression of an ascorbate oxidase gene that colocalized within the QTL OzT9 (Frei et al., 2010a). The current study suggests that this mechanism of oxidative stress avoidance holds great potential in preserving the feed quality of rice straw in agricultural areas affected by high ozone concentrations.
Conclusions
The effects of ozone on crop quality might be much more significant than previously thought. This study showed that negative effects on the feed value of rice straw occurred even at ozone concentrations that did not affect quantitative yields at all. Considering the present and predicted future ozone concentrations in Asia, millions of farmers are affected by this problem. Since individual farmers have no option to control the ozone levels which their crops are exposed to, the development of resistant cultivars provides the only feasible agronomic measure to face this challenge. That such an approach is possible was clearly shown in this study, and the availability of a tolerance QTL offers the possibility of molecular breeding. However, at very high ozone concentration (2.5 ×), even the resistant cultivar SL41 was equally affected as the more susceptible cultivar Nipponbare. Therefore, breeding programs need to be accompanied by efforts to mitigate the emissions of ozone precursor gases through the implementation of tighter environmental policies.
Acknowledgements
The authors wish to thank Beatrix Fischer, Herrmann Baumgärtner, Saskia Pfeffer and Sonja Hauber for excellent technical support. Advice on statistical analyses by Prof. Dr. H.P. Piepho (University of Hohenheim, Germany) is gratefully acknowledged. This research was financially supported by the Environment Research and Technology Development Fund (A-0806) of the Ministry of the Environment, Japan, and the Alexander von Humboldt Foundation (M. F.).


