Stimulation of both photosynthesis and respiration in response to warmer and drier conditions in a boreal peatland ecosystem
Abstract
Peatland ecosystems have been consistent carbon (C) sinks for millennia, but it has been predicted that exposure to warmer temperatures and drier conditions associated with climate change will shift the balance between ecosystem photosynthesis and respiration providing a positive feedback to atmospheric CO2 concentration. Our main objective was to determine the sensitivity of ecosystem photosynthesis, respiration and net ecosystem production (NEP) measured by eddy covariance, to variation in temperature and water table depth associated with interannual shifts in weather during 2004–2009. Our study was conducted in a moderately rich treed fen, the most abundant peatland type in western Canada, in a region (northern Alberta) where peatland ecosystems are a significant landscape component. During the study, the average growing season (May–October) water depth declined approximately 38 cm, and temperature [expressed as cumulative growing degree days (GDD, March–October)] varied approximately 370 GDD. Contrary to previous predictions, both ecosystem photosynthesis and respiration showed similar increases in response to warmer and drier conditions. The ecosystem remained a strong net sink for CO2 with an average NEP (± SD) of 189 ± 47 g C m−2 yr−1. The current net CO2 uptake rates were much higher than C accumulation in peat determined from analyses of the relationship between peat age and cumulative C stock. The balance between C addition to, and total loss from, the top 0–30 cm depth (peat age range 0–70 years) of shallow peat cores averaged 43 ± 12 g C m−2 yr−1. The apparent long-term average rate of net C accumulation in basal peat samples was 19–24 g C m−2 yr−1. The difference between current rates of net C uptake and historical rates of peat accumulation is likely a result of vegetation succession and recent increases in tree establishment and productivity.
Introduction
The magnitude of the feedback between increasing temperatures and subsequent release of carbon dioxide (CO2) and other greenhouse gases from ecosystems represents one of the most important unknowns in the science of global change (Weaver, 2008; Huntingford et al., 2009). Recent analyses of historical temperature and atmospheric CO2 concentrations during the period 1050–1800 ad have suggested that the magnitude of this positive feedback has a median value of 7.7 ppm CO2 °C−1 change in air temperature with a probable range of values between 1.7 and 21.4 ppm CO2 °C−1 (Frank et al., 2010). This represents a significantly lower sensitivity of the carbon (C) cycle to climate changes than other recent estimates (40 ppm CO2 °C−1; Cox & Jones, 2008), or the large range of temperature-induced net release of CO2 (20–200 ppm during the time period 2000–2100 ad) shown in a comparison of several coupled carbon–climate models (Friedlingstein et al., 2006). However, Frank et al. (2010) have cautioned that their analyses, because they were based on preindustrial CO2 concentrations and temperatures, do not account for several additional contributing factors that could alter the apparent sensitivity of the C cycle to warmer temperatures including; threshold responses to future temperature increases, shifts in ocean circulation, CO2 fertilization effects on ecosystems, and the uptake and release of CO2 in peatlands – the latter being the focus of this study.
Northern peatland ecosystems are consistent net C sinks that account for between one-quarter to one-third of the global soil C pool (Gorham, 1991; Turunen et al., 2002). The net C sequestration results from moderate rates of ecosystem photosynthesis that exceed decomposition and autotrophic plant respiration (Gorham, 1991). The cool temperatures and waterlogged, anaerobic conditions that typically occur in peatland ecosystems normally limit the rate of decomposition (Davidson & Janssens, 2006). Exposure to warmer temperatures and drier conditions that lower the water table in peatlands could shift the balance between ecosystem photosynthesis and respiration/decomposition providing a positive feedback and further increases in atmospheric CO2 concentration (Moore et al., 1998; Davidson & Janssens, 2006; Tarnocai, 2006). In particular, model calculations have suggested that, because of the positive relationship between increasing peat soil C accumulation and water table height (paludification), peatlands have an enhanced sensitivity of soil decomposition to temperature that increases the potential loss of C from these ecosystems during warm, dry periods that result in lower water tables (Shaver et al., 1992; Updegraff et al., 2001; Ise et al., 2008). Recent experimental evidence has confirmed that heterotrophic respiration was increased in response to experimental warming in a sub-Arctic peatland (Dorrepaal et al., 2009). In addition, repeated soil inventories in England and Wales over the last 25 years have shown that peat soils and bogs lost C at a faster rate than upland soils (Bellamy et al., 2005).
The magnitude of the positive feedback caused by stimulation of heterotrophic respiration/decomposition also depends on the response of ecosystem photosynthesis to climate changes. In cold, arctic and boreal environments warmer temperatures can stimulate both photosynthesis and heterotrophic soil respiration. In addition, lower water tables can increase soil temperature, enhance oxygen supply to roots and improve nutrient availability, all factors that will stimulate higher photosynthesis and plant growth (Shaver et al., 1992; Larcher, 1995). Which process (photosynthesis or heterotrophic respiration) increases more due to warmer and drier conditions depends on C–nutrient interaction, as the sequestration of C in new plant biomass usually requires increases in nutrient mineralization since primary production in northern ecosystems is normally nutrient limited (Shaver et al., 1992). However, in fen ecosystems stimulation of plant nutrient uptake and biomass production can occur with warmer temperatures even if there is no associated change to mineralization of soil organic matter, because there is a significant source of nutrients in the water flowing through the ecosystem (Shaver et al., 1992; Vitt et al., 1995). The presence of woody plants also has a significant influence on the relative responses of ecosystem photosynthesis and heterotrophic soil respiration to climate changes, because woody tissues typically have C : N ratios much higher (approximately 200 : 1) than herbaceous plant tissue (100 : 1) and soil organic matter (50 : 1) (Shaver et al., 1992). Therefore, ecosystem C storage should be higher as woody plant tissue production increases. Whether a peatland ecosystem has an abundance of woody plants, or is susceptible to woody plant invasion, may determine the potential for increases in photosynthesis and plant production that could offset some of the CO2 losses caused by higher soil respiration rates and the warmer and drier conditions associated with climate change (Bubier et al., 2003; Sulman et al., 2009).
The main objective of this study was to determine the sensitivity of ecosystem photosynthesis, respiration and net CO2 exchange to variations in temperature and water table depth associated with interannual shifts in weather over a 6-year period. Ecosystem CO2 exchange rates were measured using the eddy covariance technique. Our study was conducted in a type of fen (moderately rich treed fen) that represents the most abundant peatland type in western Canada, in a region where peatland ecosystems are a significant landscape component (approximately 20%; National Wetlands Working Group, 1988; Vitt et al., 1998; Tarnocai, 2006). During the 6-year study period, the average growing season (May–October) water depth declined approximately 38 cm, and temperature [expressed as cumulative growing degree days (GDD), March–October] varied approximately 370 GDD, so we suggest that our study of ecosystem response to interannual environmental variation has relevance to consideration of the potential response of this important ecosystem type to future climate change. Additional objectives were: (i) to determine the historical patterns of establishment and growth rate of the two tree species present; (ii) to measure the recent (over last 70 years) and long-term (over last 2000 years) average rates of C accumulation in peat cores; and (iii) to characterize the nutrient availability in the peat organic matter. These latter objectives and measurements helped to provide perspective for interpreting the observed CO2 exchange responses to environmental variation, and independent data for comparison to the net C sequestration rates measured by eddy covariance.
Materials and methods
Study site and instrumentation
The study site, the western peatland flux station, was established in 2003 as part of Fluxnet-Canada Research Network (FCRN; Margolis et al., 2006) and during 2007–2009 was part of the follow-on Canadian Carbon Program (CCP). The flux tower (54.95384°N, 112.46698°W) was located approximately 80 km northeast of Athabasca, Alberta (54.82°N, 113.52°W). The mean annual temperature and precipitation for the region [based on long-term (1971–2000) measurements made at Athabasca, Alberta] were 2.1 °C and 504 mm, respectively (Environment Canada, 2010). A detailed description of vegetation and site characteristics was previously provided by Syed et al. (2006), and the following is a brief summary of that information. The site is a ‘moderately rich treed fen’ according to the peatland classification of Vitt (1994) and Vitt et al. (1998). In Canada, peatlands are defined as wetland ecosystems with a minimum organic soil depth of 40 cm (National Wetlands Working Group, 1988). The vegetation was dominated by stunted trees of Picea mariana and Larix laricina, with high abundance of a tall shrub, Betula pumila, and a wide range of moss species, including Sphagnum spp. (S. angustifolium, S. fuscum, and others), brown moss species (Drepanocladus aduncus, Aulocomium palustre, and others) and a feather moss species (Pleurozium schreberi). The total ecosystem C stock (51 kg C m−2, total live and dead material in belowground peat plus live aboveground plant material) was dominated by C accumulated in below ground peat, with only about 1% of the total ecosystem C stock in aboveground live plant tissue. The two tree species accounted for about two-thirds of this aboveground live biomass. The ecosystem leaf area index, measured at peak leaf area in July 2004, was 2.6 ± 0.16 m2 m−2 (average ± SE). The terrain was quite flat, with relatively homogeneous vegetation throughout a fetch of 1.5–2 km in all directions, except directly north where the fetch was approximately 1 km before the peatland graded into an upland aspen forest.
Syed et al. (2006) described in detail the meteorological and eddy covariance measurements at the site, here we provide a short summary of the relevant information for this study. Incoming photon flux density of photosynthetically active radiation (PPFD) was measured using a quantum sensor (LI-190SA, LI-COR Inc., Lincoln, NE, USA) mounted at a height of 9 m on an instrument tower. Air temperature was measured using an air temperature and relative humidity probe (Vaisala HMP45C, Campbell Scientific, Edmonton, Canada) mounted in a ventilated radiation shield at a height of 5 m. Water table depth relative to average hummock height (within a 2 m radius) was measured in a well using a custom float and counterweight system attached to a potentiometer. Soil temperature was measured with thermisters (107B Soil Temperature Probe, Campbell Scientific) at depths of 2, 5, 10, 20, 50 and 100 cm. Volumetric soil moisture content was measured with soil water content reflectometers (CS616-L, Campbell Scientific), installed at depths of 7.5, 10 and 12.5 cm below the peat surface. The reflectometers had been previously calibrated in the lab in containers of commercial peat moss held at a range of water contents. With the exception of the rain gauge, all meteorological sensors were scanned at 5 s intervals and recorded as half-hourly means by a data logger (CR23X, Campbell Scientific) located in an insulated, heated and air-conditioned instrument hut. Cumulative precipitation was monitored with a weighing gauge (T-200B, Geonor Inc., Røa, Norway) located approximately 800 m north of the flux tower. Any missing meteorological data due to power failure or system maintenance (<1% of possible half-hour periods) was filled by linear interpolation.
The eddy covariance technique was used to measure net ecosystem fluxes of CO2 (NEE), latent heat and sensible heat (Syed et al., 2006). The eddy covariance sensors, mounted on an instrument tower at a height of 9 m, consisted of a three-dimensional sonic anemometer-thermometer (Solent R3, Gill Instruments, Lymington, UK) and a closed-path infrared gas (CO2/H2O) analyzer (model LI-7000, LI-COR Inc.). The infrared gas analyzer was mounted in a custom-built temperature-controlled housing, and maintained at 37 ± 0.5 °C. The rate of change in CO2 storage in the air column beneath the eddy covariance sensors was estimated using the single level measurement of CO2 concentration made at 9 m height, and this storage term was used in the final NEE calculations. We conducted an analysis to determine the level of turbulence (as indicated by friction velocity, u*) required for acceptable CO2 flux measurements at night. The nighttime EC measurements were grouped into six classes (from u*>0.0 to u*≥0.025 m s−1) based on u* increments of 0.05 m s−1 and graphed. This analysis showed a distinct plateau in nighttime NEE at and above the chosen u* threshold of 0.15 m s−1 (Syed et al., 2006). After screening data based on this threshold, we applied the FCRN standard procedure to partition NEE into photosynthesis and total ecosystem respiration and to determine annual integrated NEE. Barr et al. (2004, Appendix A) provided a detailed description of the FCRN standard NEE partitioning and gap-filling calculations. We briefly describe these procedures below. First, photosynthesis and respiration were derived from the measured NEE data, then gaps in the data set were filled using simple equations (one for photosynthesis and one respiration) derived from the measured data. A logistic equation was used to describe the relationship between soil temperature (5 cm depth) and ecosystem respiration, whereas a Michaelis–Menten equation was used to describe the relationship between incoming PPFD and ecosystem photosynthesis. Respiration measurements were defined as nighttime measurements of NEE, when photosynthesis was known to be inactive. Photosynthesis was set at zero for nighttime periods and calculated from respiration and NEE at other times. Fitted parameters for the equations for respiration and photosynthesis were first determined on an annual basis, and then an additional time-varying parameter was introduced into the equations. The respiration time-varying parameter was calculated from the slope of a linear regression between estimates of respiration from the logistic equation using an annual temperature relationship and the nighttime eddy covariance measurements in a moving window of 100 measured data points. The window was moved in increments of 20 data points, and the value of the time-varying parameter was assigned to the average time of the 100 data point window. The values of the time-varying parameter for each 30 min time step (within a data window) were estimated by linear interpolation. The modified annual equation for respiration (including the time varying parameter) was used to fill respiration data gaps. A similar approach was used to develop a time-varying parameter for the annual PPFD-photosynthesis equation, and the modified PPFD-photosynthesis equation was used to fill gaps in the photosynthesis record. Finally gaps in the measured NEE record were filled using calculations from the complete respiration and photosynthesis data sets. For the interval from August 1, 2003 until September 30, 2009, we obtained NEE data in 91.1% of the possible 30 min time periods. During a total of 58.9% of possible 30 min time periods, NEE measurements were available and friction velocity was above the threshold value of 0.15 m s−1. Therefore, gap-filled data included 41.1% of the total possible 30 min time periods during the 6-year study.
In the subsequent presentation and discussion in this manuscript, we use a positive sign convention for all three of the major components of ecosystem CO2 exchange: net ecosystem production [NEP (equals NEE), positive values mean uptake of CO2 by the ecosystem], total ecosystem respiration (TER, positive values mean release of CO2 to the atmosphere), and gross ecosystem production (GEP, positive values mean uptake of CO2 from the atmosphere). Flux measurements at the site began in August 2003 and were stopped in early October 2009. In order to calculate integrated annual values of GEP, TER, and NEP during 2009, we averaged values determined in the months October–December from the other 5 study years and used these average values to complete the 2009 annual budget.
The C budget components calculated from eddy covariance measurements must be considered in relation to uncertainties associated with the technique. Syed et al. (2006) calculated a combined random and systematic uncertainty of ± 32 g C m−2 yr−1 on an annual NEP in 2004 of 144 g C m−2 yr−1. However, the majority of the calculated total uncertainty was from the assessment of the systematic uncertainty associated with using friction velocity thresholds for screening and removing data during calm nighttime periods, while our initial assessment of random uncertainty was likely an underestimate. The vast majority of the systematic uncertainty resulted from the lowest friction velocity threshold (0.05 m s−1) used in the analysis (for comparison our regularly applied friction velocity threshold was 0.15 m s−1). We are confident in our regular friction velocity screening approaches and suggest that the systematic uncertainty assessment by Syed et al. (2006) was likely conservative. A new, independent assessment of random uncertainty in eddy covariance C budgets at our site has been recently determined as part of multisite synthesis study, and the random uncertainty evaluated using the Richardson et al. (2006) daily paired-observation method gave values of 15 g C m−2 yr−1 for NEP (along with uncertainty values of 51 and 56 g C m−2 yr−1 for ecosystem photosynthesis and respiration, respectively) (A. G. Barr, D. Y. Hollinger, A. D. Richardson, unpublished data). In addition, we have observed very good correspondence between integrated growing season C budgets based on eddy covariance and independent automatic chamber measurements at the site (Cai et al., 2010). We conclude that our calculations of C budget components were quite tightly constrained within a relatively narrow range of total uncertainty of 35 g C m−2 yr−1 [based on combining random (15 g C m−2 yr−1) and systematic (32 g C m−2 yr−1) uncertainties in quadrature] for NEP, and approximately 55 g C m−2 yr−1 for ecosystem photosynthesis and respiration (A. G. Barr, D. Y. Hollinger, A. D. Richardson, unpublished data).
 (1)
(1) (2)
(2) (3)
(3)Tree ring analyses
Two locations within the study site were selected, one approximately 100 m south and one 100 m north of the flux tower. At each of these two locations, five of the largest individual trees of P. mariana and L. laricina were selected and two increment cores per tree were collected with a Swedish increment corer. The cores were air dried, mounted on grooved wooden supports and sanded with progressively finer sandpaper. The increment cores were visually cross-dated under a dissecting microscope to identify any missing or false rings. Annual radial increments were measured (0.001 mm precision) with a dissecting microscope, a Velmex stage and Acu-Rite encoder (Velmex Inc., Bloomfield, NY, USA) and measurej2x software (VoorTech Consulting, Holderness, NH, USA). The average tree stem radius at the end of each growth year was determined by averaging the ring width measurements from the two increment cores per tree. Basal area increment (BAI, cm2 yr−1) was calculated from the average stem radius for a given year and the equation for the area of a circle. The calculated BAI was averaged for each year in the chronology for the five trees of a species; this was done separately for the two locations where the increment cores were collected.
Peat core nutrient content, age measurements and rates of C accumulation
Four shallow peat cores were collected using a 50 cm long, 10 cm inner diameter plastic tube with a sharpened edge that was inserted into the peat. After removal from the ground, the tube was capped, frozen and then the peat was removed and cut into approximately 2–3 cm depth segments before thawing. The thickness and area of each depth segment was measured, the segments were weighed and placed into separate paper bags for drying and subsequent analyses. For two of the shallow peat core collection points, deep samples were also collected using a Russian peat corer. After removal of the first 50 cm deep core, a Russian peat corer with a 50 cm × 5 cm chamber was used to sequentially extract peat samples until the clay sediment was reached at the base of the peat (approximately 1.5–1.9 m depth). The Russian peat core samples were separated into 10 cm increments in the field and stored in bags. Peat samples from both collection methods were dried at 60 °C, dry weights were determined, and then the samples were ground to a fine powder using a coffee grinder.
The total nitrogen (N) content, 15N/14N nitrogen isotope composition (δ15N, ‰), total C content, and 13C/12C C isotope composition (δ13C, ‰) were analyzed on N2 and CO2 gases, respectively, that were generated from combustion/reduction of the dried peat tissue in an elemental analyzer (Carla Erba NC2500, Milan, Italy) and quantified using a gas isotope ratio mass spectrometer (Delta Plus, Finnigan Mat, San Jose, CA, USA) at the University of Lethbridge (Ponton et al., 2006). All peat depth segments were analyzed for total C and N contents, and δ13C and δ15N isotope ratios, although for a few samples the δ15N isotope measurements were affected by an instrument malfunction and were not used in analysis. Additional macronutrient analysis (total content of: P, K, Mg, Ca, S) was conducted on peat tissue that was dry-ashed and then digested using a dilute HNO3 and HCl mixture, and then quantified using an Inductively Coupled Plasma (ICP) spectroscopic analysis technique at Norwest Labs, Lethbridge. Only every third peat depth segment (2–3 cm interval) was analyzed for these additional macronutrients in the short cores, but every 10 cm depth segment from the deep cores was analyzed for macronutrient content.
Across the top section (approximately 0–30 cm depth) of the shallow peat cores a few of the 2–3 cm depth segments were dated using the 210Pb technique based on measurements made at Flett Research Ltd., Winnipeg, Canada. The exact number of shallow peat samples dated is indicated in Table 1. The technique assumes that the 210Pb concentrations in peat samples decrease exponentially with depth, approaching a value taken to represent the supported 210Pb activity formed within the soil, in contrast to that deposited from the atmosphere. The 210Pb activity was estimated by measuring the α-emitting 210Po granddaughter isotope after spiking samples with 209Po yield tracer. The constant rate of supply model of Appleby & Oldfield (1978) was applied to calculate the ages of the peat samples.
| Characteristic | Photosynthesis | Respiration |
|---|---|---|
| Eqn (2): Parameters for GDD | ||
| β (g C m−2 yr−1) | 944 | 756 |
| γ (growing degree days) | 1354 | 1359 |
| ω (growing degree days) | 475 | 422 |
| r 2 | 0.866 | 0.810 |
| Eqn (2): Parameters for water table depth | ||
| β (g C m−2 yr−1) | 941 | 755 |
| γ (cm) | −54 | −58 |
| ω (cm) | −50 | −52 |
| r 2 | 0.891 | 0.826 |
| Eqn (3): Parameters | ||
| β (g C m−2 yr−1) | 971 | 753 |
| γq (growing degree days) | 1078 | 1416 |
| ωq (growing degree days) | 1742 | 2200 |
| γs (cm) | −52 | −58 |
| ωs (cm) | −45 | −45 |
| r 2 | 0.899 | 0.837 |
- The r2 value shows the proportion of variation in the data that was explained by the regression (see Fig. 7).
 (4)
(4)Basal peat samples from the two deep cores were dated using 14C at the IsoTrace Radiocarbon Laboratory at the University of Toronto. The 14C results we present are the average (± SD) of four separate analyses (high precision) on each core sample. All results were corrected for natural and sputtering isotope fractionation using measured 13C/12C ratios. The sample ages are quoted as uncalibrated conventional radiocarbon dates in years before present, using the Libby 14C mean life of 8033 years. The radiocarbon dates were not converted to calibrated, calendar dates because, for our samples, this would not have significantly changed the values for our intended application of calculating long-term average rates of peat C accumulation. We used the second-to-last 10 cm segment from the two deep cores for the 14C analyses, as these samples had C contents similar to all other peat segments from positions higher in the cores (average=46% C), whereas in the last segment of the peat core the C content dropped to between 31% and 37% upon reaching clay mineral sediments.
Results
Variation in environmental conditions
During the 6-year study, cumulative GDD varied from a minimum of approximately 1096 in 2004 to a high of 1466 in 2006 (Fig. 1a). Based on the long-term (1971–2000) Environment Canada weather records at nearby Athabasca, the average (± SD) GDD was 1310 ± 105. Both 2004 and 2005 were substantially cooler than normal with cumulative GDD values greater than 1 SD lower than the long-term average, whereas 2006 was very warm with cumulative GDD greater than one SD higher than normal. In 2007 cumulative GDD (1321) was almost exactly the same as normal, while both 2008 and 2009 were within 1 SD of normal, but 2008 was slighter warmer (GDD 1396) and 2009 was slightly cooler (GDD 1265) than the long-term average GDD (Fig. 1a).
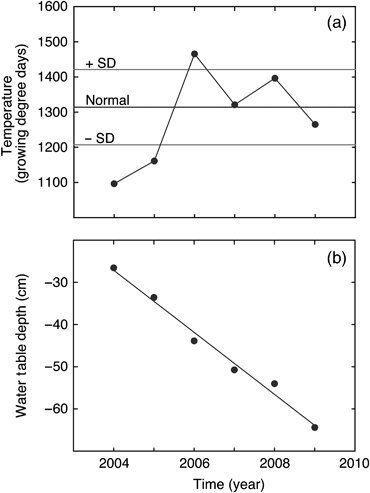
Comparison of interannual variation in (a) temperature (expressed as cumulative growing degree days, March–October), and (b) water table depth (average value during May–October) at the western peatland flux station in northern Alberta, Canada. The indicated normal value (average ± SD) shown in panel (a) is based on the long-term (1971–2000) Environment Canada weather records measured at nearby Athabasca, Alberta. The line fitted to the data in panel (b) was: y=−7.3531x+14 709, r2=0.98.
The average water table depth during the growing season (May–October) declined linearly approximately 38 cm during the 6-year study period, from a maximum of −26.6 cm in 2004 to a minimum of −64.4 cm in 2009 (Fig. 1b). The reduction in water table depth was primarily caused by progressively lower precipitation in May–August throughout the 6-year study period (Fig. 2). The cumulative precipitation during May–August in 2009 (134 mm) was <50% of the long-term average ± SD (306 ± 68 mm) during this summer time period. The measured (actual) cumulative evapo-transpiration during May–August in 2005–2007 was approximately equal to, or higher than, the coincident summer precipitation inputs which contributed to the observed water table decline. The actual evapo-transpiration increased slightly from 2004 to 2007, but dropped sharply in 2008 and 2009 (Fig. 3). This drop in actual evapo-transpiration occurred despite calculated potential evapo-transpiration being as high or higher in 2008 and 2009 than in the earlier study years (Fig. 3).
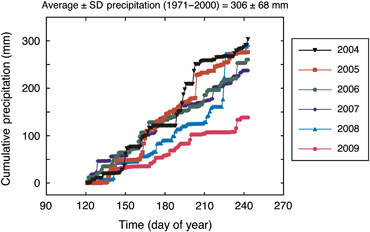
Comparison of interannual variation in daily precipitation recorded during May–August at the western peatland flux station in northern Alberta, Canada. The indicated average (± SD) is based on the long-term (1971–2000) Environment Canada weather records measured at nearby Athabasca, Alberta.
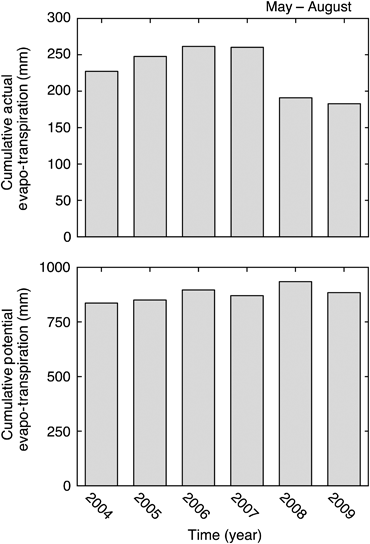
Comparison of interannual variation in: (top) cumulative actual (measured) evapo-transpiration; and (bottom) calculated cumulative potential evapo-transpiration during May–August at the western peatland flux station in northern Alberta, Canada.
The daily average peat soil volumetric moisture content declined in association with seasonal reductions in daily average water table depth (Fig. 4). A logistic relationship occurred between soil moisture content and water table depth; however, a different specific relationship was apparent for each study year (Fig. 4). During 2006–2008, a wide range of soil moisture contents were apparent from the maximum [approximately 0.7 m3 m−3, or near maximum (0.6) in 2006] to the minimum of approximately 0.3 m3 m−3. By contrast, in 2005 soil moisture content remained high with only a small seasonal change, while in 2009 soil moisture content remained very low, at or near the minimum values recorded during the entire study (Fig. 4). In addition, there was a significant linear decline during the 6-year study in the average soil water content apparent during the middle of the growing season (June 15–August 15; Fig. 5).
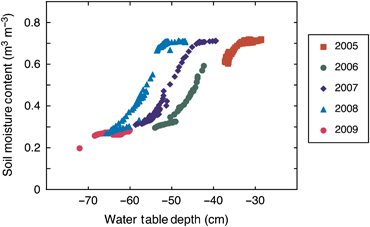
Comparison of interannual variation in the relationship between daily average (peat) soil moisture content and water table depth. Soil water content measurements represent the average of three probes located at depths of 7.5, 10 and 12.5 cm below the surface in Sphagnum moss.
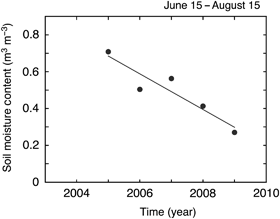
Interannual variation in average soil (peat) water content at the western peatland flux station during mid-summer (June 15–August 15). Soil water content measurements represent the average of three probes located at depths of 7.5, 10 and 12.5 cm below the surface in Sphagnum moss. The line fitted to the data was: y=−0.0967x+194.61, r2=0.87.
Seasonal and annual variation in ecosystem CO2 exchange
We first focus on patterns of variation in ecosystem CO2 exchange during the growing season months (May–October) because previous studies at the site have shown that the relatively harsh environmental conditions during the winter and early spring resulted in no photosynthetic activity and only very low rates of ecosystem respiration (Syed et al., 2006; Cai et al., 2010; Long et al., 2010). Rates of ecosystem photosynthesis and respiration increased rapidly from low values in May to reach peak values in July before declining to near minimum values at the end of October in all study years (Fig. 6a and b). In general there was a trend toward higher peak July rates of ecosystem photosynthesis and respiration during 2004–2009, as conditions progressed from the very cool and high water table conditions in 2004–2005, to drier and warmer conditions through the remaining 4 years of the study (Fig. 6a and b). One exception to this general pattern was the lower ecosystem respiration rate measured in July 2005, while ecosystem photosynthesis was similar in July of 2004, 2005, and 2006. As a result NEP in July 2005 was very high (Fig. 6c).
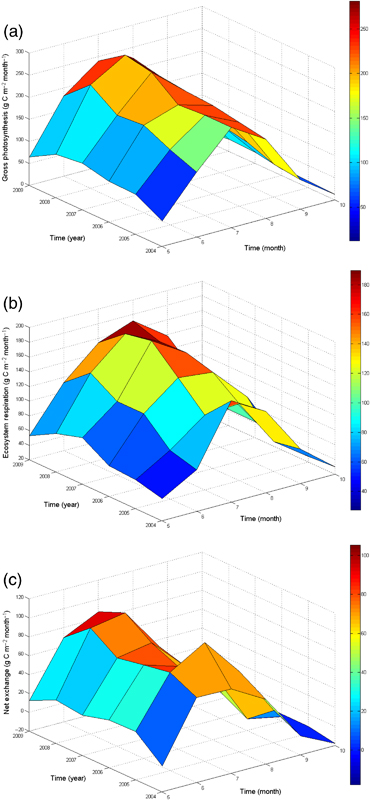
Comparison of seasonal (May–October) and interannual variation in monthly integrated values of: (a) gross ecosystem production (GEP); (b) total ecosystem respiration (TER); and (c) net ecosystem production (NEP). We use a positive sign convention for presenting all three of the major components of ecosystem CO2 exchange: NEP=GEP−TER.
Annual rates of ecosystem photosynthesis and respiration both showed similar patterns of response to interannual variation in temperature (expressed as cumulative GDD, March–October) and water table depth (average value during May–October) (Fig. 7). Photosynthesis and respiration were positively correlated with cumulative GDD [Pearson product–moment correlation coefficient (r); photosynthesis, r=0.762; respiration, r=0.743], and they were both negatively correlated with average water table depth (photosynthesis, r=−0.781; respiration, r=−0.839). However, the relatively strong correlation that occurred between interannual variation in GDD and water table depth (r=−0.569), made it difficult to determine which environmental variable was most important in influencing ecosystem CO2 exchange rates. Therefore, partial correlation coefficients were calculated in order to determine the correlation between a dependent variable (photosynthesis or respiration) and one independent variable (GDD or water table depth), whereas the second independent variable was held constant (Sokal & Rohlf, 1995). The partial correlation between photosynthesis and water table depth (−0.513) had a higher absolute magnitude than the partial correlation between photosynthesis and GDD (0.470). Similarly, the partial correlation between respiration and water table depth (−0.616) had a higher absolute magnitude than the partial correlation between respiration and GDD (0.393). These analyses suggested that that change in water depth had a stronger effect on interannual variation in GEP and TER than did the change in GDD.
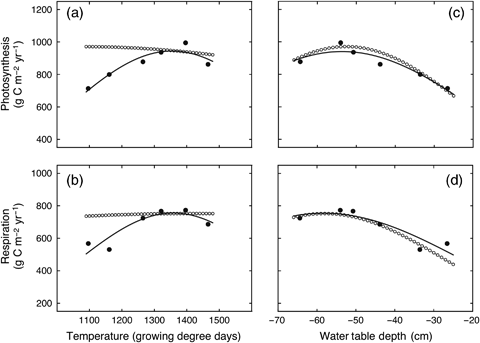
Response of annual-integrated values of: (a) ecosystem photosynthesis and (b) ecosystem respiration to variation in temperature (expressed as cumulative growing degree days, March–October). Also shown are the responses of: (c) ecosystem photosynthesis and (d) ecosystem respiration to variation in water table depth (average value during May–October) at the western peatland flux station in northern Alberta, Canada. The solid lines represent calculations carried out with Eqn (2) and fitted parameters shown in Table 1. The dotted lines also represent calculations carried out with Eqn (2), but when parameters γ and ω, were replaced with values from γs and ωs for respiration calculations (Fig 7c), and replaced with values from γq and ωq for photosynthesis calculations (Fig 7a; Table 1).
We also used fits of Eqns (2) and (3) to further analyze the influence of GDD and water table depth on GEP and TER. The nonlinear regression fits of Eqn (2) (Table 1) were highly significant (P<0.01, based on analysis of variance, data not shown) and explained a large proportion of the variation in the data illustrated in Fig. 7. An even higher proportion of the variation in the data was explained by fits of Eqn (3) to the relationship between ecosystem CO2 exchange rates (photosynthesis and respiration) and simultaneous changes in both environmental conditions (GDD and water table depth) (Table 1). The parameters, γ and ω, that resulted from fits of Eqn (2) to the relationships between water table depth and both GEP and TER, were very similar to the parameters, γs and ωs, that resulted from the fits of Eqn (3). By contrast, there was a large difference between the ω parameters, that resulted from fits of Eqn (2) to the relationships between GDD and both GEP and TER, and the ωq parameters that resulted from fits of Eqn (3). In particular the ωq parameters were much higher than the associated ω parameters (Table 1). The implications of this can be illustrated in Fig. 7 by comparing the results of calculations done using Eqn (2) and its associated fitted parameters, with calculations carried out using Eqn (2) when parameters γ and ω, were replaced with values from γs and ωs for TER, and subsequently replaced with values from γq and ωq for GEP. The modelled effect of change in water table depth on GEP and TER was very similar when using parameters γ and ω in Eqn (2), or when they were replaced with values from γs and ωs (Fig. 7c and d). By contrast, there was a large difference for the modelled effect of change in GDD on GEP and TER when using parameters γ and ω in Eqn (2), and when they were replaced with values from γq and ωq (Fig. 7a and b). The large increase in the ωq parameter had the effect of greatly increasing the width of the ‘bell-shape curve’ relationship so that it approximated a horizontal straight line, thus suggesting no significant influence of GDD on either of GEP and TER.
There was no significant correlation between annual NEP and either cumulative GDD (r=−0.016, P>0.05) or average water table depth (r=0.189, P>0.05) (Fig. 8). Interannual variation in NEP appeared to be associated with relatively subtle differences in the response of photosynthesis and respiration to monthly environmental conditions during the growing season, an example of which was previously noted above for July 2005 (Fig. 6). The ecosystem was a relatively strong net sink for CO2 on an annual basis with an average (± SD) NEP of 189 ± 47 g C m−2 yr−1 based on integrated eddy covariance measurements during the 6-year study.
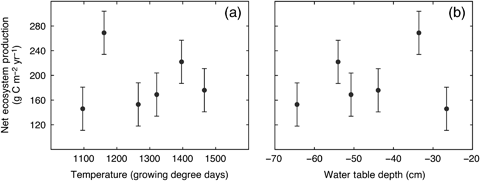
Response of annual-integrated values net ecosystem production (NEP) to variation in (a) temperature (expressed as cumulative growing degree days, March–October), and (b) water table depth (average value during May–October) at the western peatland flux station in northern Alberta, Canada. Error bars represent an estimate of total uncertainty in the NEP measurements of ± 35 g C m−2 yr−1.
Historical patterns of tree establishment and growth
The oldest tree rings from P. mariana trees were dated to approximately 1870 (140 years ago), while the oldest tree rings in L. laricina trees were dated to approximately 1960 (50 years ago) (Fig. 9). The average BAI in the initial years after tree establishment (1870–1940) was very low in P. mariana trees, but growth rate started to increase in 1940 with peak growth rates apparent in the period 1960–1970, after which BAI declined. Tree growth rate increased much more quickly in L. laricina after initial establishment in about 1960, with peak BAI observed in the mid-1990s and only slightly lower growth rates recorded in the most recent years (2000–2003). The relative historical patterns of tree growth were similar in both areas where increment cores were collected, but both tree species had higher BAI in the area located south of the flux tower (Fig. 9).
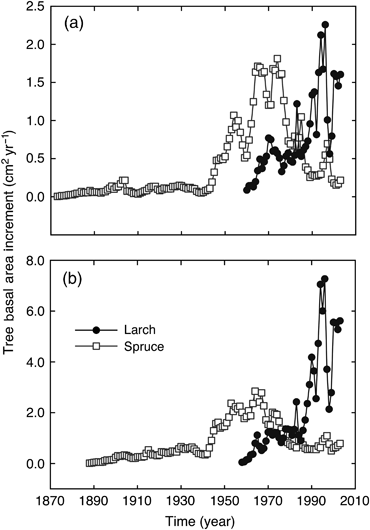
Comparison of average basal area increment (BAI) of Picea mariana (Spruce) and Larix laricina (Larch) trees at the western peatland flux station in northern Alberta, Canada. Tree cores were sampled in 2004. The calculated BAI was averaged for each year in the chronology for the five trees of a species. This was done separately for the two locations where the increment cores were collected: (a) approximately 100 m north of the flux tower and (b) approximately 100 m south of the flux tower.
Historical rates of peat C accumulation and peat nutrient characteristics
Fits of Eqn (4) to the relationship between peat age and cumulative C stock produced average values for: (i) the rate of C addition to the peat acrotelm (p) of 116 ± 17 g C m−2 yr−1, and (ii) the peat decay rate coefficient (α) of 0.015 ± 0.002 yr−1 (Table 2). The balance between C addition to (p), and total loss of C from (αx), the top 30 cm depth (peat age 70 years) of the shallow peat cores averaged 43 ± 12 g C m−2 yr−1 (Table 2). The penultimate basal peat samples from the two deep cores had un-calibrated conventional radiocarbon dates of 2150 ± 50 and 2270 ± 40 years before present. The cumulative amounts of C in the two deep peat cores at their penultimate basal depth segments (140 cm and 180 cm) were: 40 740 and 54 700 g C m−2. The apparent long-term average rates of net C sequestration calculated from these measurements were: 19 and 24 g C m−2 yr−1, respectively.
| Characteristic | Core 1 | Core 2 | Core 3 | Core 4 | Average ± SE |
|---|---|---|---|---|---|
| Age of oldest dated segment (years) | 68.2 | 68.1 | 63.7 | 78.7 | 70 ± 3 |
| Depth of oldest dated segment (cm) | 47.3 | 23.5 | 25.0 | 22.7 | 30 ± 6 |
| Productivity (p) (g C m−2 yr−1) | 156.2 | 74.2 | 111.5 | 123.1 | 116 ± 17 |
| Decay rate α (year−1) | 0.010 | 0.012 | 0.020 | 0.018 | 0.015 ± 0.002 |
| n | 13 | 4 | 6 | 6 | |
| r 2 | 0.98 | 0.98 | 0.99 | 0.99 | |
| Input–output for acrotelm (p−αx) (g C m−2 yr−1) | 79 | 33 | 31 | 30 | 43 ± 12 |
- Also shown are calculations of terms (p, α) in the Clymo (1984) model of peat growth (equation 4). The sample size (n) refers to the number of different peat segments that were dated and used in the nonlinear regression fit to Eqn (4). The r2 value shows the proportion of variation in the data that was explained by the regression.
Several changes occurred to the chemical composition of the top 30 cm of the peat with increases in depth and age of the peat profile including; decline in C : N ratio, increase in peat density, and increase in both C (δ13C) and N (δ15N) isotope compositions (Fig. 10). There was an initial decline in the concentration of N with increasing age in the shallow peat cores, followed by a rise as the peat aged to concentration values that stabilized at an average of approximately 16 mg g−1 (Fig. 11, Tables 3 and 4). While data were more limited, phosphorus and sulphur also showed an initial reduction in concentration followed by an increase similar to that of N. However, for sulphur the increase in concentration continued throughout the remaining depth of the shallow and deep cores (Tables 3 and 4). By contrast, the initial increase for phosphorus peaked at a peat age of approximately 40 years and declined to average values in the deep cores of approximately 0.45 mg g−1 (Fig. 11, Tables 3 and 4). There was a sharp reduction in potassium concentration from relative high concentrations in the living moss of the top section of the cores to very low potassium concentrations at the bottom of the shallow core, and even lower average concentrations in the deep cores (Fig. 11, Table 4). Both magnesium and calcium showed initial increases in concentration with peat age, with values that stabilized and remained relatively constant through the remaining segments of both the shallow and deep cores (Fig. 11, Tables 3 and 4).
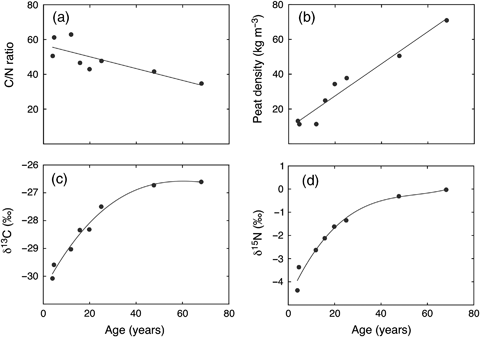
Change in peat characteristics over time (with depth): (a) carbon : nitrogen ratio; (b) peat density (kg m−3); (c) carbon isotope composition (δ13C, ‰); (d) nitrogen isotope composition (δ15N, ‰). These data were from Core 2, as shown in Tables 2 and 3. The peat age is based on 210Pb-dating of the second, fourth, sixth, and eighth samples, with age of the other four peat segments estimated based on an age (y)–depth (x) regression relationship: y=0.0099x3−0.1977x2+2.09x; r2=0.987.
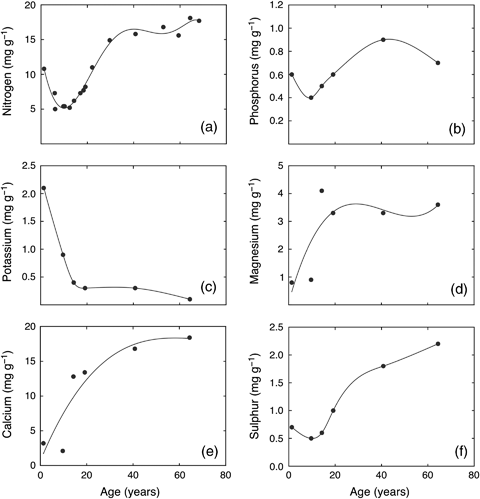
Change in macronutrient concentration (mg g−1) in shallow peat cores over time (with depth): (a) total nitrogen concentration; (b) total phosphorus; (c) potassium; (d) magnesium; (e) calcium; (f) total sulphur. These data were from Core 1, as shown in Tables 2 and 3. The peat age is based on 210Pb-dating. The peat ages (years) (x) can be converted to depths (cm) (y) using the following polynomial equation: y=0.0003x3−0.0421x2+2.2016x−3.456; r2=0.98.
| Trait | Core 1 | Core 2 | Core 3 | Core 4 | Average ± SE |
|---|---|---|---|---|---|
| C | 454 ± 19 | 463 ± 11 | 476 ± 23 | 457 ± 8 | 463 ± 5 |
| N | 10.9 ± 5.1 | 10.1 ± 1.7 | 17.7 ± 7.0 | 11.1 ± 3.4 | 12.5 ± 1.8 |
| P | 0.6 ± 0.2 | 0.7 ± 0.2 | 0.9 ± 0.2 | 0.5 ± 0.3 | 0.7 ± 0.1 |
| K | 0.7 ± 0.7 | 0.8 ± 1.1 | 0.8 ± 0.9 | 0.5 ± 0.5 | 0.7 ± 0.1 |
| Mg | 2.7 ± 1.4 | 3.6 ± 1.5 | 3.0 ± 1.3 | 3.7 ± 1.3 | 3.3 ± 0.2 |
| Ca | 11.1 ± 6.9 | 14.2 ± 6.4 | 10.3 ± 5.1 | 18.6 ± 4.1 | 13.6 ± 1.9 |
| S | 1.1 ± 0.7 | 1.7 ± 0.9 | 2.8 ± 2.5 | 2.5 ± 1.6 | 2.0 ± 0.4 |
| C : N ratio | 51 ± 23 | 47 ± 8 | 32 ± 14 | 45 ± 14 | 44 ± 4 |
| Peat density (kg m−3) | 37 ± 16 | 45 ± 21 | 58 ± 29 | 44 ± 26 | 46 ± 4 |
| δ 13C (‰) | −27.1 ± 0.3 | −27.3 ± 1.3 | −27.7 ± 0.7 | −27.2 ± 0.8 | −27.3 ± 0.1 |
| δ 15N (‰) | −1.4 ± 1.2 | −1.5 ± 1.1 | −1.3 ± 0.3 | −0.9 ± 0.5 | −1.3 ± 0.1 |
- Sample sizes for C, N content, peat density and δ13C were 18, 17, 22, 22, for Cores 1–4, respectively. Sample sizes for all other macronutrient measurements were 6, 6, 7, 7, for Cores 1–4, respectively. Sample sizes for δ15N were 13, 17, 16, 14 for Cores 1–4, respectively.
| Trait | Core 1 | Core 2 |
|---|---|---|
| C | 462 ± 53 | 462 ± 29 |
| N | 16.5 ± 5.1 | 13.6 ± 2.7 |
| P | 0.5 ± 0.1 | 0.4 ± 0.1 |
| K | 0.3 ± 0.4 | 0.2 ± 0.3 |
| Mg | 3.1 ± 0.4 | 4.1 ± 0.5 |
| Ca | 20.1 ± 2.1 | 21.9 ± 1.3 |
| S | 7.9 ± 2.4 | 8.3 ± 2.3 |
| C : N ratio | 28 ± 4 | 35 ± 7 |
| Peat density (kg m−3) | 71 ± 23 | 76 ± 20 |
| δ 13C (‰) | −26.6 ± 0.4 | −26.5 ± 0.7 |
| δ 15N (‰) | 0.0 ± 0.9 | −0.1 ± 0.6 |
- Sample sizes for all measurements on Core 1, n=10; on Core 2, n=14.
Discussion
Ecosystem response to interannual variation in temperature and water table depth
Both ecosystem photosynthesis and respiration showed similar increases in response to the warmer and drier conditions experienced during the 6-year study period (Fig. 7). This was contrary to previous predictions of peatland response to climate change which have suggested that respiration increases should override changes in photosynthesis and result in net losses of CO2 as peatland ecosystems respond to warmer temperatures and lower water tables (Moore et al., 1998; Davidson & Janssens, 2006; Tarnocai, 2006). However, such predictions of a stronger response for respiration than photosynthesis may only occur if changes in temperature are the most important environmental change. In an observational study such as this, it is difficult to separate the effects temperature and water table changes because the two environmental changes were coincident and (negatively) correlated. However, our statistical analysis, involving partial correlation coefficients and more importantly the fits of Eqns (2) and (3) to the data shown in Fig. 7, strongly suggested that interannual variation in water table depth was the major cause of the variation we observed in photosynthesis and respiration. If only the change in water table depth was biologically significant, then perhaps more equitable responses of photosynthesis and respiration should be expected. In support of this suggestion, recent studies in a shrub-dominated wetland (Sulman et al., 2009) and in several fens (Sulman et al., 2010) showed that reductions in the water table stimulated almost equal increases to ecosystem photosynthesis and respiration, so that there was no effect of water table changes on net ecosystem CO2 exchange. Lower water tables can increase soil temperature, enhance oxygen supply to roots and improve nutrient availability, all factors that should stimulate both higher photosynthesis and respiration (Shaver et al., 1992; Larcher, 1995). This has implications for future ecosystem responses to environmental change because draining of forested peatlands in Finland has resulted in continued net C sequestration in trees and soils for decades after the lowering of the water table (Minkkinen et al., 2002). In contrast, classic eco-physiological studies have shown that warmer temperatures alone do normally result in asymmetric responses of respiration and photosynthesis (Larcher, 1995).
Current rates of NEP measured via eddy covariance
We measured very large annual rates of NEP via eddy covariance, an average (± SD) NEP of 189 ± 47 g C m−2 yr−1 during the 6-year study. This was 3.8 times higher than the NEP value (50 g C m−2 yr−1) predicted from peat core C accumulation and C losses associated with methane emission and organic and inorganic C in runoff, as discussed below. In addition our NEP measurements were higher than that reported by other eddy covariance studies in several peatland types in Canada and Europe. For example, Arneth et al. (2002) calculated an annual uptake of 22–36 g C m−2 yr−1 at the Zotino bog in Siberia, while Schulze et al. (2002) reported 43–62 g C m−2 yr−1 at a Siberian Aapa mire. In a subarctic fen in northern Finland, net annual C sequestration varied between 4 and 53 g C m−2 yr−1 over 6 years of study (Aurela et al., 2004). An ombrotrophic bog near Ottawa (Mer Bleue), Canada had annual NEP that averaged 40 g C m−2 yr−1 during 6 years of study (Roulet et al., 2007), while annual net CO2 uptake ranged between 48 and 55 g C m−2 yr−1 in a boreal oligotrophic minerogenic mire in Sweden during 2 years (Nilsson et al., 2008). We conclude that our average annual NEP from eddy covariance measurements was much higher than values reported for several other peatland sites, but quite tightly constrained within a relatively narrow range of uncertainty of 35 g C m−2 yr−1 (Syed et al., 2006; A. G. Barr, D. Y. Hollinger, A. D. Richardson, unpublished data).
There are several factors that have contributed to the high rates of NEP we have measured over the last 6 years. First, the western peatland site has a relatively high leaf area index (2.6) compared with many other peatland sites (Humphreys et al., 2006; Lund et al., 2010), and LAI is increasing with tree growth and density changes (Fig. 9). Approximately 50% of the peak summer leaf area was contributed by a broad-leaf shrub (Betula pumila) and the two tree species, and both Betula and L. laricina have relatively high leaf-level photosynthetic rates (Syed et al., 2006). The increasing woody plant biomass, with high C/N ratio, allows significant rates of C sequestration to occur even in a relatively nutrient limited peatland environment (Shaver et al., 1992; 2000). In addition, the nutrient availability at our study site, as discussed more fully below, was also likely higher than at many of the other peatlands listed above, sites that were generally oligotrophic and mostly bogs.
Patterns of tree establishment and peatland succession
A general pattern of successional development occurs in peatlands in continental, boreal regions of Canada (Kuhry et al., 1993). In this successional pattern a site develops through a series of stages from a pond, to marsh or open fen, to a treed rich fen, to a treed poor fen, to a forested dry bog. The terms ‘rich’ and ‘poor’ relate to species richness, not nutrient availability (Vitt et al., 1998). The transition from a rich fen to a poor fen is strongly correlated with a change in pH of the near-surface water from above pH 6 to below pH 5 (Kuhry et al., 1993). This temporal pattern of vegetation change is largely an internal (autogenic) process that is controlled by peat accumulation and a shift from early dominance of brown moss species (particularly Drepanocladus) to later dominance of Sphagnum moss, with the Sphagnum species responsible for an acidification of the water. Continued Sphagnum peat accumulation and acidification creates conditions for establishment and growth of P. mariana trees and results in the surface of the peatland becoming elevated and separated from the mineral-rich ground water. Ultimately this process leads to the development of a forested bog where the surface vegetation relies strongly on precipitation input for water and nutrients (Kuhry et al., 1993).
The western peatland study site is currently classified as a moderately rich treed fen, but it appears to be near the stage of transition toward a poor fen. This suggestion is supported by the fact that a mixture of brown moss species and Sphagnum moss species are currently present at the site, but the surface water pH is still 6.2 (Syed et al., 2006). Analysis of increment cores of the oldest trees (Fig. 9) and examination of time sequences of air photographs of the site (data not shown) indicate that significant tree growth was not apparent until the early 1960s. The oldest P. mariana trees at the site were established in approximately 1870 (140 years ago), although peak BAI growth in these Picea trees did not occur until approximately 1960, the approximate time when the oldest L. laricina trees became established at the site (Fig. 9). These data suggest that it was only about 50 years ago that peat accumulation reached the point where the peatland surface was stable enough to support significant tree growth rates, although the majority of the larger trees present at the site still have stunted growth features consistent with the influence of water logging caused by a high water table (Syed et al., 2006). While the growth rate of oldest Picea trees has passed its peak (Fig. 9), there has been significant recruitment of a new cohort of Picea trees as shown by the proportionally high biomass (approximately 20% of total aboveground biomass) for small trees with a DBH <1 cm (Syed et al., 2006).
We suggest that the significance of this information on peatland successional development and patterns of tree establishment is that the study site is currently changing from a relatively open fen with small stunted trees toward a poor fen with a greater density of Picea trees that, in the absence of external disturbance, will eventually form a closed canopy forested bog. We suggest that the site is now in a phase of relatively rapid tree establishment and associated increase in LAI. An analogous mid-successional stage in upland forest ecosystems is a period when high rates of ecosystem NEP are usually apparent (Bond-Lamberty et al., 2006; Goulden et al., 2011). This has implications for comparisons between current rates of ecosystem NEP as measured by eddy covariance, with historical rates of net C accumulation measured in peat cores.
Rates of peat C accumulation and other NEP budget components
Assuming that the top 30 cm of the peat profile was a good approximation of the acrotelm, calculations using Clymo's (1984) peat growth model [Eqn (4)] suggest that aboveground net primary productivity (NPP) or C input to the acrotelm was 116 ± 17 g C m−2 yr−1, but that transfer of C to the catotelm below (p−αx) was only 43 ± 12 g C m−2 yr−1 because of decay occurring in the acrotelm (Table 2). If subsequent decay in the catotelm is very slow then net C sequestration should be similar to (but lower than) the rate of transfer into the catotelm. Consistent with this suggestion, measurements of the cumulative C stock near the base of the peat profile divided by its radiocarbon age provided estimates of the long-term average C accumulation rate (NEP) of 19–24 g C m−2 yr−1. Similar long-term average peat C accumulation rates of 14–25 g C m−2 yr−1 have been recorded in other studies (Clymo et al., 1998; Vitt et al., 2000; Gorham et al., 2003; Turunen et al., 2004; Roulet et al., 2007).
Other major components of a complete peatland NEP budget, in addition to that measured as C accumulation in peat cores, include loss of organic and inorganic C in runoff and emission of methane (Christensen et al., 2007; Roulet et al., 2007; Nilsson et al., 2008). We have not measured rates of C lost in runoff or water moving through the fen, but Roulet et al. (2007) and Nilsson et al. (2008) have shown that these losses can be approximately 14–20 g C m−2 yr−1. Potentially higher rates of C loss could have occurred in our fen site because the rate of water movement through the system is likely higher than rates at the Mer Bleue bog site studied by Roulet et al. (2007). Eddy covariance measurement of net methane release from the western peatland study site showed it to be very low, only a total of 2.4 g C m−2 was lost as methane during the 2007 growing season (days 144–269; Long et al., 2010). However, 2007 was a relatively dry year at our site and C loss via methane emission may contribute more in years when the water table is higher. For comparison, the average loss of C as methane emission from the Ottawa Mer Bleue bog was 3.7 g C m−2 yr−1 (Roulet et al., 2007), while Nilsson et al. (2008) reported higher annual losses of C as methane emission (9–14 g C m−2 yr−1). If we assume (i) that the total amount of C lost as runoff at our study site was at the high end of the range measured by Nilsson et al. (2008) (20 g C m−2 yr−1), and (ii) that typical methane emission approached a value similar to that reported by Nilsson et al. (2008) (10 g C m−2 yr−1), then the annual NEP averaged over the last 2200 years, including C accumulated in peat organic matter (20 g C m−2 yr−1), should total approximately 50 g C m−2 yr−1.
Peat nutrient content and other sources of nutrient input
Measurements of the macronutrient concentrations in peat profiles provide some insight into nutrient release from decomposition/mineralization, as well as other processes. For example, the decline in C : N ratio, increase in peat density, and increase in both C (δ13C) and N (δ15N) isotope compositions of the peat with changes in depth (Fig. 10) were all indicative of decomposition occurring in the upper peat profile (Malmer & Holm, 1984; Damman, 1988; Kuhry & Vitt, 1996). The shifts in stable isotope composition resulted from isotope fractionation during microbial transformations in which the lighter isotope (12C, 14N) reacts faster, thus leaving the heavier isotopes to accumulate in remaining soil pools (Nadelhoffer & Fry, 1988). The N : P ratios in the upper layers (0–20 years) of the peat organic material at our site tended to be lower than 14 (Fig. 11), suggesting that productivity was more strongly limited by N than phosphorus availability (Koerselman & Mueleman, 1996). The initial decline in N concentration in the peat profile (Fig. 11) was likely a result of removal/translocation of N from older to newer living moss at the top of the peat core (a pattern also possibly occurring for phosphorus and sulfur) (Damman, 1978). Uptake of N by living moss and vascular plant roots may also have contributed to the initial decline in concentration (Malmer & Holm, 1984). The subsequent increase in N concentration in peat, as decomposition was proceeding, suggested that N was being taken up by microorganisms (immobilization) and later returned to the peat soil total N pool as microbe litter (Malmer & Holm, 1984; Damman, 1988). Immobilization of all other macronutrients except potassium was also suggested in the top portions of the peat core profile. By contrast, the initial sharp decline and then slower progressive reduction in potassium concentration could be a result of potassium initially being leached or removed and translocated from older to actively growing moss (and other plants), as well as mineralization and release of this nutrient during peat decomposition (Damman, 1978). The suggestion of immobilization for most macronutrients during initial peat profile decomposition would be consistent with the relatively low plant tissue nutrient concentrations, cold conditions and relatively high water table in peatlands (Davidson & Janssens, 2006). Because of the suggestion of general nutrient immobilization, it is not clear that peat decomposition alone would be sufficient to supply nutrients (particularly N) at rates required to support the high NEP we have measured by eddy covariance.
In addition to nutrients released during decomposition of organic matter in the peat profile, some elements required for plant growth can also be supplied by the surface water flowing through the fen. Previous measurement of the nutrient concentration in the surface water at our study site was reported by Syed et al. (2006), and this information is shown in Table 5 where it is compared to measurements made by Vitt et al. (1995) in two similar, nearby fens in Alberta. While the concentrations of calcium and magnesium were similar to the other nearby sites, the ammonium and total phosphorus concentrations in surface water were higher at our study site than in other nearby fens (Table 5). Vitt et al. (1995) also noted that both ammonium and total phosphorus showed much higher concentrations at depth in the peatlands they studied. For example, three of the five sites had ammonium concentrations greater than 300 μg L−1 at 0.5 m depth. The ammonium and phosphorus concentrations in surface water, and perhaps also in deeper water, may help to support the high NEP we have measured. Atmospheric wet and dry deposition could also supplement nutrient availability at our study site. The average, cumulative inputs of N and phosphorus in wet deposition in Alberta are 14 275 and 931 mg m−2 100 years−1, respectively (Myrick & Hunt, 1998 as reported in Turetsky et al., 2000), which represents approximately 10–20% of the accumulation of these two nutrients in some fen and bog ecosystems in northern Alberta (Turetsky et al., 2000). We are unaware of local measurements of elemental dry deposition rates.
| Nutrient | Western peatland | Bleak Lake poor fen | Forested moderately rich fen |
|---|---|---|---|
| NH4+ (μg L−1) | 48 | 12 | 10 |
| NO3− (μg L−1) | 5 | 3 | 2 |
| Total P (μg L−1) | 630 | 100 | 450 |
| K+ (mg L−1) | 0.5 | 2.4 | 2.6 |
| Mg2+ (mg L−1) | 4.9 | 3.5 | 5.5 |
| Ca2+ (mg L−1) | 8.7 | 7 | 14 |
| pH | 6.2 | 5.5 | 6.2 |
- The western peatland data were originally reported in Syed et al. (2006) and represent surface water that was collected on July 30, 2004. Data from the other two sites are from Vitt et al. (1995) and represent surface water collected on July 12, 1989.
Implications and predictions for future changes in NEP
The study site is a moderately rich fen with an open tree canopy and, as noted above, normal vegetation succession in these ecosystems leads to a poor fen and onto a closed canopy dry bog (Kuhry et al., 1993). The transition from rich fen to forested dry bog may require 50–350 years (Kuhry et al., 1993). As the succession occurs and above ground biomass accumulates, there should be an associated increase in respiration and decline in NEP until it reaches a near zero steady state value (Bond-Lamberty et al., 2006; Goulden et al., 2011). After tree canopy closure, annual NEP would probably be more consistent with the long-term average rate of C accumulation in peat, as was the case for mature P. mariana forests in northern Saskatchewan (average NEP for 2000–2006, 56 ± 21 g C m−2 yr−1; Krishnan et al., 2008) and Manitoba [average NEP for 1994–2004, a source of 2 g C m−2 yr−1, with annual NEP values ranging from a maximum source of 84 g C m−2 yr−1 (1996) to a maximum sink of 58 g C m−2 yr−1 (2003); Dunn et al., 2007]. Therefore, in the absence of fire or other major disturbance, significant net C sequestration could continue for decades at this site and help to reduce the positive feedback of climate change on increasing atmospheric CO2 concentration. However, climate change-induced warmer and drier conditions could also increase the risk of fire disturbance, which would release significant amounts of stored C and reset the succession to an early, less productive stage (Turetsky et al., 2002; Amiro et al., 2009; Goulden et al., 2011).
Acknowledgements
This research was undertaken as part of the Fluxnet-Canada Research Network and the Canadian Carbon Program, and was funded by grants to L. B. F. from the Natural Sciences and Engineering Research Council of Canada, the Canadian Foundation for Climate and Atmospheric Sciences and BIOCAP Canada. We thank Peter Carlson, Stephane Ponton and Angela Adkinson for technical help.


