A new tool for determining the optimum fish meal and vegetable meals in diets for maximizing the economic profitability of gilthead sea bream (Sparus aurata, L.) feeding
Abstract
The economic profitability of fish meal replacement by soybean meal and pea-rice concentrate mixture, was analysed considering the economic conversion ratio (ECR) and the economic profit index (EPIst) as a proposal for evaluating the economic profitability in diets for sea bream. The optimal fish meal levels for minimizing the ECR were 33% (when soybean meal was included) and 14% (in the case of pea-rice concentrate mixture) and for maximizing the EPIst, optimal fish meal levels were 31% and 28.8%, respectively, considering the current market price of fish meal and vegetal ingredients. The EPIst, seems to be a better index than the ECR to estimate diet profitability, because it considers weight increment, feed conversion ratio, diet cost and fish sale price. A sensibility analysis was conducted, considering variations in the price of fish meal and vegetal ingredients. Finally, several multiple regressions were developed for estimating the optimal level of fish meal with each vegetable ingredient and the expected value of the economic profit as a function of the market price of both fish meal and plant protein. When fish meal prices increase, the highest beneficial level of the inclusion fish meal and the highest economic profit would be achieved with pea-rice mixture.
Introduction
Aquaculture used 3.06 million of tons of fish meal and 0.78 million of tons of fish oil in 2006, representing 56% and 87%, respectively, of the world total consumption of these products (FAO 2007). The continuous increase of aquaculture production in the world is causing a rise in the demand of fish meal and fish oil, such that the total amount of these products used in aquaculture will increase respectively to 3.6 and 0.84 million tons, in 2012 (Tacon, Hasan & Subasinghe 2006). However, a decrease in the availability is expected to arise in 2020, and fish meal and fish oil used in aquaculture will be approximately 2.38 and 0.71 million tons respectively (Tacon & Metian 2008). Therefore, the best solution to this problem should be aimed at fish meal substitution by alternative protein sources that will reduce costs and improve the sustainability of fish feed, allowing an increase of fish production. According to FAO Globefish (2011) the total fish meal production by the five major producers declined in 2009, following a tendency begun some years ago. Chile is the only country that reported an increase in the production, whereas all the other countries reported lower production. Fish meal prices (FMPs) have been increase for several months, and they will probably continue to increase in the future. China continues to import enormous amounts of fish meal (50% of the total exports worldwide), and its high level demand is the reason for the present price rise. Fish meal prices reached their maximum in 2006 with a price of nearly US$1.380 per tons that has fluctuated since this time. In March 2010, the FMP returned to its maximum value of $1.900/tonne (FAO Globefish 2011).
Consequently, the reduction of the dependence of aquaculture on marine resources in the future will be accomplished by improving feed efficiencies and by the replacement of fish meal by plant products (Gatlin, Barrows, Brown, Dabrowski, Gaylord, Hardy, Herman, Hu, Krogdahl, Nelson, Overturf, Rust, Sealey, Skonberg, Souza, Stone, Wilson & Wurtele 2007). In Europe, the volume of gilthead sea bream (Sparus aurata) production increased considerably in the last several years, which resulted in a diminution of their sale price and therefore a diminution of the production profit. A way to increase profits would be to reduce the costs of feeding, making diets more economical with cheaper raw materials. For this reason, many studies have been carried out on gilthead sea bream fed different protein sources (Robaina, Izquierdo, Moyano, Socorro, Vergara, Montero & Fernández-Palacios 1995; Robaina, Moyano, Izquierdo, Socorro, Vergara & Montero 1997; Alarcón, Moyano & Díaz 1999; Kissil, Lupatsch, Higgs & Hardy 2000; Pereira & Oliva-Teles 2003, 2004; Gómez-Requeni, Mingarro, Calduch-Giner, Medale, Martin, Houlihan, Kaushik & Perez-Sanchez 2004; Sitjà-Bobadilla, Pena-Llopis, Gomez-Requeni, Medale, Kaushik & Perez-Sanchez 2005; De Francesco, Parisi, Pérez-Sánchez, Gómez-Requeni, Médale, Kaushik, Mecatti & Poli 2007; Martínez-Llorens, Moñino, Tomás, Moya, Pla & Jover 2007a; Martínez-Llorens, Tomás, Moñino, Pla & Jover 2007b; Sánchez-Lozano, Tomás-Vidal, Martínez-Llorens, Nogales-Mérida, Espert Blanco, Moñino, Pla & Jover Cerdá 2007; Martínez-Llorens, Tomás, Moñino, Gómez, Pla & Jover 2008; Dias, Conceiçao, Ramalho, Borges, Valente & Dinis 2009; Martínez-Llorens, Tomás, Jauralde, Pla & Jover 2009; Sánchez-Lozano, Martínez-Llorens, Tomás-Vidal & Jover Cerdá 2009) to determine the maximum substitution level of fish meal that does not affect the growth rate and the nutrient efficiency delivered by the diets. However, it would be advisable to consider the maximum substitution level of fish meal from the economic point of view together with fish growth, but few studies focussed on this economic aspect (Martínez-Llorens et al. 2007a; Martínez-Llorens et al. 2007b; Martínez-Llorens et al. 2008; Martínez-Llorens et al. 2009; Sánchez-Lozano et al. 2007). Fish meal replacement was evaluated economically also in other species, such as Nile tilapia, Oreochromis niloticus (Azaza, Wassim, Mensi, Abdelmouleh, Brini & Kraϊem 2009), sharpsnout sea bream, Diplodus puntazzo (Hernández, Martínez, Jover & García García 2007) and Mediterranean yellowtail, Seriola dumerili (Tomás, De la Gandara, García Gómez, Pérez & Jover 2008).
In Table 1, we present a summary of studies considering the effects of the replacement of fish meal in sparids diets on economic parameters such as the economic conversion ratio (ECR) and the economic profit index (EPIst). In general, significant differences for EPI or ECR were not found from analysis of the variance. For this reason, the authors tried to develop a quadratic equation as a function of the inclusion levels for establishing the optimum plant level (or the corresponding minimum fish meal levels) in fish diets by deriving and zeroing the quadratic equation. Using this approach, Sánchez-Lozano et al. (2007) determined an optimum sunflower meal level of 14% (with 51% of fish meal in the diet) for maximizing economic profit. However, these economic parameters are very sensitive to some variables, such as the price of the raw materials or the duration of the trial, hindering comparisons between experiments, but optimum levels for maximizing the EPI can be used.
| Authors Species | CP/CL (%) | Protein source | Fish meal level (%) | Initial weight (g) | Final weight (g) | Dieta cost | ECRb (€ kg−1 fish) | EPIstc (€ fish−1 100 days) |
|---|---|---|---|---|---|---|---|---|
| Hernández et al. (2007) Diplodus puntazzo | 44/15 | Defatted soybean meal | 48 | 195 | 361 a | 0.97 | 1.94 | 0.45 |
| 37 | 331 ab | 0.88 | 1.88 | 0.38 | ||||
| 26 | 340 ab | 0.78 | 1.66 | 0.46 | ||||
| 15 | 320 b | 0.68 | 1.68 | 0.39 | ||||
| Martínez-Llorens et al. (2007a) Sparus aurata | 46/15 | Defatted soybean meal | 37 | 74 | 349 a | 0.87 | 1.84 | 0.33 |
| 31 | 339 a | 0.79 | 1.53 | 0.35 | ||||
| 25 | 324 b | 0.71 | 1.45 | 0.34 | ||||
| 19 | 302 c | 0.62 | 1.21 | 0.35 | ||||
| Sánchez-Lozano et al. (2007; 2009) Sparus aurata | 45/20 | Not dehulled sunflower meal | 57 | 44 | 432 | 1.10 | 2.09 ab | 0.38 b |
| 53 | 455 | 1.04 | 1.78 c | 0.45 c | ||||
| 48 | 427 | 0.99 | 1.85 bc | 0.41 b | ||||
| 43 | 421 | 0.93 | 2.21 a | 0.36 a |
- a Calculated from the following price of ingredients (January 2010): fish meal = 1.38 € kg−1; defatted soybean meal = 0.321 € kg−1; wheat gluten = 0.875 € kg−1; sunflower meal = 0.188€ kg−1; wheat meal = 0.154 € kg−1; gluten meal = 0.161 € kg−1; fish oil = 0.780 € kg−1; soybean oil = 0.645 € kg−1; maltodextrin = 2.00 € kg−1; vit-min mix = 7.50 € kg−1.
- b Economic conversion ratio, ECR = feed offered (kg) × feed cost (€ kg −1)/weight gain (kg).
- c Economic profit index (€ fish−1 and 100 days), EPIst, = weight increase (kg)/days of trial × (fish sale price (€ kg −1) – ECR (€ kg −1 fish)) × 100. Sea bream sale price was calculated at 4.5 € kg −1.
- d Data in the same column with different letters (a,b,c) differ at the P < 0.05 level.
Therefore, the current study was aimed at determining and comparing the economic profit of gilthead sea bream that were fed different plant protein sources (replacing fish meal in their extruded diets) and at carrying out a sensitivity analysis to determine the effect of the fluctuation of the prices of fish meal and the alternative protein source on the economic parameters related to optimizing fish meal dietary level (FML).
Materials and methods
Rearing system, fish and diets
Growth data from two previous independent trials that we ran were used as the basis for calculating the ECR and EPI as well as for estimating the optimum plant protein ingredients from an economic point of view.
The two independent growth trials were conducted in cylindrical fibre tanks (1500 L) that were set up in a recirculating marine water system (30 m3 capacity) with a drum filter and a gravity biofiltre of approximately 6 m3 capacity.
In trial 1, a group of gilthead sea bream (S. aurata) of 200 g mean weight were distributed (35 fish per 14 tanks). Six isonitrogenous (45% CP) and isoenergetic diets 23 MJ kg−1 GE were formulated using commercial ingredients (Table 2), in which defatted soybean meal were included in diets containing 46%, 37%, 29%, 20%, 11% and 2% of fish meal (diets SB46, SB37, SB29, SB20, SB11 and SB2 respectively (Martínez-Llorens et al. 2009).
The six diets were assayed in duplicated groups over 134 days. Water temperature was 22.3 ± 1.1°C, and dissolved oxygen was 6.5 ± 0.5 mg L−1.
| Ingredients (g kg−1) | Trial 1: Soybean meal | Trial 2: Pea-rice mix | ||||||||
|---|---|---|---|---|---|---|---|---|---|---|
| S46 | SB37 | SB29 | SB20 | SB11 | SB2 | PR61 | PR42 | PR23 | PR4 | |
| Fish meal, herring (5-02-000) | 464 | 374 | 286 | 198 | 109 | 16 | 609 | 421 | 233 | 45 |
| Extracted soybean (5-04-604) | 132 | 263 | 395 | 526 | 658 | |||||
| Pea protein meal 75% CP | 82 | 164 | 246 | |||||||
| Rice protein meal | 110 | 219 | 329 | |||||||
| Wheat meal (4-05-268) | 244 | 195 | 144 | 93 | 44 | 196 | 178 | 161 | 142 | |
| Wheat gluten | 100 | 100 | 100 | 100 | 100 | 100 | ||||
| Fish oil (7-08-048) | 81 | 83 | 86 | 89 | 91 | 93 | 95 | 104 | 113 | 122 |
| Soybean oil (4-07-983) | 81 | 84 | 87 | 89 | 92 | 93 | 40 | 40 | 40 | 40 |
| Methionine | 1 | 2 | 3 | 4 | 5 | 1 | 2 | 3 | ||
| Lysine | 1 | 2 | 3 | 4 | 5 | 4 | 8 | 13 | ||
| Maltodextrin | 20 | 20 | 20 | 20 | 20 | 20 | 50 | 50 | 50 | 50 |
| Vitamin-mineral mix | 10 | 10 | 10 | 10 | 10 | 10 | 10 | 10 | 10 | 10 |
| Analysed composition (% dry matter) | ||||||||||
| Dry matter | 92.8 | 93.0 | 92.3 | 91.3 | 91.6 | 90.3 | 87.9 | 88.9 | 88.6 | 89.3 |
| CP | 44.4 | 44.1 | 45.0 | 45.8 | 45.5 | 45.9 | 48.4 | 48.9 | 49.0 | 48.9 |
| Crude lipids | 22.0 | 20.2 | 20.6 | 20.7 | 21.2 | 21.1 | 17.4 | 18.1 | 18.1 | 20.7 |
| Ash | 9.3 | 8.8 | 8.0 | 7.2 | 6.3 | 5.5 | 9.8 | 8.3 | 5.6 | 3.9 |
| Crude fibre | 1.3 | 1.8 | 2.3 | 2.8 | 3.4 | 3.9 | 1.3 | 1.7 | 2.1 | 2.5 |
| Gross energy (kJ g−1) | 23.4 | 23.0 | 23.2 | 23.2 | 23.5 | 23.5 | 22.2 | 21.7 | 23.0 | 24.4 |
- a CP, Crude protein
Trial 2 started with 235 fish with an initial average fish weight of 174 g. The fish were randomly distributed in 12 experimental tanks. Four isonitrogenous (48% CP) and isoenergetic extruded diets (23 MJ kg−1) were formulated (Table 2) substituting 0%, 30%, 60% and 90% of fish meal protein by a homogeneous mixture of pea protein concentrate meal and rice protein concentrate meal. The diets contained 61%, 42%, 23% and 4% of fish meal (diets PR61, PR42, PR23 and PR4 respectively). The four diets were assayed in triplicate groups over 80 days (Sánchez-Lozano et al. 2009). During the experiment, the temperature was 22.5 ± 1°C and dissolved oxygen was over 6 mg L−1.
Economic analysis
 (1)
(1)The price of each diet was determined by multiplying the respective contributions of each feed ingredient by their respective costs per kg and summing the values obtained for all of the ingredients in each of the formulated diets. The price of each ingredient (January 2010) was as follows: fish meal = 1.38 € kg−1; defatted soybean meal = 0.321 € kg−1; wheat gluten = 0.875 € kg−1; sunflower meal = 0.188€ kg−1; rice protein concentrate = 0.704 € kg−1; pea protein concentrate (75% Crude Protein, CP) = 0.73 € kg−1; wheat meal = 0.154 € kg−1; gluten meal = 0.161 € kg−1; fish oil = 0.780 € kg−1; soybean oil = 0.645 € kg−1; maltodextrin = 2.00 € kg−1; methionine = 4.193 € kg−1; lysine = 2.139€ kg−1; and vit-min mix = 7.50 € kg−1. (Globefish Highlights, 2010, Instituto Técnico y de Gestión Ganadero S.A 2010 and Official FOB prices, Instituto Técnico y de Gestión Ganadero S.A 2010).
 (2)
(2) (3)
(3)The gilthead sea bream sale price was calculated at 4.5 € kg −1.
Statistical analysis and optimum plant protein level estimation
Statistical analyses of data were carried out using SAS (Statistical Analysis System Institute, 1990). Data from the ECR and EPIst were subjected to variance analysis according to the general lineal procedure. However, data on weight increase and the thermal coefficient of growth (TGC) were analysed using a mixed procedure according to a repeated measures design that takes into account the variation between animals and covariation within them. Covariance structures of the mixed procedure were objectively compared using the most severe criteria (Schwarz Bayesian criterion), as was suggested by Littell, Henry and Ammerman (1998). Each group in the calculation represented the combined group of fish per single tank (duplicate tank per treatment). The P-value for statistical significance was 0.05. Descriptive statistics are mean ± SE, unless otherwise noted.
In addition, the ECR and standardized economic profit index (EPIst) were assessed by second-order polynomial regression analysis using the dietary fish meal level as an independent variable.
The obtained regression equations allowed the estimation of FML that minimized ECR or maximized EPIst by deriving and FML in each derived equation, equalized to zero.
After obtaining the fish meal levels that minimized the ECR and maximized the EPIst with the current ingredient market prices, new calculations were performed considering variations in fish meal and plant protein prices. For economic simulation, a range price within the market variations provided for fish and plant protein meals were used. For each combination of vegetable and FMPs, the optimum fish meal dietary level was obtained for maximizing the EPIst, and consequently, both response surfaces were drawn for each trial. Likewise, the maximum EPIst value obtained with these optimum FML was drawn in function of fish and vegetables meals market price. Finally, the relationship between the fish maximum EPIst and fish meal and plant protein price was assessed using multiple regression analysis; the R2 statistic was employed to indicate that the model, as fitted, explains the percentage of the variability in the dependent variables.
Results
In all trials, the survival was around 90% and no significant differences were shown among treatments in fish survival.
Growth, feed intake (FI) and feed conversion ratio were affected by the dietary treatment over the course of the trial 1 (Martínez-Llorens et al. 2009). Fish fed diets SB46, SB37, SB29 and SB20 showed a similar final weight (422, 422, 438 and 422 g respectively) but fish fed diets SB11 and SB2 obtained the lowest final weight (385 and 333 g respectively) although TGC only was different for fish fed diet SB2. Likewise, the fish fed diet SB11 and SB2 also obtained the highest feed conversion ratio (3.6 and 4.6).
In case of trial 2, the fish grew from 174 g to 372, 367, 364 and 326 g, in fish fed diets PR61, PR42, PR23 and PR4, but differences were significant only for PR4 diet. Significant differences were not found in FI ratio, which was around 1.70–1.96 g 100 g fish−1day−1, feed conversion ratio, around 1.9–2.4 and protein efficiency ratio, from 0.96 to 1.2 (Sánchez-Lozano, Martínez-Llorens, Tomás-Vidal & Jover Cerdá 2011).
The dietary inclusion of alternative vegetable ingredients had a significant effect on fish weight gain (WG) and the TGC for the two trials (Table 3), because only the highest plant protein level in each trial (diet SB2 in trial 1 and diet PR4 in trial 2) caused decreased growth, but there were not significant differences between the other diets. Additional details for growth performance and feed efficiency data have been presented by Martínez-Llorens et al. (2009) and Sánchez-Lozano et al. (2009).
| Parameters | |||||||
|---|---|---|---|---|---|---|---|
| Initial weight (g) | Weight gain a (%) | TGCb× 10−03 | Cost diet (€ kg−1) c | ECRd(€ kg−1 fish) | EPIste(€ fish−1 100 days) | ||
| Trial 1: Soybean meal | SB46 | 246 | 75 a | 0.891 a | 0.99 | 2.25 ab | 0.30 b |
| SB37 | 240 | 76 a | 0.913 a | 0.91 | 2.04 a | 0.33 ab | |
| SB29 | 237 | 83 a | 0.977 a | 0.84 | 2.06 a | 0.36 a | |
| SB20 | 238 | 76 a | 0.908 a | 0.76 | 2.11 a | 0.32 ab | |
| SB11 | 242 | 61 a | 0.747 a | 0.68 | 2.44 b | 0.22 c | |
| SB2 | 240 | 38 b | 0.501 b | 0.60 | 2.74 c | 0.12 d | |
| SEM | 5.1 | 4.1 | 5.5 10−05 | 0.06 | 0.01 | ||
| Trial 2: Pea-rice mixture | PR61 | 174 | 117 a | 2.05 a | 1.15 | 2.75 a | 0.43 |
| PR42 | 176 | 116 a | 2.02 a | 1.04 | 2.37 ab | 0.51 | |
| PR23 | 171 | 112 a | 1.98 a | 0.93 | 1.79 b | 0.64 | |
| PR4 | 177 | 87 b | 1.64 b | 0.83 | 1.99 b | 0.48 | |
| SEM | 21.5 | 4.2 | 5.48 10−05 | 0.16 | 0.05 | ||
- Means of duplicate (Trial 1) and triplicate groups (Trial 2). Mean values in the same column with different letters are significantly different (P < 0.05).
- Covariate initial weight.
- a Weight gain, WG (%) = (final weight − initial weight) × 100/initial weight.
- b Thermal growth coefficient, TGC = (final weight(1/3) − initial weight(1/3))/[days × Σ(T−ET)].
- ET = Effective temperature for sea bream was considered 12°C.
- c Calculated from the following price of ingredients (January 2010): fish meal = 1.38 € kg−1; defatted soybean meal = 0.321 € kg−1; rice protein concentrate = 0.704 € kg−1; pea protein concentrate (75% CP) = 0.73 € kg−1; wheat gluten = 0.875 € kg-1; wheat meal = 0.154 € kg−1; fish oil = 0.780 € kg−1; soybean oil = 0.645 € kg−1; maltodextrin = 2.00 € kg−1; methionine = 4.193 € kg−1; lysine = 2.139€ kg−1; vit-min mix = 7.50 € kg−1.
- d Economic conversion ratio, ECR = feed offered (kg) × feed cost (€ kg −1)/weight gain (kg).
- e Standard economic profit index (€ fish−1 and 100 days), EPIst = weight increase (kg)/days of trial × (fish sale price (€ kg−1) − ECR (€ kg−1 fish)) × 100. Sea bream sale price was calculated at 4.5 € kg−1.
The price of diets was reduced by plant protein inclusion. Considering all trials, the level of dietary fish meal affected the price of diets such that the diets in trial 1 (soybean meal) were more economical than diets formulated in trial 2 (pea-rice mixture). For the ECR, significant differences were observed in all trials (Table 3). In trial 1, the diet containing 1.6% of fish meal (SB2) resulted in the highest ECR (2.74 € kg−1 fish), followed by fish fed diet SB11 (2.44 € kg−1 fish), but no differences were observed for diets SB46, SB37, SB29 and SB20 (2.25, 2.04, 2.06 and 2.11 € kg−1 fish respectively). Nevertheless, a quadratic relationship [Eqn 4] was observed between the ECR and dietary fish meal level (FMLSB). The quadratic regression analysis employed was that recommended by Shearer (2000), because it can be used to obtain optimum levels of ingredients or nutrients.
 (4)
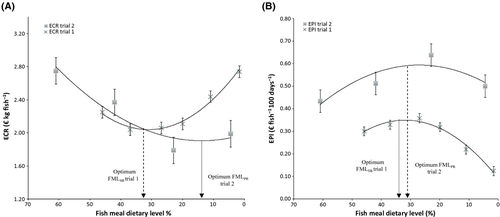
(4)When Eqn 4 is derived and equalized to zero, it is possible to obtain the dietary fish meal level that minimized the ECR, resulting in a level of 33% fish meal (Fig. 1A).

On the other hand, when fish meal was replaced by a pea-rice mix (trial 2), the ECR was significantly lower in fish fed diets PR23 and PR4 (1.79 and 1.99 € kg−1 fish respectively) than in fish fed diet PR61 (2.75). A quadratic relationship [Eqn 5] was also observed between the ECR and dietary fish meal level (FMLPR).
 (5)
(5)The optimum fish meal level for minimizing the ECR [when Eqn (5 is derived and equalled to zero] was 14% (Fig. 1A).
 (6)
(6) (7)
(7)The optimal fish meal levels for maximizing the EPIst were 31.3%, 28.9% for trial 1 and trial 2 respectively (Fig. 1B).
Figure 1 shows that the fish meal optimal levels for maximizing the EPIst are very similar in both trials. However, the optimal fish meal levels for minimizing the ECR are highly variable. For this reason, the sensibility analysis of the fish meal levels, considering the variation of proteins meals price (from 200 to 900 € tm−1) and the FMP (from 800 to 2000 € tm−1) was only made in the case of the optimal EPIst.
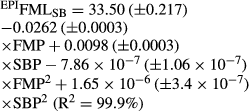
Equations 8 and 9 show the results of fitting multiple linear regression models to describe the relationship between fish meal level for the maximum EPIst (EPIFMLSB and EPIFMLPR for trial 1 and 2 respectively) and FMP and plant protein prices (SBP and PRP respectively) as independent variables.
 (8)
(8)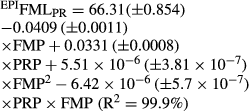 (9)
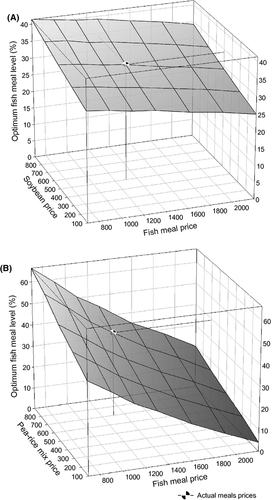
(9)Figure 2 (A and B) shows the response surface of the optimum FML for maximizing EPIst related to Eqns 8 and 9 for each combination of FMP and vegetable protein price. The optimal levels of fish meal dietary inclusion to maximize the EPIst diminished in both trials when the FMP increased and vegetal protein prices decreased, but the effect is higher in trial 2 than in trial 1 (see slope of plans in the figures).
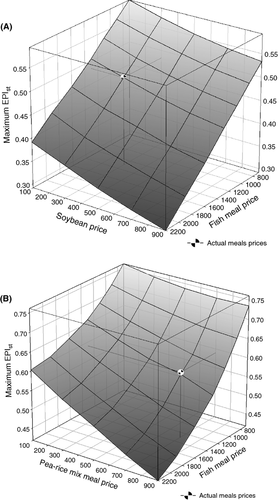
Finally, two multiple equations have been developed [Eqns 10 and 11] for estimating the EPIst values originated from the optimum dietary level of fish meal in each trial for different combinations of fish meal and vegetable ingredients prices. Response surfaces are represented in Fig. 3 (A and B). The EPIst for the optimum fish meal level diminished with the increase of FMP and vegetable protein price.
 (10)
(10)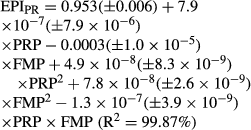 (11)
(11)Discussion
The minimum levels of fish meal inclusion in extruded diets for gilthead sea bream varies considerably in function of the raw material employed (Kissil et al. 2000; Pereira & Oliva-Teles 2003 and Pereira & Oliva-Teles 2004; Bonaldo, Roem, Fagioli, Pecchini, Cipollini & Gatta 2008; Dias et al. 2009) and the fish weight (Martínez-Llorens et al. 2007a; Martínez-Llorens et al. 2007b). In previous studies, the fish meal level was recommended including 31% without essential amino acids (EAA) supplementation (Martínez-Llorens et al. 2007a) when defatted soybean meal was used as substitute, or 27% of dietary fish meal with EAA supplementation (Martínez-Llorens et al. 2009). Regarding other vegetable proteins, previous researches recommended 53% of dietary fish meal when it was replaced by sunflower meal (Sánchez-Lozano et al. 2007), 18% of fish meal by a vegetable mixture with EAA (Sitjà-Bobadilla et al. 2005; De Francesco et al. 2007), 23% of fish meal when replaced by a pea and rice concentrate mixture with EAA (Sánchez-Lozano et al. 2009) or 10.5% fish meal (plus 2.5% of CPSP) when replaced by a vegetable mixture with EAA (Dias et al. 2009) or 33% by pea concentrate (Sánchez-Lozano et al.2011). It seems evident that the best results have been obtained with vegetable mixtures supplemented with EAA, instead of a single ingredient.
From the sustainable point of view, other parameters as “fish in: fish-out ratio” has been introduced recently to evaluated a protein source (Jackson 2009), that considers the amount fish meal for wild fish to produce 1 kg of fish; nevertheless this index does not consider the economic aspect. However, some of these vegetable mixtures contain very expensive ingredients, such as pea and rice concentrate or wheat gluten meal, and the diet cost could be similar to using fish meal, therefore the economic evaluation is fundamental to determine the optimum vegetable dietary level for improving the profitability of fish feeding.
Plant based ingredients have very different physical properties to fishmeal during the extrusion process which could affects directly on texture, hydrostability, uniformity, productive capacity (extrusion), feasibility (cost) and mainly its nutritional quality. Also, the vegetal proteins as a protein source in the case of wheat gluten and pea meal are not only a protein source but also are binder agent, allowing the reduction or exemption of synthetic binders which may influence the cost of producing these feeds compared with high fishmeal containing feeds.
Overall, the inclusion of vegetable protein in substitution of fish meal in diets improves the economic indexes although the dietary fish meal levels depend on many factors, such as the index considered, the vegetable protein and the fish species. Results from the current work clearly show that the optimum fish meal level can be different, as a function of which parameter is considered, ECR or EPIst, for which the fish meal levels. However, considering the current price of ingredients, the optimum FML for maximizing the EPIst was very similar for the two considered vegetable proteins, 31% and 28.8% for trial 1 (soybean meal) and trial 2 (pea-rice mixture) respectively. The ECR seems to be highly dependent on diet price, and so we conclude that EPIst, is a better index than ECR to estimate diet profitability, because EPIst, considers WG, diet cost and fish sale price.
Comparing our results with previous studies, similar results were obtained by Martínez-Llorens et al. (2007a), who reported a 35% of FML (substituted by soybean meal) for achieving the maximum EPI, but when fish meal was partially replaced by defatted sunflower meal (Sánchez-Lozano et al. 2007), optimum fish meal level for maximizing the EPIst was higher (52%).
From Fig. 2 and Eqns 8 and 9, it can be observed that the optimum dietary fish meal level for maximizing the EPIst (EPIFMLSB and EPIFMLPR) decreases linearly with the FMP, and it increases linearly with the vegetable protein price.
Values of the optimum fish meal dietary (minimum level) for each vegetable ingredient (EPISB and EPIPR) show a negative response to the FMP in the two trials [Fig. 3, from Eqns 10 and 11]. It was observed that when FMP is low, the vegetal meals price does not influence the optimal values of the EPISB and EPIPR. However, for high values of FMP, the EPISB and EPIPR increase considerably with the diminution of vegetal meal prices. Likewise, Fig. 3 shows that the effect of FMP on the EPISB and EPIPR are higher when the vegetable meal prices are higher.
Although it is difficult to compare the results of different trials, it seems that the best EPIst was obtained with the mixture of pea and rice concentrate (between 0.43 and 0.64 € fish−1 and 100 days) (Fig. 3B) than soybean meal alone (0.32–0.36 € fish−1 and 100 days). By estimating EPIst values from others experiments, these results agree with results cited by Dias et al. (2009), who obtained very good results with a very lower fish meal level (10.5% plus 2.5% of CPSP) when this was replaced by a vegetable mixture, and they achieved a good EPIst (0.47–0.51 € fish−1 100 days−1). De Francesco et al. (2007) obtained good growth results with a vegetable mixture, but their EPIst values were lower (0.17–0.20 € fish−1 100 days−1), as calculated using current price of ingredients.
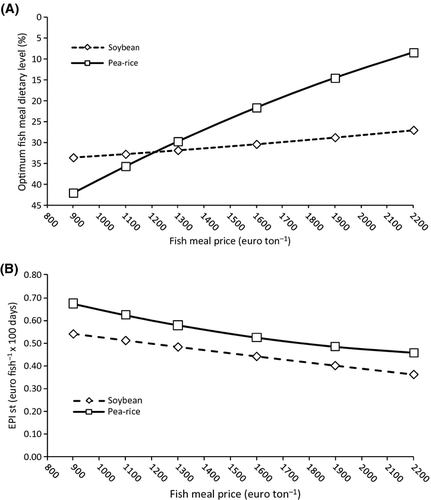
Equations 8, 9, 10 and 11 are good tools for feed companies for carrying out simulations as a function of varying FMPs and vegetable ingredients. Several scenarios of market prices could be considered for estimating the optimal dietary levels of vegetable ingredients for maximizing the EPIst. Thus, if FMP increased from the current level of 1300–1400 € ton−1 to 1600 € ton−1 (maintaining the vegetable product price in 300 € ton−1), the fish meal optimal dietary levels for soybean meal and pea-rice mixture as substitutes would be 30% and 21%, respectively, but they would be 29% and 15%, respectively, if the FMP was 1900 € ton−1 (Fig. 4A). In these scenarios, the EPIst for minimum fish meal dietary level for soybean meal and pea-rice mixture, respectively, would be 0.44 and 0.52 € fish−1 and 100 days−1 for 1,600 € ton−1, and it would be 0.40 and 0.48 € fish−1 and 100 days−1 for 1,900 € ton−1 (Fig. 4B). When FMP increased in 40%, EPIst only decreased in 15% if an optimum vegetable and fish meal dietary level is used. From a sustainability point of view, pea-rice mixture would present the most promising alternative as a vegetable protein source, because its beneficial dietary inclusion level was the highest, but in addition, from an economic point of view, the most profitable vegetable source also would be the pea-rice mixture, because it had the highest EPIst value.
Conclusion
The optimum (minimum) dietary fish meal levels when it is substituted by vegetable ingredients to produce maximum profit should be determined using economic indexes for optimizing profits. The methodology we have developed in the current work establishes a practical tool that would allow the design of profitable diets for aquaculture production as a function of market prices for both vegetable ingredients and fish meal.
Acknowledgments
Elsevier Language Editing Services has revised this manuscript. This work was financed with the support of Generalitat Valenciana (GV/2010/046).


