Digital morphology in hematology diagnosis and education: The experience of the European LeukemiaNet WP10
Abstract
Hematological diagnostics is based on increasingly precise techniques of cellular and molecular analysis. The correct interpretation of the blood and bone marrow smears observed under an optical microscope still represents a cornerstone. Precise quantitative and qualitative cytomorphological criteria have recently been codified by up-to-date guidelines for diagnosing hematopoietic neoplasms. Morphological analysis has found formidable support in digital reproduction techniques, which have simplified the circulation of images for educational or consultation purposes. From 2007 to 2019, the Working Group WP10 of European LeukemiaNet (ELN) used, in annual exercises, digital images to support training in cytomorphology and verify harmonization and comparability in the interpretation of blood and bone marrow smears. We describe the design, development, and results of this program, which had 741 participants in-person or remotely, to which 2055 questions were submitted regarding the interpretation of cytomorphological images. We initially used circulation and presentation of digital microphotographs and then introduced a virtual microscopy (VM). Virtual slides were obtained using a whole slide imaging technique, similar to the one largely used in histopathology, to produce digitized scans of consecutive microscopic fields and reassembles them to obtain a complete virtual smear by stitching. Participants were required to identify cells in labeled fields of view of the virtual slides to obtain a morphological diagnosis. This work has demonstrated substantial improvements in diagnostic accuracy and harmonization with the VM technique. Between-observer concordance increased from 62.5% to 83.0%. The integrity of the digitalized film image, which provides a general context for cell abnormalities, was the main factor for this outcome.
1 INTRODUCTION
The correct identification and counting of blood cells under an optical microscope (OM) on smears of peripheral blood (PB) and bone marrow aspirates (BMA) remains an essential diagnostic criterion in the diagnostic definition and the follow-up of hematological neoplasms with particular relevance in myeloid forms.1, 2 The quantitative and qualitative microscopic diagnostic criteria of the FAB classification were implemented, updated, and integrated into the first Edition of the WHO classification of hematopoietic neoplasms and confirmed in a subsequent Edition.3 In particular, precise quantitative and qualitative criteria have been defined: (i) for blasts, with precise indications on morphological and cytochemical aspects and the minimum value necessary for the definition of acute leukemia, and (ii) for the definition of dysplasia, with precise indications on the morphological criteria for each myeloid lineage and the minimum value necessary for the definition of lineage dysplasia. Moreover, quantitative criteria for the definition of lineage dysplasia should be different depending on the context, myelodysplastic syndromes (MDS) versus acute myeloid leukemia (AML) with dysplastic-related changes,4 the threshold being 10% and 50%, respectively.
OM remains the reference method for the quantitative and qualitative analysis of hematological cells on PB and BMA smears today. The lack of a harmonized standardization of the preparation and staining techniques of the preparations to be examined under the microscope, the difference in identifying nomenclature of the blood cells, the variability in the methodological approach,5 and the subjectivity due to the level of individual skill and experience under the microscope, are aspects that contribute to limiting its diagnostic effectiveness.6, 7 International harmonization projects on blood cell morphology are carried out by several groups such as The Working Group on Morphology of Myelodysplastic Syndrome (ISWMDS)8-13 and the European Leukemianet WP10.14 Despite the availability of international guidelines and operational standards provided by the World Health Organization (WHO), the International Council for Standardization in Haematology (ICSH)15-18 and the Clinical and Laboratory Standard Institute (CLSI),19 inter-operator variability remains a crucial point20 that requires the need to activate further training and harmonization processes between groups.
The digital morphology applied to hematology is based on the presentation to the user of digitized images of hematological cells, previously acquired and preserved from PB and BMA smears. Starting from the ‘60s, this technology has substantially developed and evolved throughout heterogeneous approaches in a few years.21, 22 The first step was to take cell images at different enlargements with a camera applied to the OM and digitize them in .jpg or similar format. The chance of rapid and immediate circulation of large quantities of digital cellular images in the network, also by using cellular phones, has greatly favored consultation, training, and intra-observer harmonization. The final image available on a computer screen, corresponding to microscope fields or single cells, can be easily moved, zoomed, and focused using the computer mouse. Areas or cells of interest can be marked or identified for easy retrieval.
The development of artificial intelligence (AI)-based systems, mainly of its subsets named Learning machine and deep-learning, and their application and integration with hematology flow cytometers available in the laboratories for PB differential, has brought about a real revolution in the peripheral blood reporting process.23, 24 PB samples showing abnormal cytograms or quantitative and qualitative flags are analyzed by classifier systems on the scanned zone of smears in a short time. Digital images of PB cells, captured in sequence, are displayed on a computer screen, grouped in cell subtypes, and enumerated. The examiner can confirm the proposed differential, move cells in the appropriate cell subtype, eliminate or reclassify individual cells by moving them to a different, more appropriate, subtype, or decide to evaluate the smears under OM to produce the manual differential as the final validated report.
As a result of the different commercial or experimental products and increasingly diversified availability of pre-classifying systems for PB cells, many scientific papers on the analysis and validation of the different systems and comparison/concordances of different technologies, using the OM as a reference system, are currently available in the recent literature as far as the differential leukocyte count of normal and abnormal PB smears is concerned.25, 26 Valuable studies have assessed the performance of these classifier systems on identifying morphologic abnormalities of red blood cells (RBC)27 and platelets (PLT),28 as well as on the detection of parasites and cellular analysis of body fluids.
In 2019 the ICSH published a list of the digital morphology analyzers available in hematology, with technical specifications and recommendations for their application to the hematological diagnosis.29 In particular, digital morphology analyzers can be used in the reclassification and possible validation of PB samples flagged by automated cell counter results, but “a skilled morphologist remains essential for cell reclassification and diagnostic interpretation of the blood cells” in such a process. The ICSH document also lists situations in which OM review is recommended. Advantages of the automated digital analyzer compared to the OM slide review include remote review, easy retrieval, reduction of fatigue, costs, number of slide reviews at the OM, and facilitation of intra-laboratory morphology education, harmonization, and improved peer-reviewing.
Since about 70 years now, it is possible to obtain digitized cell images using an OM and a digital camera. Such technology, named whole slide imaging (WSI) technology, or Virtual Microscope (VM) is based on the acquisition of digital images from sequentially scanning an entire glass slide digitally within a few minutes The development, application, and diffusion of WSI have primarily involved histopathological slides which only require low magnification objectives (up to 40×), unlike hematology PB and BM smears which require much higher magnifications of up to 100× oil immersion objectives. Routine WSI application and exemplary performance in histopathology are well documented.30, 31 Standardization problems were immediately identified and addressed.32 In 2013, The College of American Pathologists (CAP) provided users with specific Guidelines.33 In 2015, the Food and Drug Administration (FDA) and the International Color Consortium (ICC) published a consensus report on color in medical imaging, and the image standardization process is on the way.34, 35 On the other hand, hematology virtual slides were usually confined to a small area of the glass slide, typically representing only a small fraction of the area of a whole glass slide.
VM in hematology is mainly used in education and training activities, quality control programs, and proficiency testing.36-38 In the recent years, on the other hand, the application of some WSI method, thanks to technological improvements, has been extended to hematological preparations.39 WSI in hematology is not currently validated for clinical diagnostic utilization and is still in an initial phase: the technologies are expensive, and the acquisition, transmission, and sharing processes are still too slow for routine use. The main critical issues are the lack of image standardization in acquisition, color, size, and resolution. Diagnostic equivalence with glass smears requires improvements in all these areas. We describe here our experience with the use of virtual slides obtained using one of the first application of WSI-based VM in the context of a European LeukemiaNet (ELN) Working Group.
2 MATERIALS AND METHODS
2.1 Description of the study
The ELN (https://www.leukemia-net.org/) is a network of excellence. It includes 194 Participating Centers from 39 Countries, including Switzerland, Israel, Lebanon, the USA, and Russia. It aims to strengthen and develop scientific and technological excellence in research, diagnosis, and therapy of leukemia, favoring integration of interdisciplinary partner groups. Physicians and scientists of the network take care of about 10 000 patients. The ELN Working Package 10 (WP10) subgroup focuses on morphology and flow-cytometry diagnosis. We report here the results of over 10 years of international educational morphological workups, with particular emphasis on evaluating the concordances rate of cell identification and possible changes in agreement related to the different medial support used in subsequent exercises. In the final considerations, the possible clinical diagnostic impact of WSI is also evaluated.
Regardless of the type of medial support, photography, or scan, all images come from PB and BMA smears that were spread manually, then fixed and stained according to the May-Grünwald-Giemsa method. When necessary to evaluate morphologically more complex cases, images from preparations of the same patient stained with cytochemistry for myeloperoxidase, esterases, toluidine blue and/or Perls stain, were also made available. Digital .jpg and .tiff images were taken from PB and BMA smears using a Zeiss Axioplan digital camera mounted on a Zeiss Axioplan 2 OM at 50× and 100× magnification.
2.2 Virtual slide preparation
On the PB and BMA smears prepared for OM analysis, in the last years of the study, virtual digital images were systematically taken over multiple focal planes on a pre-selected area and translated into large image files. We used the Metafer4 VSlide Scanning System (by MetaSystems Hard & Software GmbH, Robert-Bosch-Str. 6 68 804 Altlussheim), which can digitize entire smears, or part of them, at 40× oil objective. An entire smear can be digitized in around 30–45 min (with a digital resolution of 0.16 μm/px). Image compression is obtained by lossless compressed RAW, for a final size between 500 and 1000 MB (according to the actual number of scanned Fields of View, or FOVs, see below).40
In average, we digitize an area of around one third of a smear, that consists of an area of around 150–300 mm2. The camera sensor has a resolution of 1360 px × 1024 px, therefore one FOV is covering an area of 2176 μm × 163 84 μm. A dedicated software places the image files of single points acquired from different focal planes, side by side, respecting the original position on the slide. A composite digital image of the entire previously selected area, suitable for viewing on a computer screen, is generated. This virtual slide can be easily navigated (panning & zooming) through a dedicated viewer, like in histopathology, with the possibility to add annotations/measurements/points of interest directly on the image level (Figure 1).
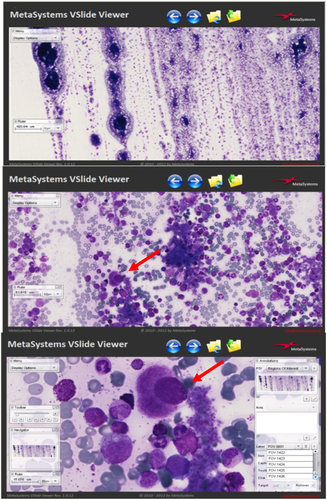
The computer mouse allows operators to manage the final images the same way as when using the OM. The entire scanned area can be inspected at low magnification and for selecting a smear zone. The operator can select the appropriate magnification and focus cells in specifically labeled FOVs for the morphological evaluation (Figures 2 and 3).
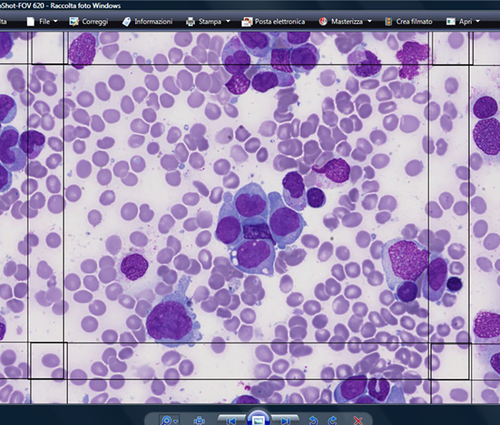
The morphologic exercises were placed online on a dedicated platform, usually during the second half of the year, and remained available for 3 months. Bibliographic references to international guidelines were also provided in order to harmonize nomenclature and morphological assessment criteria. All images, anonymously collected, were taken and acquired from smears that had been used in the routine diagnostic pathway and clinical follow-up of patients from our institution. As the exercises were aimed at colleagues professionally oriented towards morphological insights, exercises with a medium-high difficulty level have always been proposed. Particular attention has been placed on relevant morphological aspects, such as the identification and quantification of dysplasia and blasts (35% of questions), and on the morphological criteria of so-called “difficult cells” such as elements of the monocytic and lymphoid series (27% of questions).
The results of all these educational activities carried out both online and in-person, using digital images and WSI scans, were collected anonymously in Excel files and evaluated in terms of agreement and concordance. Elementary statistical data analysis was carried out by using @MedCalc software.
3 RESULTS
In the context of the ELN WP10, dedicated to morphology and flow cytometry diagnosis, the morphology group has actively worked from 2007 to 2019 to achieve morphologic consensus statements, taking into account individual practices, collegial agreement, and literature data.
We published the results of the first morphological exercise in 2010.14 The exercise was based on the analysis of 164 images containing 438 labeled cells in digital (.jpg or .tiff format), blindly submitted to a group of 28 experts from 17 countries. Subsequently, until 2019 online morphologic workups have been carried out with a yearly frequency, using an online dedicate platform (www.bloodcelltraining.com, currently inactive). Every year in February, during the ELN annual Symposium, results of the previous year's exercise were reported. The current year's subsequent exercise was publicized, and discrepancies in morphological assessments were discussed. Further information was also made available during the year on other international and national hematological scientific events. Participation was voluntary and free. To join, the participant had to send her/his expression of interest by email: a reply email was sent by ELN WP10, containing credentials to access the dedicated platform, the start and end date of the exercise, and instructions for the platform use. Information about age, gender, and current job position (student/graduate in training/graduate working in the laboratory or clinic/other to be specified) were required. Each participant had to fulfill the final questionnaire focused on specific morphologic aspects of the submitted cases. Each yearly online exercise included four to six clinical cases. For each case, multiple choice questions were provided concerning both the quantitative and qualitative image evaluation and a specific request for individual cell identification. A tiny free text box was available for participants' comments if any. In the last years, the online exercises were performed using VM with the WSI method and a request for a mandatory participant decision on the morphological diagnosis of the case was added.
Participants' responses were globally evaluated, and feedback was sent in terms of individual results compared to the average of the results of other participants. Agreement on a specific morphological diagnosis was considered appropriate when consensus within the group included more than 50% of participants.
The images of the hematological cells of the exercises proposed from 2007 to 2011 were provided in .jpg or .tiff format. In these cases the number of identifiable cells varied according to the microscopic magnification. Microphotographs capture an area of about 40% of the whole optical microscope field. From 2012, the proposed format was the WSI. In particular, participants were provided with selected areas of scanned PB and BMA smears containing 1500 FOV.
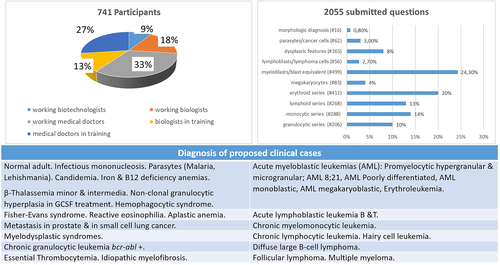
Over the years, the number of applications for membership from all parts of the world has increased incrementally, confirming the validity of these initiatives for the user's needs. Morphological cases of patients with clonal and non-clonal hematological diseases were selected based on the final diagnosis, following the national and international diagnostic protocols (Figure 3). In order to offer participants a wide range of morphological features, particular attention was paid to limit duplicate diagnoses.
Moreover, since 2013, as part of a collaboration between the ELN WP and the European Association of Hematology (EHA), the Morphology and Cytometry Scientific Working Group (SWG) has been formed. During seven SWG in presence sessions, slides with digital microphotographs with a series of questions on morphology were presented and anonymously recorded.
The total number of participants in morphological workups was 741. Compared to the first exercise published in 2010,14 in which senior experts participated, the users were primarily in-training medical doctors, pathologists, biologists, and technologists. The total of questions submitted over the years was 2055. Out of them, 2039 focused on cell identification and 16 on the final morphologic diagnosis. We evaluated the agreement within the group of attendees for each question in the same morphologic exercise. Figure 3 reports the distribution of the professional categories of attendees and the distribution of the submitted questions and cells, together with a list of diagnoses of the patients whose samples were prepared for all the exercises.
According to session modality, participants in sessions based on digital images were further splitted into two groups (63 exercises by remote and 53 exercises in presence, respectively). The number of questions in face-to-face sessions, being time-dependent, was smaller. As it could have been predicted, the performance in identifying cells in the in-presence was better: in the classroom, the participants can quickly consult each other, thus improving the final percentage of agreements.
We grouped participants' answers according to the format used for the morphological workups and interactive sessions (digital images or WSI, respectively). The graph in Figure 4 demonstrates how the best morphological consensus, reaching 74%, was attained when cells could be examined in their context, as it is possible using the WSI. Such an inter-observer concordance level is higher than those reported in the literature in most published studies.4, 41-44
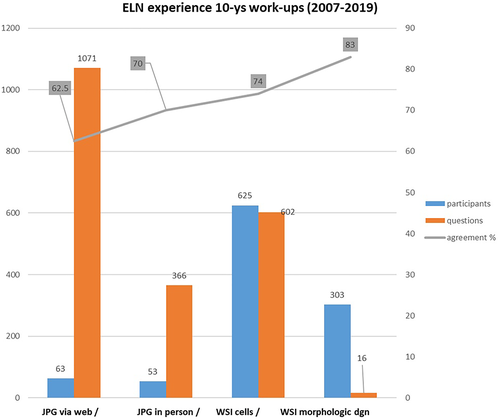
A good agreement was obtained in identifying megakaryocytes, lymphocytes, parasites, normal and dysplastic cells of the granulocytic and erythroid series. Dyserythropoietic features were better appreciated when the WSI was used. Agreements in cell identification for lymphoma cells, myeloblasts, abnormal microgranular promyelocytes and cancer cells were substantially lower with digital microphotographs (about 40%) than with specific FOVs in the WSI (about 84%). Notably, the eight questions on micromegakaryocytes, which are dysplastic cells not to be included in the blast count, have shown wide inter-observer variability with both types of digital images. Major discrepancies were observed in the neoplasms involving the monocytic series.
4 DISCUSSION
The experience obtained from over 10 years of experience with different digital reproduction supports has demonstrated that the use of VM offers substantial advantages, as verified during the repeated exercises carried out in the context of the ELN WP10 project. The improvement, in comparison to the digital microphotographs, was likely linked, in our opinion, to finding other images of the same type and, in general, to the information obtained by the extended cellular context visible on the virtual smears. The finding of a minor agreement among the participants in the neoplasms involving the monocytic series is explained, in our opinion, by the partial uncertainty in the classification of monocytes with atypical morphology and intermediate maturation.45 The morphologic distinction between an immature monocyte and a promonocyte (a blast equivalent according to the WHO) has shown to be very difficult, with the substantial risk of misdiagnosis of chronic myelomonocytic leukemia vs. acute monocytic leukemia. Identifying an immature chromatin pattern, same as in monoblasts, is crucial for the definition of promonocytes according to the WHO classification. VM offers the possibility to identify the same immature chromatin pattern in cells of considerable size and the round nucleus (monoblasts) and cells with irregular nuclear profiles (promonocytes), as well as of distinguishing a more condensed chromatin pattern in the so-called immature monocytes (excluded from the blast count). Micromegakaryocytes, on the other hand, remain small challenging cells, usually observed at low frequency, often showing poor identification agreement even by expert morphologists.
The advantages of WSI-based VM compared to glass slides are numerous. They are not fragile, they do not deteriorate over time, are more accessible to a very large number of users even simultaneously, guarantee comparison on the same cell or field, allow the creation of extensive databases that also include images of very rare diseases, do not take up physical space and can be duplicated. Images are immediately available for incorporation into websites or digital publications, printing, transfer to other individuals by email or other applications. They are essentially indistinguishable from conventional digital microphotographs.
The formation of new morphologists is using VM and WSI could improve, being easier and more complete. The current COVID-19 pandemic has dramatically forced us to reflect on the importance of developing advances in computer speed, internet streaming technology, and more reliable methods for the exchange of data and images in the field of telemedicine. The process also concerns the production and exchange of digitized slides of PB and BMA. Full achievement of digitization of smears from BMA and PB is a still slow but irreversible process, owing to the enormous potential benefits for cytomorphological diagnosis. In the next few years, we will likely see relevant implementation, including standardization of the process and improved automated blood cell classifiers.39Harmonization of the diagnostic process is another important goal. Technological advances are leading the way, but expert morphologists' supervision remains the cornerstone of cytomorphological diagnosis. In the described context, the development of the VM with a WSI-based technique was applied to the exchange and utilization of hematological specimens, and has demonstrated its solidity and a significant series of practical advantages. Further studies are required to extend its application in education, standardization, and harmonization, and for possible diagnostic use in specific contexts.
CONFLICT OF INTEREST
The authors declare no conflict of interest.
Open Research
DATA AVAILABILITY STATEMENT
Data are available on request.


