Quantitative color analysis of the diets of patients with metabolic dysfunction-associated steatotic liver disease: Comparative study with nutritionally balanced diets
Abstract
Aim
The prevalence of metabolic dysfunction-associated steatotic liver disease (MASLD), including its severe subtype, metabolic dysfunction-associated steatohepatitis (MASH), is increasing worldwide. This condition is a major health concern as MASH can progress to cirrhosis and hepatocellular carcinoma. With no specific medications available, lifestyle modifications, particularly dietary and exercise interventions, are crucial for managing MASLD. This study aimed to analyze the color characteristics of meals consumed by MASLD patients, seeking insights for dietary modifications.
Methods
We quantitatively analyzed the chromaticity, hue, and chroma of photographs of patients' meals and compared these statistical measures with those of nutritionally balanced meals recommended by dietitians. We also examined associations between the color characteristics of patients' meals, their clinical data, and dietary nutrients.
Results
Patients' meals exhibited significantly lower variances in chromaticity (a∗ and b∗) and lower average chroma compared to nutritionally balanced meals. Specifically, the overall mean of variance of a∗ for patients' meals was 151.1, compared to 340.5 for nutritionally balanced meals. The overall mean of average chroma for patients' meals was 24.54, whereas that for nutritionally balanced meals was 34.47. Additionally, patients' dietary patterns were found to be potentially linked not only to nutritional deficiencies but also to the prognosis and progression of hepatic fibrosis and MASLD severity.
Conclusions
This study reveals reduced color vibrancy and diversity in the diets of MASLD patients, suggesting potential dietary modifications to improve nutritional habits and clinical management for MASLD patients.
Graphical Abstract
As there are no FDA-approved medications for metabolic dysfunction-associated steatotic liver disease (MASLD), dietary and exercise changes are the primary treatments. Our study demonstrated that meals consumed by MASLD patients exhibit reduced color vibrancy and diversity compared to nutritionally balanced meals. Increasing the intake of colorful and vibrant meals could help manage MASLD more effectively.
Abbreviations
-
- ALT
-
- alanine aminotransferase
-
- CIE
-
- International Commission on Illumination
-
- HCC
-
- hepatocellular carcinoma
-
- HCV
-
- hepatitis C virus
-
- MASH
-
- metabolic-dysfunction-associated steatohepatitis
-
- MASLD
-
- metabolic dysfunction-associated steatotic liver disease
-
- Med-Diet
-
- Mediterranean diet
-
- NAFLD
-
- nonalcoholic fatty liver disease
-
- RGB
-
- red, green, blue
INTRODUCTION
Metabolic dysfunction-associated steatotic liver disease is a new term for NAFLD.1 It is characterized by excessive fat accumulation in the liver.2 Several studies reported high concordance between MASLD and NAFLD, as more than 96% of Japanese patients previously diagnosed with NAFLD met the criteria for MASLD.3, 4 Metabolic dysfunction-associated steatotic liver disease is the most common chronic liver disease,5-7 and its incidence and prevalence have been increasing worldwide.8 Metabolic dysfunction-associated steatotic liver disease is becoming a major medical problem, especially in industrialized countries.9, 10 A recent study reported a 32.45% prevalence of MASLD in the United States,11 while the prevalence is 26% in Japan.12 Approximately 20%–30% of MASLD patients develop MASH, which is progressive and can lead to liver fibrosis, cirrhosis, and HCC.13, 14 Although HCV is widely known to be a major risk factor for HCC, a recent report indicates that MASLD is also a risk factor for HCC development after HCV eradication.15 Therefore, managing MASLD is crucial even in patients with sustained virologic response. In some severe cases of MASLD, liver transplantation may be necessary.8, 14 Additionally, MASLD is a risk factor for cardiovascular diseases and cancer of the liver and other organs.9, 14, 16, 17
As there is currently no specific medication for MASLD,2, 18 lifestyle modifications, including diet changes, reductions in calorie intake, and exercise, are consequently the cornerstone of treatment.8, 9, 13, 14, 19 Weight loss through lifestyle modifications improves the hepatic fat content and liver pathophysiological status.9, 13 In particular, calorie restriction and Med-Diet are recommended for MASLD patients as they can promote weight loss and improve body fat, liver fat accumulation, and hepatic steatosis.20-23 However, the intake of such diets typically requires guidance from dietitians or other health-care professionals, and they may be difficult to follow and maintain.
This study aimed to uncover evidence to support dietary interventions for MASLD patients. To achieve this, we collected photographs of the meals routinely consumed by MASLD patients and investigated their quantitative color characteristics. Specifically, we calculated statistical measures of chromaticity (a∗ and b∗), hue, and chroma in a uniform 3D color space, CIELAB. The CIELAB space, defined by CIE in 1976, expresses perceptual color differences in a relatively uniform manner.24 We compared the color characteristics of patients' meals to those of nutritionally balanced diets recommended by dietitians.
A research group previously analyzed photographs of meals to promote health,25-27 and reported that meal color variety is related to consumption of vegetables and fruits, while it reduces intake of sugary treats.25 They suggested increasing the meal color variety as a simple, effective, and feasible strategy for promoting healthier diets.27 However, since their assessment was based on visual inspections, it could be influenced by human subjectivity and variability, as well as being labor-intensive. In contrast, our quantitative approach could provide more stable and reliable results. Moreover, we believe that this approach offers high utility and is highly feasible for improving diet habits, because color characteristics are easily perceived and understandable by the general population.
To the best of our knowledge, there are few reports that have quantitatively measured dietary color characteristics. Instead, some studies have used quantitative color analyses to investigate the nutrient and component contents in certain vegetables and food products.28-31 de Carvalho et al. assessed L∗, a∗, b∗, hue, and chroma in the CIELAB space in photographs of cassava roots, using an analysis method similar to ours.28 They found a correlation between the extracted color information and total carotenoid content. Li et al. measured L∗, a∗, and b∗ using a colorimeter and calculated the hue and chroma for dried black carrots.29 Their results indicated that a∗ and chroma values have a strong positive correlation with the anthocyanin content.
This study used quantitative color analysis methods28-31 to highlight the perceptual features of MASLD patients' diets. The results support the findings of König et al. that colorful meals are associated with healthiness.25-27 Furthermore, our findings have the potential to contribute to improving the clinical status of MASLD patients.
METHODS
Samples
Forty-one biopsy-confirmed MASLD patients were recruited for this study from three hepatology centers in Japan: Saga University Hospital, JA Hiroshima Kouseiren General Hospital, and Yokohama City University Hospital. All patients underwent a percutaneous liver needle biopsy and the biopsied specimens were diagnosed by an experienced pathologist blinded to the clinical data. They also met the definitions of MASLD as specified in the EASL-EASD-EASO Clinical Practice Guidelines.20 The exclusion criteria for this study included a history of other hepatic diseases, substance abuse-induced hepatic disorders, and a history of alcohol abuse. Detailed clinical data of the patients are provided in Tables S1 and S2 in Supporting Information S1. Table S1 lists the baseline characteristics and biochemical data, including ALT levels. Table S2 lists the histological data of the biopsied samples, including the fibrosis stage.
Patients were instructed to photograph each meal they consumed over a period of approximately 2 weeks. These patients had not been counseled to change their diets before collecting the photographs. They used personal smartphones or digital cameras to record the data. There were no specific requirements regarding shooting distances or environments. In total, 957 meal photographs were collected from the patients. Additionally, for comparison purposes, 16 photographs of nutritionally balanced meals were provided by dietitians.
Color characterization
We analyzed meal photographs using the following steps: image preprocessing, color characteristic extractions, and statistical calculations. Figure 1 shows the workflow for these processes.

Workflow for calculating statistics from photographic data using color characteristics and a chromaticity map. , chromaticity a*; , average of a*; , chromaticity b*; , average of b*; C, chroma; , average of chroma; , average distance from each chromaticitiy point to the center of gravity; H, hue; , average of hue; , lightness; Va∗, variance of a*; Vb∗, variance of b*; VH, variance of hue.
Color characteristic extractions
First, we removed the areas surrounding the food, such as plates and backgrounds, from the photographs, replacing their pixels with black. Background removal was manually achieved using a tool in PowerPoint (Office LTSC; Microsoft). Subsequently, color characteristics were extracted from the red (R), green (G), and blue (B) values. Specifically, a∗ and b∗ in the CIELAB (CIE 1976 L*a*b*) color space were defined.24, 28 Additionally, hue (H) and chroma (C) were calculated from a∗ and b∗. The detailed calculations and equations are provided in Supporting Information S2.
Statistical measures
We used a∗, b∗, H, and C to compute the statistical measures. The color characteristics and statistical measures were computed using Java 1.6.0 on a Windows operating system. The statistics were calculated through chromaticity maps, plotting b∗ as a function of a∗ as scatter maps. In chromaticity maps, H represents the counterclockwise angle from the three o'clock direction, while C corresponds to the distance from the origin (please refer to Figure 1). We determined the averages of , , , and as a∗, b∗, H, and C, respectively. The variances of a∗, b∗, and H were defined as Va∗, Vb∗, and VH, respectively. Additionally, we computed the average distance from each plot point (a∗, b∗) to the center of gravity within the chromaticity maps, and defined it as .
The averaged statistics per patient were calculated from the averaged chromaticity maps for each of the 41 patients. Subsequently, statistical significance tests were carried out using Welch's t-test to compare the average , , , and per patient with those of nutritionally balanced meals. In contrast, F-tests were carried out to compare Va∗, Vb∗, and VH between patients' meals and nutritionally balanced meals, using not the averages of Va∗, Vb∗, and VH but the variances of , , and .
Additionally, we examined the association between patients' clinical data and meal color characteristics. We used the averaged as a measure of color vibrance and the averaged Va∗ as a measure of color diversity, plotting these values against the ALT level and fibrosis stage for each patient, respectively. Spearman rank-order correlation coefficients (ρ) were calculated, and the statistical significance of these correlations was tested using the Spearman correlation test. All statistical tests and calculation of p values and ρ were undertaken using JMP Pro 17.2 (JMP Statistical Discovery LLC), with significance levels set at 0.05. Finally, we investigated the association between nutrients and color characteristics. Nutritional intake data per day for 37 of the patients were previously analyzed and quantified by a dietitian.9 We used the data on potassium, copper, vitamin A, folic acid, water-soluble dietary fiber, and insoluble dietary fiber, which were significantly low in the patients compared to healthy controls.9 The Spearman correlation test was used to assess the associations between each nutrient and color vibrancy or diversity.
RESULTS
Table 1 displays the mean ± SD of the statistics for 957 photographs collected from the patients, the overall mean ± SD of the averaged statistics per each of the 41 patients, and the mean ± SD of the statistics for 16 nutritionally balanced meals, along with the results of statistical significance tests. In cases where statistical significance was confirmed between the averaged statistics per patient and the nutritionally balanced meals, higher means are highlighted in bold, and the corresponding p values are listed in the right column.
| All meals of patients (n = 957) | Average data per patient (n = 41) | Nutritionally balanced meals (n = 16) | Statistical significance | |
|---|---|---|---|---|
| 7.404 ± 7.121a | 6.793 ± 2.734 | 5.682 ± 7.316 | n.s. | |
| 20.59 ± 11.05 | 20.86 ± 5.02 | 32.76 ± 7.31 | <0.0001b | |
| 73.54 ± 24.72 | 73.56 ± 24.75 | 81.40 ± 12.68 | n.s. | |
| 24.41 ± 10.87 | 24.54 ± 4.457 | 34.47 ± 6.96 | <0.0001 | |
| Va∗ | 117.0 ± 373.6 | 151.13 ± 60.37 | 340.47 ± 171.64 | 0.0007 |
| Vb∗ | 201.6 ± 1517.0 | 286.83 ± 90.32 | 383.45 ± 99.11 | 0.0029 |
| VH | 1328.91 ± 2081.14 | 1187.07 ± 348.02 | 1243.6 ± 1199.23 | n.s. |
| 14.73 ± 5.10 | 18.14 ± 2.46 | 24.12 ± 4.11 | <0.0001 |
- Abbreviations: , average distance from each chromaticitiy point to the center of gravity; n.s., not significant; Va∗, variance of a∗; Vb∗, variance of b∗; VH, variance of hue.
- a Standard deviation.
- b p values are presented for significant cases (p < 0.05), and the corresponding mean values are bolded to highlight significance.
Overall, the SDs of the statistics for all patients' meals were substantially larger than those for the averaged statistics per patient, as shown in Table 1, suggesting that the color characteristics of the patients' meals contained many outliers. Therefore, we used the averaged statistics per patient for the comparison with nutritionally balanced meals in the statistical significance tests. Consequently, we found that b∗, C, Va∗, Vb∗, and DfromG per patient were statistically significantly lower than those for the nutritionally balanced meals. The statistics for hue showed large SDs, and no statistically significant differences were observed.
Figures 2 and 3 showcase four examples of the preprocessed photographs, the corresponding chromaticity maps, and the statistics for the patients' meals and the nutritionally balanced meals, respectively. Overall, the patients' meals appear to contain more brownish foods, as seen in Figure 2a, while the nutritionally balanced meals contain a lot of colorful and vibrant foods, including red, yellow, and green, as displayed in Figure 3a.
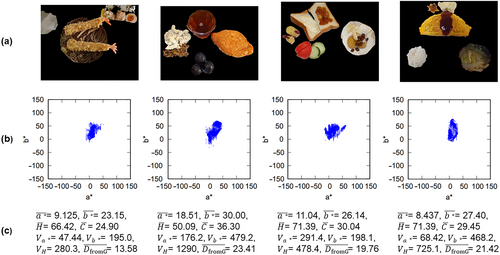
Four examples of the meals of metabolic dysfunction-associated steatotic liver disease patients with (a) the preprocessed photographs, (b) the corresponding chromaticity maps, and (c) the resulting statistical measures. , chromaticity a*; , average of a*; , chromaticity b*; , average of b*; , average of chroma; , average distance from each chromaticitiy point to the center of gravity; , average of hue; Va∗, variance of a*; Vb∗, variance of b*; VH, variance of hue.

Four examples of nutritionally balanced meals with (a) the preprocessed photographs, (b) the corresponding chromaticity maps, and (c) the resulting statistical measures. , chromaticity a*; , average of a*; , chromaticity of b*; , average of b*; , average of chroma; , average distance from each chromaticitiy point to the center of gravity; , average of hue; Va∗, variance of a*; Vb∗, variance of b*; VH, variance of hue.
As shown in Figure 2b, most of the chromaticity maps for the patients' meals exhibit a distribution of a∗ and b∗ extending upward from the origin, with small horizontal spread. In the case of the third meal, which contains portions of red tomato and green cucumber, the chromaticity map shows a relatively wide distribution in the horizontal direction. In contrast, the chromaticity maps for the nutritionally balanced meals display a widely scattered distribution from the origin with an inverted triangular shape, as shown in Figure 3b. Furthermore, we observed that the value of Va∗ increases as the horizontal distribution widens in the chromaticity map, while a greater vertical distribution results in an increase in Vb∗. In particular, the first meal in Figure 3 corresponds to a widely spread chromaticity map in both the horizontal and vertical directions, with the resulting Va∗ and Vb∗ values higher than 500.
In addition, DfromG, representing the average distance from the center of gravity within the chromaticity map, also increases as the distribution becomes more widely scattered. This is particularly evident in the first, third, and fourth cases in Figure 3. The second case in Figure 2 contains purple grapes, while purple cereal rice is present in the second case in Figure 3. These corresponding chromaticity maps exhibit plots with negative b∗ values. Consequently, the resulting VH values, which indicate the spread of the distributed plots in the angular direction, are notably high.
Figure 4a shows the relationship between H and C for all patients' meals in comparison to the nutritionally balanced meals. Figure 4b shows the relationship using the averaged H and C per patient to compare with the statistics of the nutritionally balanced meals. These two plots demonstrate the average color and the vividness included in the respective meals. The means of H and C for the patients' meals, indicated by a blue asterisk in Figure 4a, are 73.54 and 24.41, respectively, as listed in Table 1. In contrast, the means of H and C for the nutritionally balanced meals, indicated by a red cross, are 81.40 and 34.47, respectively. We observed in Figure 4 that the points for the patients' meals (sky blue) are positioned more toward the lower left compared to the nutritionally balanced meals. Nonetheless, a statistically significant difference was verified only for C. Figure 5a shows the relationship between Va∗ and Vb∗ for all patients' meals in comparison to the nutritionally balanced meals. Figure 5b shows the relationship using the averaged Va∗ and Vb∗ per patient. In these plots, a higher value on the horizontal axis indicates more color variations between red and green, while a higher value on the vertical axis indicates more color variation between yellow and blue. The means of Va∗ and Vb∗ for the patients' meals, indicated by a blue asterisk in Figure 5a, are 117.0 and 201.6, respectively, as listed in Table 1. In contrast, the means of Va∗ and Vb∗ for the nutritionally balanced meals, indicated by a red cross, are higher, at 340.5 and 383.5, respectively. The plotted points for the patients' meals (sky blue) tend to be more localized toward the lower left corner compared to the nutritionally balanced meals. Table 1 demonstrates the statistically significant differences between the patients' meals and the nutritionally balanced meals in both Va∗ and Vb∗. These findings indicate that the patients' meals have a lower color variation than the nutritionally balanced meals in both the red-green and yellow-blue directions.
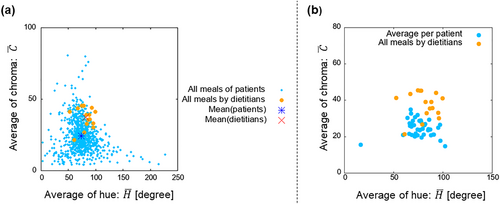
Scatter plots of the averaged chroma () as a function of the averaged hue (), comparing meals of metabolic dysfunction-associated steatotic liver disease patients with nutritionally balanced meals. (a) Comparison between all meals of patients and nutritionally balanced meals. The mean values of and are also plotted for the meals of patients and nutritionally balanced meals as a blue asterisk and red cross, respectively. (b) Comparison between averaged statistics per patient and statistics for all nutritionally balanced meals.
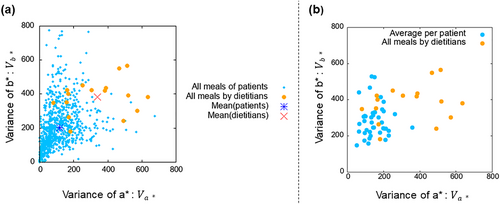
Scatter plots of the variances of b∗ (Vb∗) as a function of the variances of a∗ (Va∗), comparing metabolic dysfunction-associated steatotic liver disease patients' meals with nutritionally balanced meals recommended by dietitians. (a) Comparison between all meals of patients and nutritionally balanced meals. The mean values of Va∗ and Vb∗ are also plotted. (b) Comparison between averaged statistics per patient and statistics for all nutritionally balanced meals.
Figure 6a shows the relationship between average C and ALT levels for respective patients, while Figure 6b shows the relationship between average Va∗ and ALT levels. For ALT levels and average C, the correlation was ρ = −0.148 with p = 0.357, indicating no significant association. In contrast, for ALT levels and average Va∗, the correlation was ρ = −0.392 with p = 0.0113, indicating not strong but statistically significant negative correlation (p < 0.05).
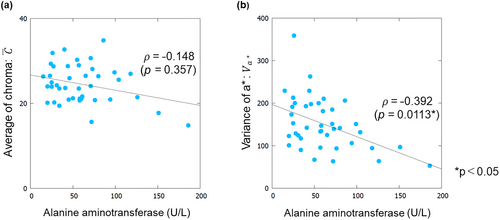
Relationships between dietary color characteristics and alanine aminotransferase (ALT) levels in metabolic dysfunction-associated steatotic liver disease patients. (a) Scatter plots of the average chroma () versus ALT levels. (b) Scatter plots of the variances in a∗ (Va∗) versus ALT levels. The plots include linear approximation lines, Spearman rank-order correlation coefficients (ρ), and p values.
Figure 7a shows the relationship between average C and fibrosis stages for respective patients, while Figure 7b shows the relationship between average Va∗ and fibrosis stages. The correlation between fibrosis stages and average C was ρ = −0.311 with p = 0.0467, representing a significant negative correlation (p < 0.05). However, there was no significant association between fibrosis stages and average Va∗, with ρ = −0.230 with p = 0.148.
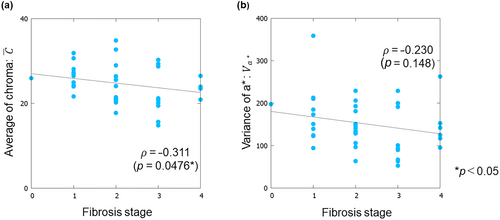
Relationships between dietary color characteristics and fibrosis stages of metabolic dysfunction-associated steatotic liver disease patients. (a) Scatter plots of the average chroma () versus fibrosis stages. (b) Scatter plots of the variances in a∗ (Va∗) versus fibrosis stages. The plots include linear approximation lines, Spearman rank-order correlation coefficients (ρ), and p values. Results indicate that the nutritionally balanced meals exhibit a higher vividness compared to the patients' meals, although the average colors do not differ substantially.
Figure 8 shows the relationships between average Va∗ and various daily nutritional intake data for individual patients. Statistically significant positive correlations (ρ > 0 and p < 0.05) were observed between Va∗ and potassium, copper, folic acid, and insoluble dietary fiber, respectively. However, no significant correlations were found between color vibrancy and the nutritional data. Scatter plots of C against the nutritional data are provided in Figure S1.
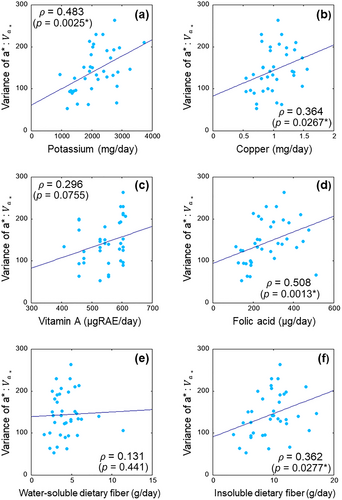
Relationships between dietary color variations (Va∗) and nutritional data of metabolic dysfunction-associated steatotic liver disease patients. Scatter plots show Va∗ versus plotted against various nutritional components: (a) potassium, (b) copper, (c) vitamin A, (d) folic acid, (e) water-soluble dietary fiber, and (f) insoluble dietary fiber. The plots include linear approximation lines, Spearman rank-order correlation coefficients (ρ), and p-values.
DISCUSSION
In this study, we quantitatively analyzed the color characteristics of meals consumed by MASLD patients in comparison to nutritionally balanced meals recommended by dietitians. By projecting these characteristics onto chromaticity maps and computing statistical measures, we identified distinct perceptual differences in color vividness and diversity. Specifically, the chromaticity maps for the patients' meals exhibit a smaller spread distribution than those for the nutritionally balanced meals. Additionally, the statistics indicating color vibrancy and diversity were significantly lower for the patients' meals compared to the nutritionally balanced meals. Nonetheless, we did not identify any specific color that was more abundant in the nutritionally balanced meals, as the means of H were approximately 80° for both types of meals. These findings suggest the importance of the overall color vibrancy and diversity rather than specific colors.
The values of b∗ essentially indicate the average of the degree between yellow and blue. However, as there are few blue- or purple-colored foods, corresponding to negative b∗ values, the points are typically distributed in the upper half of the chromaticity maps in this study. Consequently, the b∗ values for the meals' photographs are practically equivalent to the vertical distance from the origin, and are approximately correlated with C. As a result, lower b∗ and C values suggest that the meals of MASLD patients appear less vivid in color compared to nutritionally balanced meals.
Furthermore, the variance values (Va∗ and Vb∗) indicated that nutritionally balanced meals exhibit greater color variation, as evidenced by their widely spread distribution on the chromaticity maps. We also found that VH can be particularly elevated in meals containing purple food items. Purple vegetables and fruits contain high levels of anthocyanins, which are associated with weight maintenance and a reduced risk of cardiovascular diseases and type 2 diabetes.32-34 Thus, VH may serve as an indicator of healthy food appearance. However, our results did not reveal significant differences between patients' meals and nutritionally balanced meals, possibly due to the high variability in hue values. The effectiveness of meal color analysis using hue needs further verification.
The results of DfromG indicate that nutritionally balanced meals have a high variety in both chromaticity and chroma. The higher chroma range suggests that these meals contain foods with a wide range of vividness. This underscores the fact that patients' meals exhibit a relatively reduced vibrancy. The scatter plots in Figures 4 and 5 also suggest a lower color diversity and vividness in patients' meals. This discrepancy between both meals is more prominent when the statistics are computed using the averaged chromaticity maps per patient. We speculate that the averaging process suppresses the influence of outliers due to extreme diets, allowing us to identify the overall trends in the patients' daily eating habits.
Given that the chroma of white is 0, these results, showing reduced vibrancy, are consistent with the fact that the patients' meals contain a lot of carbohydrates, such as white rice, pasta, and bread, as well as fried foods. This also supports a study reporting that a high intake of meat and a lack of vegetable and fruit diversity are positively associated with MASLD prevalence.35 In contrast, nutritionally balanced meals typically contain multiple vegetables and fruits, leading to a greater vividness and color variation. The inclusion of diverse vegetables and fruits can contribute to health-promoting effects, such as reducing inflammation and preventing chronic diseases.36 A meta-analysis demonstrated that the Med-Diet improved hepatic steatosis and insulin resistance in MASLD patients.37 The Med-Diet is typically characterized by high consumption of fruits, vegetables, legumes, and olive oil, and low consumption of meat and sweets, resulting in rich color variations.38, 39 Therefore, vibrant and colorful meals are associated with the Med-Diet and may improve MASLD status, as reported in previous studies.20, 23, 37 We observed a significant negative correlation between ALT levels and color variation, particularly in the red-green directions, in patients' meals, as well as between fibrosis stage and color vibrancy. An ALT level above 30 (U/L) is a key marker for hepatic fibrosis,40 while hepatic fibrosis is the most important prognostic factor and accurate predictor of mortality for MASLD patients.21, 41 Therefore, our findings suggest that typical dietary patterns of patients may be linked to the prognosis and progression of hepatic fibrosis and the severity of MASLD. Although no statistically significant correlations were found between other clinical data and dietary color characteristics, we plan to further explore the association between dietary color patterns and clinical data.
We also found significant positive correlations between color variation in the red-green direction and specific nutrients (potassium, copper, folic acid, and insoluble dietary fiber). The intake of these nutrients was significantly lower in patients compared to controls.9 Several studies have reported that increased potassium and total fiber intake can reduce the risk of MASLD, while leafy vegetables, rich in folic acid, are associated with reduced mortality in MASLD patients.42, 43 These findings suggest that enhancing color diversity in diets may help to compensate for nutrient deficiencies in MASLD patients. In contrast, we found no significant associations between color vibrancy and nutrient intake. Further investigation into the relationship between color vibrancy and nutritional data is warranted.
In summary, our findings reveal that nutritionally balanced meals have a high vividness and color diversity. This is consistent with previous reports based on visual inspections of meal photographs, which suggested that perceived meal color variety is related to health benefits.25-27 However, our quantitative analysis provides more objective, reliable, and stable insights into dietary patterns. The meals routinely consumed by MASLD patients are characterized by a lack of color vibrancy and diversity. Accordingly, increasing the intake of colorful and vibrant foods could improve dietary habits and the clinical status of MASLD. As our color image analysis was performed in a perceptually uniform color space, the resulting characteristics could directly reflect the visual impact. Therefore, we expect that dietary interventions based on our color analyses may be more understandable and feasible for patients, increasing their adoption.
Nonetheless, this study has some limitations. First, the photographic recording devices were not standardized. While most devices use the sRGB space (a device-independent color space), the image processing method may have varied individually between the patients and the dietitians. Additionally, as the shooting conditions were not specified, images of meals taken in a dark room would lead to lower RGB values and consequently a lower chroma. Moreover, color appearance may vary and the analysis results can be affected depending on the situation, especially for foodstuffs with different internal and external colors, such as apples, bananas, and eggplants. These foods exhibit varying colors due to factors like the orientation of the cut section or whether the skin is peeled.
Second, our results might be biased due to the limited sample sizes of both patients and nutritionally balanced meals. Furthermore, the nutritional data were collected exclusively from Japanese patients living in Japan, which might include color features specific to Asian cuisine, such as miso, soy sauce, tofu, and white rice. This study also lacked healthy controls. Although we used nutritionally balanced meals provided by dietitians as a reference, they may not fully represent the dietary patterns of healthy individuals without MASLD. Hence, further research with a larger sample size, including healthy controls and a broader range of dietary patterns, is needed to confirm the effectiveness of vibrant and colorful meals in treating MASLD. Our analysis offers preliminary insights into the dietary trends among MASLD patients compared to healthier diets.
CONCLUSION
In this study, we identified significant differences in color characteristics between meals consumed by MASLD patients and nutritionally balanced meals. Specifically, our analysis of chromaticity, hue, chroma, and the spread of color distribution on chromaticity maps revealed reduced color diversity and vividness in the patients' meals, whereas nutritionally balanced meals displayed greater variety and vibrancy. Furthermore, our findings suggest that the common dietary patterns of MASLD patients may not only cause nutrient deficiencies but also influence the prognosis, progression of hepatic fibrosis, and severity of MASLD. These results underscore the importance of integrating color characteristics into dietary interventions for MASLD patients, offering valuable insights to improve their nutritional habits and enhance their clinical management.
ACKNOWLEDGMENTS
None.
CONFLICT OF INTEREST STATEMENT
Yoshihiro Kamada is an Editorial Board member of Hepatology Research. Hirokazu Takahashi received fees for promotional materials from Kowa Co., Ltd, Taisho Pharmaceutical Co., Ltd, and Novo Nordisk Pharma Ltd, and research funding from AbbVie GK. Atsushi Nakajima received honoraria from EA Pharma Co., Ltd, Mochida Pharmaceutical Co., Ltd, Kowa Co., Ltd, Astellas Pharma Inc., Novo Nordisk Pharma Ltd, and Taisho Pharmaceutical Co., Ltd. Atsushi Nakajima also received fees for promotional materials from EA Pharma Co., Ltd, Mochida Pharmaceutical Co., Ltd, and Kowa Co., Ltd, and research funding from EA Pharma Co., Ltd, Mochida Pharmaceutical Co., Ltd, Kowa Co., Ltd, Astellas Pharma Inc., Novo Nordisk Pharma Ltd, Taisho Pharmaceutical Co., Ltd, ASKA Pharmaceutical Co., Ltd, and Gilead Sciences, Inc. The other authors declare no conflicts of interest for this article.
ETHICS STATEMENTS
Approval of the research protocol by an Institutional Reviewer Board: This study was approved as a multicenter study by each of the following institutional review boards: Osaka University Hospital, Saga University Hospital, JA Hiroshima Kouseiren General Hospital, and Yokohama City University Hospital. This study was conducted in accordance with the Helsinki Declaration.
Information consent: Informed consent was obtained from all subjects at each institute.
Registry and the Registration No. of the study/trial: N/A.
Animal Studies: N/A.
Open Research
DATA AVAILABILITY STATEMENT
Research data are not shared.


