Report of the 23rd nationwide follow-up survey of primary liver cancer in Japan (2014–2015)
Abstract
For the 23rd Nationwide Follow-up Survey of Primary Liver Cancer in Japan, data from 20 889 newly registered patients and 42 274 previously registered follow-up patients were compiled from 516 institutions over a 2-year period from January 1, 2014 to December 31, 2015. Basic statistics compiled for patients newly registered in the 23rd survey were cause of death, past medical history, clinical diagnosis, imaging diagnosis, treatment-related factors, pathological diagnosis, recurrence status, and autopsy findings. Compared with the previous 22nd survey, the population of patients with hepatocellular carcinoma (HCC) was older at the time of clinical diagnosis, had more female patients, had more patients with non-B non-C HCC, had smaller tumor diameter, and was more frequently treated with hepatectomy. Cumulative survival rates were calculated for HCC, intrahepatic cholangiocarcinoma, and combined hepatocellular cholangiocarcinoma (combined HCC and intrahepatic cholangiocarcinoma) by treatment type and background characteristics for patients newly registered between 2004 and 2015 whose final outcome was survival or death. The median overall survival and cumulative survival rates for HCC were calculated by dividing patients by combinations of background factors (number of tumors, tumor diameter, Child–Pugh grade, or albumin-bilirubin grade) and by treatment type (hepatectomy, radiofrequency ablation therapy, transcatheter arterial chemoembolization, hepatic arterial infusion chemotherapy, and systemic therapy). The same values were also calculated according to registration date by dividing patients newly registered between 1978 and 2015 into five time period groups. The data obtained from this nationwide follow-up survey are expected to contribute to advancing clinical research and treatment of primary liver cancer in the world.
Abbreviations
-
- AFP
-
- α-fetoprotein
-
- ALBI
-
- albumin-bilirubin
-
- BMI
-
- body mass index
-
- CR
-
- complete response
-
- DEB
-
- drug-eluting bead
-
- HAIC
-
- hepatic arterial infusion chemotherapy
-
- HCC
-
- hepatocellular carcinoma
-
- ICC
-
- intrahepatic cholangiocarcinoma
-
- JIS
-
- Japan Integrated Staging
-
- OS
-
- overall survival
-
- PIVKA-II
-
- protein induced by vitamin K absence or antagonist-II
-
- PD
-
- progressive disease
-
- PR
-
- partial response
-
- RECICL
-
- Response Evaluation Criteria in Cancer of the Liver
-
- RFA
-
- radiofrequency ablation
-
- SD
-
- stable disease
-
- TACE
-
- transcatheter arterial chemoembolization
-
- Vp4
-
- tumor invasion in the main trunk of the portal vein
-
- Vv3
-
- tumor invasion in the main trunk of the hepatic vein/inferior vena cava
INTRODUCTION
The Japan Liver Cancer Association (formerly Liver Cancer Study Group of Japan) has worked to advance the study and treatment of liver cancer since 1969, carrying out 22 national surveys on primary liver cancer with institutional members and collaborating institutions across Japan based on its General Rules for the Clinical and Pathological Study of Primary Liver Cancer,1-11 and publishing the official results of those surveys and original article using this database.12-54, 55-97, 98-107 The group also reports on the Response Evaluation Criteria in Cancer of the Liver.108-117 Recently, the Japan Liver Cancer Association also published clinical practice guidelines for intrahepatic cholangitis carcinoma.107
This report presents the results of the 23rd Nationwide Follow-up Survey of Primary Liver Cancer in Japan, with data obtained for 20 889 newly registered patients from 516 institutions across Japan over the 2-year period from January 1, 2014 to December 31, 2015. It also includes data obtained for 42 274 previously registered follow-up patients. Epidemiological, clinicopathological, diagnostic, and treatment-related data were compiled for newly registered patients. The median overall survival (OS) and cumulative survival rates by tumor diameter, number of tumors, histological type, background characteristics, hepatic functional reserve, and treatments were also calculated for patients previously registered in the 18th to 23rd surveys during 2004 to 2015.
This special report is a concise version of the original full report published in Japanese.106
PATIENTS AND METHODS
Basic statistics
The participants of this survey were patients who were hospitalized, underwent outpatient treatment, or underwent autopsy for primary liver cancer at 516 collaborating institutions across Japan during the 2-year period from January 1, 2014 to December 31, 2015, and who underwent treatment at institutions that had entered patient data for survey items created by the Follow-up Survey Committee of the Japan Liver Cancer Association (formerly Liver Cancer Study Group of Japan; Chair of Head Office: Masatoshi Kudo) into the National Clinical Database. A total of 20 889 patients were newly registered during this period. When imaging/clinical diagnosis, histopathological diagnosis, and histopathological diagnosis determined by autopsy were not consistent, precedence was given to the autopsy result when available and the histopathological diagnosis otherwise. The histological type was hepatocellular carcinoma (HCC) in 90.1% of patients, intrahepatic cholangiocarcinoma (ICC) in 6.9%, and combined hepatocellular cholangiocarcinoma (combined HCC and ICC) in 1.3% (Table 1). The results for patients newly registered in this survey were tabulated. Patients with missing data for a given parameter were excluded from tabulation for that parameter. The abbreviations used in the table are based on the Fifth Revised Edition of the General Rules for the Clinical and Pathological Study of Primary Liver Cancer.6
| Men | Women | Total | |
|---|---|---|---|
| Histological type | (n = 14 745) | (n = 6108) | (n = 20 853) |
| Hepatocellular carcinoma | 13 444 | 5346 | 18 790 (90.1%) |
| Intrahepatic cholangiocarcinoma | 896 | 552 | 1448 (6.9%) |
| Cholangiolocellular carcinoma | 70 | 49 | 119 (0.6%) |
| Biliary cystadenocarcinoma | 7 | 5 | 12 (0.1%) |
| Combined hepatocellular cholangiocarcinoma | 188 | 75 | 263 (1.3%) |
| Hepatoblastoma | 4 | 2 | 6 (0.0%) |
| Undifferentiated carcinoma | 10 | 4 | 14 (0.1%) |
| Other | 126 | 75 | 201 (1.0%) |
OS and cumulative survival rate
Median OS, which was defined as the period from the dates of diagnosis to any cause of death, and cumulative survival rates were calculated for HCC, ICC, and combined HCC and ICC by tumor characteristics, treatment, and background characteristics for patients newly registered between 2004 and 2015 whose final outcome was survival or death (excluding lost to follow-up). Cumulative survival rates for HCC were calculated by treatment (hepatectomy, local ablation therapy, transcatheter arterial chemoembolization [TACE], hepatic arterial infusion chemotherapy [HAIC], and systemic therapy [molecular targeted therapy]). The same values were also calculated according to registration date by dividing patients newly registered between 1978 and 2015 into five time period groups.
These median OS and cumulative survival rate calculations were made without censoring any deaths, including those in the “Other” category.
RESULTS
-
Basic statistics
Causes of death of newly enrolled patients during the survey period
The mortality rate during the survey period for newly enrolled patients with HCC was 13.7% (2458 patients). The cause of death was cancer for 60.3%, liver failure for 13.6%, gastrointestinal hemorrhage for 1.0%, and rupture of gastro-esophageal varices for 2.0%. The surgical mortality was 0.9% (22 patients), giving a surgical mortality rate of 0.3% among the 7981 patients who underwent surgery. The mortality rate for newly enrolled patients with ICC was 31.8% (449 patients). The cause of death was cancer for 81.7% and liver failure for 3.3% (Table 2).
| Hepatocellular carcinoma | Intrahepatic cholangiocarcinoma | Combined hepatocellular cholangiocarcinoma | |
|---|---|---|---|
| Surviving patients | 13 271 | 809 | 170 |
| Deaths from all causes | 2458 | 449 | 65 |
| Liver cancer | 1483 (60.3%) | 367 (81.7%) | 52 (80.0%) |
| Liver failure | 334 (13.6%) | 15 (3.3%) | 8 (12.3%) |
| Gastrointestinal hemorrhage | 25 (1.0%) | 2 (0.4%) | 0 (0.0%) |
| Rupture of esophageal/gastric varices | 49 (2.0%) | 1 (0.2%) | 2 (3.1%) |
| Intraperitoneal hemorrhage due to tumor rupture | 56 (2.3%) | 1 (0.2%) | 0 (0.0%) |
| Surgery | 22 (0.9%) | 5 (1.1%) | 1 (1.5%) |
| Other | 315 (12.8%) | 25 (5.6%) | 0 (0.0%) |
| Unknown | 174 (7.1%) | 33 (7.3%) | 2 (3.1%) |
| Survival status unknown | 2239 | 154 | 21 |
| Total | 17 968 | 1412 | 256 |
Past medical history
The proportions of patients with a history of transfusions and a history of excessive alcohol use were 19.2% and 27.8% for HCC, and 8.4% and 16.9% for ICC, respectively. The proportion with hypertension was 50.9% for HCC and 48.4% for ICC, and the proportion with diabetes was 33.7% for HCC and 22.9% for ICC. The proportion with a body mass index of ≥25 kg/m2 was 31.0% for HCC and 21.8% for ICC. The proportion with severe obesity (body mass index ≥30 kg/m2) was 5.6% for HCC and 3.0% for ICC.
Clinical and imaging diagnosis
The mean age of men and women at clinical diagnosis of primary liver cancer was 70.0 and 74.0 years for HCC, and 70.0 and 70.0 years for ICC, respectively. The ratio of male to female patients was 2.51:1 for HCC and 1.62:1 for ICC.
The liver damage grade at diagnosis of HCC was A in 65.6%, B in 28.9%, and C in 5.5% of patients. The Child–Pugh grade was A in 76.6%, B in 19.9%, and C in 3.4% of patients. The modified albumin-bilirubin (mALBI grade) was 1 in 27.4%, 2a in 23.9%, 2b in 36.8%, and 3 in 11.9% of patients. Serum albumin was measured by the bromocresol green method in 21.5%, and the modified bromocresol purple method in 78.5% of patients (Table 3).
| Hepatocellular carcinoma | Intrahepatic cholangiocarcinoma | Combined hepatocellular cholangiocarcinoma | |
|---|---|---|---|
| Evidence for diagnosis (multiple choices allowed) | (n = 34 864) | (n = 3008) | (n = 538) |
| CT | 15 025 | 1269 | 228 |
| MRI | 8202 | 643 | 122 |
| Ultrasound | 5667 | 515 | 82 |
| Contrast ultrasound | 1549 | 74 | 13 |
| Angiography | 1542 | 53 | 22 |
| Pathology | 879 | 270 | 39 |
| AngioCT | 1622 | 50 | 25 |
| Other | 378 | 134 | 7 |
| Percentages not calculated as multiple choices were allowed | |||
| Evidence for diagnosis (whether dynamic study was performed) when diagnostic modality was “CT” or “MRI” | (n = 15 992) | (n = 1139) | (n = 222) |
| Performed | 15 992 (100.0%) | 1139 (100.0%) | 222 (100.0%) |
| Performance status | (n = 17 192) | (n = 1341) | (n = 246) |
| PS0 | 12 658 (73.6%) | 886 (66.1%) | 186 (75.6%) |
| PS1 | 3000 (17.4%) | 249 (18.6%) | 34 (13.8%) |
| PS2 | 905 (5.3%) | 124 (9.2%) | 16 (6.5%) |
| PS3 | 461 (2.7%) | 57 (4.3%) | 8 (3.3%) |
| PS4 | 168 (1.0%) | 25 (1.9%) | 2 (0.8%) |
| Encephalopathy | (n = 18 431) | (n = 1403) | (n = 261) |
| None | 18 006 (97.7%) | 1394 (99.4%) | 258 (98.9%) |
| Mild | 344 (1.9%) | 7 (0.5%) | 2 (0.8%) |
| Moderate-to-severe | 81 (0.4%) | 2 (0.1%) | 1 (0.4%) |
| Ascites | (n = 18 395) | (n = 1397) | (n = 261) |
| None | 16 335 (88.8%) | 1286 (92.1%) | 239 (91.6%) |
| Responded to treatment | 1146 (6.2%) | 24 (1.7%) | 9 (3.4%) |
| Refractory to treatment | 914 (5.0%) | 87 (6.2%) | 13 (5.0%) |
| Serum bilirubin (mg/dL) | (n = 18 610) | (n = 1432) | (n = 261) |
| 0.0∼0.9 | 11 608 (62.4%) | 989 (69.1%) | 160 (61.3%) |
| 1.0∼1.9 | 5644 (30.3%) | 278 (19.4%) | 79 (30.3%) |
| 2.0∼3.0 | 840 (4.5%) | 43 (3.0%) | 14 (5.4%) |
| ≥3.1 | 518 (2.8%) | 122 (8.5%) | 8 (3.1%) |
| Serum albumin (g/dL) | (n = 18 559) | (n = 1425) | (n = 261) |
| <2.8 | 1333 (7.2%) | 92 (6.5%) | 15 (5.7%) |
| 2.8∼2.9 | 780 (4.2%) | 38 (2.7%) | 8 (3.1%) |
| 3.0∼3.5 | 4267 (23.0%) | 249 (17.5%) | 51 (19.5%) |
| >3.5 | 12 179 (65.6%) | 1046 (73.4%) | 187 (71.6%) |
| Method of albumin measurement | (n = 14 171) | (n = 1087) | (n = 189) |
| BCG | 3043 (21.5%) | 232 (21.3%) | 37 (19.6%) |
| Modified BCP | 11 128 (78.5%) | 855 (78.7%) | 152 (80.4%) |
| ICG R15 [%] | (n = 9623) | (n = 811) | (n = 179) |
| ≤14 | 4880 (50.7%) | 632 (77.9%) | 110 (61.5%) |
| 15∼24 | 2595 (27.0%) | 135 (16.6%) | 38 (21.2%) |
| 25∼40 | 1452 (15.1%) | 37 (4.6%) | 25 (14.0%) |
| >40 | 696 (7.2%) | 7 (0.9%) | 6 (3.4%) |
- Note: For all parameters, n is the total number of patients, excluding those in the “unknown” category, and (%) is the percentage of n.
- Abbreviations: AngioCT, computed tomography angiography; BCG, bromocresol green; BCP, bromocresol purple; CT, computed tomography; ICGR15, indocyanine green retention rate at 15 min; MRI, magnetic resonance imaging; PS, performance status.
In HCC, serum α-fetoprotein (AFP) was <10 ng/mL in 44.3%, 10–199 ng/mL in 34.7%, and ≥200 ng/mL in 21.0% of patients. Lectin-reactive α-fetoprotein was <10% in 66.5%, 10%–14.9% in 5.7%, and ≥15% in 27.8% of patients. Protein induced by vitamin K absence or antagonist-II was <40 mAU/mL in 37.9%, 40–99 mAU/mL in 14.4%, and ≥100 mAU/mL in 47.7% of patients. In ICC, carcinoembryonic antigen (CEA) was <5.0 ng/mL in 58.5%, 5.0–9.9 ng/mL in 16.7%, and ≥10 ng/mL in 24.8% of patients. CA19-9 was <37 U/mL in 35.4%, 37–99 U/mL in 15.0%, and ≥ 100 U/mL in 49.6% of patients (Tables 4 and 5).
| Hepatocellular carcinoma | Intrahepatic cholangiocarcinoma | Combined hepatocellular cholangiocarcinoma | |
|---|---|---|---|
| Prothrombin activity (%) | (n = 17 901) | (n = 1331) | (n = 250) |
| <40 | 443 (2.5%) | 45 (3.4%) | 5 (2.0%) |
| 40∼49 | 357 (2.0%) | 17 (1.3%) | 3 (1.2%) |
| 50∼70 | 2981 (16.7%) | 127 (9.5%) | 35 (14.0%) |
| 71∼80 | 3340 (18.7%) | 166 (12.5%) | 52 (20.8%) |
| >80 | 10 780 (60.2%) | 976 (73.3%) | 155 (62.0%) |
| Prothrombin time (INR) | (n = 17 872) | (n = 1336) | (n = 249) |
| ≤1.20 | 14 649 (82.0%) | 1181 (88.4%) | 215 (86.3%) |
| 1.21∼1.30 | 1707 (9.6%) | 79 (5.9%) | 18 (7.2%) |
| 1.31∼1.50 | 967 (5.4%) | 36 (2.7%) | 11 (4.4%) |
| 1.51∼1.80 | 303 (1.7%) | 25 (1.9%) | 0 (0.0%) |
| ≥1.81 | 246 (1.4%) | 15 (1.1%) | 5 (2.0%) |
| Platelets (×104/mm3) | (n = 18 601) | (n = 1427) | (n = 261) |
| <3.0 | 100 (0.5%) | 0 (0.0%) | 0 (0.0%) |
| 3.0∼4.9 | 546 (2.9%) | 7 (0.5%) | 6 (2.3%) |
| 5.0∼9.9 | 4280 (23.0%) | 62 (4.3%) | 36 (13.8%) |
| 10.0∼14.9 | 5495 (29.5%) | 234 (16.4%) | 65 (24.9%) |
| 15.0∼19.9 | 4202 (22.6%) | 376 (26.3%) | 76 (29.1%) |
| 20.0∼99.9 | 3883 (20.9%) | 743 (52.1%) | 77 (29.5%) |
| ≥100 | 95 (0.5%) | 5 (0.4%) | 1 (0.4%) |
| Serum creatinine (mg/dL) | (n = 18 346) | (n = 1420) | (n = 257) |
| <1.0 | 14 517 (79.1%) | 1171 (82.5%) | 210 (81.7%) |
| ≥1.0, <2.0 | 3218 (17.5%) | 217 (15.3%) | 39 (15.2%) |
| ≥2.0, <3.0 | 205 (1.1%) | 6 (0.4%) | 2 (0.8%) |
| ≥3.0 | 406 (2.2%) | 26 (1.8%) | 6 (2.3%) |
| Child–Pugh grade | (n = 17 683) | (n = 1285) | (n = 248) |
| A | 13 550 (76.6%) | 1004 (78.1%) | 202 (81.5%) |
| B | 3526 (19.9%) | 235 (18.3%) | 38 (15.3%) |
| C | 607 (3.4%) | 46 (3.6%) | 8 (3.2%) |
| mALBI grade | (n = 18 540) | (n = 1422) | (n = 261) |
| 1 | 5085 (27.4%) | 512 (36.0%) | 90 (34.5%) |
| 2a | 4439 (23.9%) | 345 (24.3%) | 64 (24.5%) |
| 2b | 6814 (36.8%) | 388 (27.3%) | 85 (32.6%) |
| 3 | 2202 (11.9%) | 177 (12.4%) | 22 (8.4%) |
- Note: For all parameters, n is the total number of patients, excluding those in the “unknown” category, and (%) is the percentage of n.
- Abbreviations: INR, international normalized ratio; mALBI, modified albumin-bilirubin.
| AFP (ng/mL) | (n = 18 137) | (n = 1017) | (n = 243) |
| <10 | 8035 (44.3%) | 839 (82.5%) | 89 (36.6%) |
| ≤199 | 6286 (34.7%) | 142 (14.0%) | 78 (32.1%) |
| ≤399 | 745 (4.1%) | 7 (0.7%) | 12 (4.9%) |
| ≤999 | 823 (4.5%) | 9 (0.9%) | 14 (5.8%) |
| ≤9999 | 1251 (6.9%) | 17 (1.7%) | 34 (14.0%) |
| ≤99 999 | 727 (4.0%) | 2 (0.2%) | 15 (6.2%) |
| ≥100 000 | 270 (1.5%) | 1 (0.1%) | 1 (0.4%) |
| AFP-L3 (%) | (n = 9144) | (n = 300) | (n = 122) |
| <5.0 | 4697 (51.4%) | 209 (69.7%) | 36 (29.5%) |
| <10.0 | 1382 (15.1%) | 23 (7.7%) | 10 (8.2%) |
| ≤14.9 | 519 (5.7%) | 6 (2.0%) | 5 (4.1%) |
| ≤19.9 | 305 (3.3%) | 5 (1.7%) | 7 (5.7%) |
| ≥20.0 | 2241 (24.5%) | 57 (19.0%) | 64 (52.5%) |
| PIVKA-II (mAU/mL) | (n = 17 525) | (n = 841) | (n = 231) |
| <40 | 6635 (37.9%) | 690 (82.0%) | 108 (46.8%) |
| ≤99 | 2523 (14.4%) | 55 (6.5%) | 27 (11.7%) |
| ≤299 | 2258 (12.9%) | 31 (3.7%) | 28 (12.1%) |
| ≤499 | 773 (4.4%) | 10 (1.2%) | 10 (4.3%) |
| ≤999 | 923 (5.3%) | 14 (1.7%) | 12 (5.2%) |
| ≤2999 | 1292 (7.4%) | 8 (1.0%) | 18 (7.8%) |
| ≤9999 | 1143 (6.5%) | 11 (1.3%) | 8 (3.5%) |
| ≥10 000 | 1978 (11.3%) | 22 (2.6%) | 20 (8.7%) |
| CEA (ng/mL) | (n = 9831) | (n = 1327) | (n = 199) |
| <2.5 | 3214 (32.7%) | 361 (27.2%) | 63 (31.7%) |
| ≤4.9 | 4109 (41.8%) | 415 (31.3%) | 69 (34.7%) |
| ≤9.9 | 2002 (20.4%) | 222 (16.7%) | 35 (17.6%) |
| ≤19.9 | 366 (3.7%) | 105 (7.9%) | 16 (8.0%) |
| ≤49.9 | 83 (0.8%) | 83 (6.3%) | 8 (4.0%) |
| ≤99.9 | 21 (0.2%) | 46 (3.5%) | 2 (1.0%) |
| ≥100 | 36 (0.4%) | 95 (7.2%) | 6 (3.0%) |
| CA19-9 (U/mL) | (n = 8731) | (n = 1301) | (n = 189) |
| <37 | 6777 (77.6%) | 461 (35.4%) | 104 (55.0%) |
| ≤99 | 1430 (16.4%) | 195 (15.0%) | 32 (16.9%) |
| ≤299 | 390 (4.5%) | 147 (11.3%) | 19 (10.1%) |
| ≤999 | 74 (0.8%) | 147 (11.3%) | 16 (8.5%) |
| ≤2999 | 38 (0.4%) | 117 (9.0%) | 9 (4.8%) |
| ≤9999 | 11 (0.1%) | 98 (7.5%) | 5 (2.6%) |
| ≥10 000 | 11 (0.1%) | 136 (10.5%) | 4 (2.1%) |
- Note: For all parameters, n is the total number of patients, excluding those in the “unknown” category, and (%) is the percentage of n.
- Abbreviations: AFP, α-fetoprotein; AFP-L3, lectin-reactive α-fetoprotein; CA 19–9, carbohydrate antigen 19–9; CEA, carcinoembryonic antigen; PIVKA-II, protein induced by vitamin K absence or antagonist-II.
The hepatitis B surface antigen-positive rate was 13.3% for HCC, 6.3% for ICC, and 21.0% for combined HCC and ICC. The hepatitis C virus antibody-positive rate was 45.6% for HCC, 13.1% for ICC, and 32.0% for combined HCC and ICC (Tables 6 and 7). The proportion of patients with hepatitis B who underwent nucleos(t)ide analogue therapy before developing HCC and achieved undetectable HBV DNA or biochemical response was 85.4%. The proportion of patients who underwent therapy for hepatitis C before developing HCC and achieved a sustained virological response (with unknown response treated as no response) was 45.3% (Table 7). Tumor diameter on imaging at diagnosis was ≤2 cm in 32.6% and 2.1–5.0 cm in 42.8% of patients with HCC. For ICC, these figures were 13.9% and 46.4%. The proportion of patients with unifocal disease was 66.0% for HCC and 79.0% for ICC. Tumor staining was observed in 93.0% and washout in 90.4% of HCC patients. Vascular invasion was observed in the portal vein in 13.1%, hepatic veins in 6.9%, and bile duct in 4.1% of HCC patients. Tumor rupture was observed in 2.6%, and F2 and larger/red color sign (+) esophageal or gastric varices were observed in 28.3% of HCC patients (Tables 8 and 9).
| Hepatocellular carcinoma | Intrahepatic cholangiocarcinoma | Combined hepatocellular cholangiocarcinoma | |
|---|---|---|---|
| HBsAg | (n = 17 799) | (n = 1362) | (n = 257) |
| Negative | 15 424 (86.7%) | 1276 (93.7%) | 203 (79.0%) |
| Positive | 2367 (13.3%) | 86 (6.3%) | 54 (21.0%) |
| Equivocal (±) | 8 (0.0%) | 0 (0.0%) | 0 (0.0%) |
| HBsAb | (n = 8060) | (n = 545) | (n = 123) |
| Negative | 6295 (78.1%) | 413 (75.8%) | 99 (80.5%) |
| Positive | 1741 (21.6%) | 130 (23.9%) | 24 (19.5%) |
| Equivocal (±) | 24 (0.3%) | 2 (0.4%) | 0 (0.0%) |
| HBcAb | (n = 8527) | (n = 517) | (n = 127) |
| Negative | 4534 (53.2%) | 311 (60.2%) | 63 (49.6%) |
| Positive | 3977 (46.6%) | 206 (39.8%) | 64 (50.4%) |
| Equivocal (±) | 16 (0.2%) | 0 (0.0%) | 0 (0.0%) |
| HBeAg | (n = 3893) | (n = 238) | (n = 82) |
| Negative | 3513 (90.2%) | 228 (95.8%) | 71 (86.6%) |
| Positive | 379 (9.7%) | 10 (4.2%) | 11 (13.4%) |
| Equivocal (±) | 1 (0.0%) | 0 (0.0%) | 0 (0.0%) |
| HBeAb | (n = 3750) | (n = 222) | (n = 79) |
| Negative | 2157 (57.5%) | 159 (71.6%) | 40 (50.6%) |
| Positive | 1586 (42.3%) | 63 (28.4%) | 39 (49.4%) |
| Equivocal (±) | 7 (0.2%) | 0 (0.0%) | 0 (0.0%) |
| HBV DNA load | |||
| TMA | (n = 2442) | (n = 161) | (n = 53) |
| Below detectable levels | 2280 (93.4%) | 156 (96.9%) | 44 (83.0%) |
| <3.7 LGE/mL | 72 (2.9%) | 3 (1.9%) | 4 (7.5%) |
| 3.7–3.9 LGE/mL | 9 (0.4%) | 2 (1.2%) | 0 (0.0%) |
| 4.0–4.9 LGE/mL | 19 (0.8%) | 0 (0.0%) | 1 (1.9%) |
| 5.0–5.9 LGE/mL | 18 (0.7%) | 0 (0.0%) | 0 (0.0%) |
| 6.0–6.9 LGE/mL | 25 (1.0%) | 0 (0.0%) | 2 (3.8%) |
| 7.0–7.9 LGE/mL | 15 (0.6%) | 0 (0.0%) | 1 (1.9%) |
| 8.0–8.7 LGE/mL | 3 (0.1%) | 0 (0.0%) | 1 (1.9%) |
| >8.7 LGE/mL | 1 (0.0%) | 0 (0.0%) | 0 (0.0%) |
| PCR | (n = 1092) | (n = 36) | (n = 21) |
| Below detectable levels | 222 (20.3%) | 7 (19.4%) | 4 (19.0%) |
| <2.1 Logcopies/mL | 15 (1.4%) | 0 (0.0%) | 2 (9.5%) |
| 2.1–2.9 Logcopies/mL | 226 (20.7%) | 10 (27.8%) | 8 (38.1%) |
| 3.0–3.9 Logcopies/mL | 162 (14.8%) | 12 (33.3%) | 1 (4.8%) |
| 4.0–4.9 Logcopies/mL | 98 (9.0%) | 3 (8.3%) | 1 (4.8%) |
| 5.0–5.9 Logcopies/mL | 106 (9.7%) | 1 (2.8%) | 2 (9.5%) |
| 6.0–6.9 Logcopies/mL | 145 (13.3%) | 3 (8.3%) | 2 (9.5%) |
| 7.0–7.9 Logcopies/mL | 92 (8.4%) | 0 (0.0%) | 0 (0.0%) |
| 8.0–8.8 Logcopies/mL | 15 (1.4%) | 0 (0.0%) | 1 (4.8%) |
| >8.8 Logcopies/mL | 11 (1.0%) | 0 (0.0%) | 0 (0.0%) |
| Antiviral therapy for hepatitis B before cancer diagnosis | (n = 1000) | (n = 24) | (n = 19) |
| Nucleos(t)ide analog | 883 | 21 | 16 |
| Interferon | 87 | 1 | 2 |
| Other | 30 | 2 | 1 |
| Percentages not calculated as multiple choices were allowed | |||
| Response to antiviral therapy for hepatitis B before cancer diagnosis | (n = 836) | (n = 17) | (n = 18) |
| Null response | 108 (12.9%) | 3 (17.6%) | 1 (5.6%) |
| Biochemical response | 238 (28.5%) | 4 (23.5%) | 8 (44.4%) |
| Relapse | 17 (2.0%) | 0 (0.0%) | 0 (0.0%) |
| Complete response (undetectable HBV DNA) | 473 (56.6%) | 10 (58.8%) | 9 (50.0%) |
- Note: For all parameters, n is the total number of patients, excluding those in the “unknown” category, and (%) is the percentage of n.
- Abbreviations: HBcAb, antibody to hepatitis B core antigen; HBeAb, antibody to hepatitis B e antigen; HBeAg, hepatitis B e antigen; HBsAb, antibody to hepatitisB surface antigen; HBsAg, hepatitis B surface antigen; HCC, hepatocellular carcinoma; HCV, hepatitis C virus.
| Hepatocellular carcinoma | Intrahepatic cholangiocarcinoma | Combined hepatocellular cholangiocarcinoma | |
|---|---|---|---|
| HCV Ab | (n = 17 576) | (n = 1333) | (n = 253) |
| Negative | 9541 (54.3%) | 1159 (86.9%) | 172 (68.0%) |
| Positive | 8008 (45.6%) | 174 (13.1%) | 81 (32.0%) |
| Equivocal (±) | 27 (0.2%) | 0 (0.0%) | 0 (0.0%) |
| HCV RNA (logIU/mL) | (n = 5461) | (n = 170) | (n = 71) |
| Below detectable level | 2042 (37.4%) | 126 (74.1%) | 38 (53.5%) |
| Positive <1.2 | 8 (0.1%) | 0 (0.0%) | 0 (0.0%) |
| 1.2∼2.9 | 61 (1.1%) | 2 (1.2%) | 1 (1.4%) |
| 3.0∼4.9 | 516 (9.4%) | 6 (3.5%) | 6 (8.5%) |
| 5.0∼6.9 | 2632 (48.2%) | 33 (19.4%) | 24 (33.8%) |
| 7.0∼ | 202 (3.7%) | 3 (1.8%) | 2 (2.8%) |
| Antiviral therapy for hepatitis C before cancer diagnosis | (n = 2394) | (n = 50) | (n = 37) |
| Interferon alone | 1010 | 21 | 12 |
| Peginterferon alone | 189 | 3 | 3 |
| Interferon + ribavirin | 238 | 2 | 6 |
| Peginterferon + ribavirin | 641 | 20 | 12 |
| Peginterferon + ribavirin + DAA | 118 | 0 | 2 |
| DAA alone | 198 | 4 | 2 |
| Percentages not calculated as multiple choices were allowed | |||
| Response to antiviral therapy for hepatitis C before cancer diagnosis | (n = 2091) | (n = 48) | (n = 30) |
| Null response | 750 (35.9%) | 11 (22.9%) | 11 (36.7%) |
| Biochemical response | 149 (7.1%) | 0 (0.0%) | 1 (3.3%) |
| Relapse | 244 (11.7%) | 2 (4.2%) | 5 (16.7%) |
| Complete response (SVR) | 948 (45.3%) | 35 (72.9%) | 13 (43.3%) |
| HIV Ab | (n = 5910) | (n = 596) | (n = 108) |
| Negative | 5875 (99.4%) | 593 (99.5%) | 107 (99.1%) |
| Positive | 33 (0.6%) | 3 (0.5%) | 0 (0.0%) |
| Equivocal (±) | 2 (0.0%) | 0 (0.0%) | 1 (0.9%) |
- Note: For all parameters, n is the total number of patients, excluding those in the “unknown” category, and (%) is the percentage of n.
- Abbreviations: HCV, hepatitis C virus; SVR, sustained virologic response.
| Hepatocellular carcinoma | Intrahepatic cholangiocarcinoma | Combined hepatocellular cholangiocarcinoma | |
|---|---|---|---|
| Maximum tumor diameter (intrahepatic) | (n = 18 177) | (n = 1270) | (n = 257) |
| ≤1 cm | 979 (5.4%) | 20 (1.6%) | 6 (2.3%) |
| 1 cm to ≤2 cm | 4939 (27.2%) | 156 (12.3%) | 42 (16.4%) |
| 2 cm to ≤3 cm | 4082 (22.5%) | 238 (18.7%) | 46 (18.0%) |
| 3 cm to ≤5 cm | 3685 (20.3%) | 352 (27.7%) | 63 (24.5%) |
| 5 cm to ≤10 cm | 3189 (17.6%) | 401 (31.6%) | 79 (30.7%) |
| 10 cm to ≤15 cm | 1047 (5.8%) | 88 (6.9%) | 18 (7.0%) |
| 15 cm to ≤20 cm | 229 (1.3%) | 13 (1.0%) | 3 (1.2%) |
| 20 cm to 25 cm | 18 (0.1%) | 1 (0.1%) | 0 (0.0%) |
| >25 cm | 9 (0.0%) | 1 (0.1%) | 0 (0.0%) |
| No. tumors (intrahepatic) | (n = 18 163) | (n = 1283) | (n = 256) |
| 1 | 11 996 (66.0%) | 1014 (79.0%) | 164 (64.1%) |
| 2 | 2750 (15.1%) | 71 (5.5%) | 37 (14.5%) |
| 3 | 1202 (6.6%) | 30 (2.3%) | 12 (4.7%) |
| 4 | 436 (2.4%) | 12 (0.9%) | 7 (2.7%) |
| 5 | 268 (1.5%) | 16 (1.2%) | 4 (1.6%) |
| 6 | 120 (0.7%) | 5 (0.4%) | 4 (1.6%) |
| 7 | 65 (0.4%) | 3 (0.2%) | 0 (0.0%) |
| 8 | 40 (0.2%) | 2 (0.2%) | 0 (0.0%) |
| 9 | 10 (0.1%) | 2 (0.2%) | 0 (0.0%) |
| ≥10 | 1276 (7.0%) | 128 (10.0%) | 28 (10.9%) |
| Multifocal disease | (n = 18 494) | (n = 1365) | (n = 262) |
| Single lobe | 14 952 (80.8%) | 1162 (85.1%) | 209 (79.8%) |
| Both lobes | 3542 (19.2%) | 203 (14.9%) | 53 (20.2%) |
| Hepatocellular carcinoma | (n = 17 574) | ||
| Morphological classification on imaging | |||
| Nodular | 15 622 (88.9%) | ||
| Massive | 1322 (7.5%) | ||
| Diffuse | 558 (3.2%) | ||
| Other | 72 (0.4%) | ||
| Intrahepatic cholangiocarcinoma | (n = 1163) | ||
| Morphological classification on imaging | |||
| Mass-forming type | 849 (73.0%) | ||
| Periductal infiltrating type | 120 (10.3%) | ||
| Intraductal growth type | 30 (2.6%) | ||
| Mass-forming type + periductal infiltrating type | 152 (13.1%) | ||
| Other | 12 (1.0%) | ||
| Arterial phase enhancement | (n = 17 636) | (n = 1200) | (n = 252) |
| No | 1234 (7.0%) | 693 (57.8%) | 38 (15.1%) |
| Yes | 16 402 (93.0%) | 507 (42.3%) | 214 (84.9%) |
| Venous phase washout | (n = 17 153) | (n = 1126) | (n = 245) |
| None | 1645 (9.6%) | 850 (75.5%) | 64 (26.1%) |
| Yes | 15 508 (90.4%) | 276 (24.5%) | 181 (73.9%) |
| Internal component of tumor | (n = 17 318) | (n = 1188) | (n = 247) |
| Solid | 17 063 (98.5%) | 1129 (95.0%) | 242 (98.0%) |
| Cystic | 255 (1.5%) | 59 (5.0%) | 5 (2.0%) |
- Note: For all parameters, n is the total number of patients, excluding those in the “unknown” category, and (%) is the percentage of n.
| Hepatocellular carcinoma | Intrahepatic cholangiocarcinoma | Combined hepatocellular cholangiocarcinoma | |
|---|---|---|---|
| Portal vein invasion by imaging | (n = 17 754) | (n = 1237) | (n = 252) |
| Image-Vp0 | 15 431 (86.9%) | 793 (64.1%) | 192 (76.2%) |
| Image-Vp1 | 704 (4.0%) | 140 (11.3%) | 21 (8.3%) |
| Image-Vp2 | 488 (2.7%) | 122 (9.9%) | 11 (4.4%) |
| Image-Vp3 | 593 (3.3%) | 136 (11.0%) | 11 (4.4%) |
| Image-Vp4 | 538 (3.0%) | 46 (3.7%) | 17 (6.7%) |
| Hepatic vein invasion by imaging | (n = 17 608) | (n = 1213) | (n = 251) |
| Image-Vv0 | 16 390 (93.1%) | 945 (77.9%) | 213 (84.9%) |
| Image-Vv1 | 546 (3.1%) | 117 (9.6%) | 20 (8.0%) |
| Image-Vv2 | 390 (2.2%) | 129 (10.6%) | 8 (3.2%) |
| Image-Vv3 | 282 (1.6%) | 22 (1.8%) | 10 (4.0%) |
| Bile duct invasion by imaging | (n = 17 503) | (n = 1204) | (n = 247) |
| Image-B0 | 16 787 (95.9%) | 665 (55.2%) | 211 (85.4%) |
| Image-B1 | 283 (1.6%) | 153 (12.7%) | 15 (6.1%) |
| Image-B2 | 216 (1.2%) | 145 (12.0%) | 11 (4.5%) |
| Image-B3 | 147 (0.8%) | 171 (14.2%) | 7 (2.8%) |
| Image-B4 | 70 (0.4%) | 70 (5.8%) | 3 (1.2%) |
| Tumor rupture | (n = 18 304) | (n = 1384) | (n = 261) |
| No rupture | 17 686 (96.6%) | 1380 (99.7%) | 256 (98.1%) |
| Suspected rupture | 134 (0.7%) | 2 (0.1%) | 0 (0.0%) |
| Rupture | 484 (2.6%) | 2 (0.1%) | 5 (1.9%) |
| Extrahepatic spread (EHS) | (n = 988) | (n = 479) | (n = 59) |
| Lung | 313 | 93 | 13 |
| Bone | 209 | 47 | 6 |
| Adrenal gland | 62 | 10 | 4 |
| Lymph node | 295 | 244 | 31 |
| Brain | 6 | 6 | 0 |
| Peritoneum | 63 | 61 | 2 |
| Other | 40 | 18 | 3 |
| Percentages not calculated as multiple choices were allowed | |||
| Esophageal/gastric varices | (n = 3393) | (n = 41) | (n = 35) |
| ≤F1 or RC(−) | 2220 (65.4%) | 31 (75.6%) | 27 (77.1%) |
| ≥F2 and RC(+) | 955 (28.1%) | 8 (19.5%) | 6 (17.1%) |
| Rupture | 218 (6.4%) | 2 (4.9%) | 2 (5.7%) |
| TNM stage by LCSGJ | (n = 16 864) | (n = 918) | (n = 129) |
| Stage I | 4018 (23.8%) | 79 (8.6%) | 24 (18.6%) |
| Stage II | 7154 (42.4%) | 348 (37.9%) | 55 (42.6%) |
| Stage III | 3850 (22.8%) | 231 (25.2%) | 34 (26.4%) |
| Stage IVA | 1419 (8.4%) | 52 (5.7%) | 12 (9.3%) |
| Stage IVB | 423 (2.5%) | 208 (22.7%) | 4 (3.1%) |
- Note: For all parameters, n is the total number of patients, excluding those in the “unknown” category, and (%) is the percentage of n.
- Abbreviations: B0, absence of invasion of the bile ducts; B1, invasion of (or tumor thrombus in) the third order or more peripheral branches of the bile duct, but not of second order branches; B2, invasion of (or tumor thrombus in) the second order branches of the bile duct; B3, invasion of (or tumor thrombus in) the first order branches of the bile duct; B4, invasion of (or tumor thrombus in) the common hepatic duct; F1, small varices; F2, moderate varices; RC, red color sign; Vp0, absence of invasion of (or tumor thrombus in) the portal vein; Vp1, invasion of (or tumor thrombus in) distal to the second order branches of the portal vein, but not of the second order branches; Vp2, invasion of (or tumor thrombus in) second order branches of the portal vein; Vp3, invasion of (or tumor thrombus in) first order branches of the portal vein; Vp4, invasion of (or tumor thrombus in) the main trunk of the portal vein and/or contra-lateral portal vein branch to the primarily involved lobe; Vv0, absence of invasion of (or tumor thrombus in) the hepatic vein; Vv1, invasion of (or tumor thrombus in) peripheral branches of the hepatic vein; Vv2, invasion of (or tumor thrombus in) the right, middle, or left hepatic vein, the inferior right hepatic vein, or the short hepatic vein; Vv3, invasion of (or tumor thrombus in) the inferior vena cava.
Initial treatment selection
The initial treatment modality for HCC was surgical intervention (resection or transplantation) in 41.8%, local ablation therapy in 19.4%, TACE in 25.4%, HAIC in 3.1%, and systemic chemotherapy in 1.2% of patients. For ICC, these figures were 56.3% for surgery (resection only) and 18.7% for systemic chemotherapy; for combined HCC and ICC, these figures were 71.1% for surgery (resection only), 8.0% for TACE, 2.7% for HAIC, and 7.6% for systemic chemotherapy (Table 10).
| Hepatocellular carcinoma | Intrahepatic cholangiocarcinoma | Combined hepatocellular cholangiocarcinoma | |
|---|---|---|---|
| Initial treatment method (summary) | (n = 18 786) | (n = 1448) | (n = 263) |
| Hepatectomy or liver transplantation | 7860 (41.8%) | 815 (56.3%) | 187 (71.1%) |
| Local ablation therapy (percutaneous ethanol injection, microwave coagulation, or radiofrequency ablation) | 3643 (19.4%) | 7 (0.5%) | 5 (1.9%) |
| Transcatheter arterial chemoembolization | 4775 (25.4%) | 21 (1.5%) | 21 (8.0%) |
| Hepatic arterial infusion chemotherapy | 589 (3.1%) | 7 (0.5%) | 7 (2.7%) |
| Systemic chemotherapy (oral or intravenous) | 217 (1.2%) | 271 (18.7%) | 20 (7.6%) |
| Other therapy | 184 (1.0%) | 22 (1.5%) | 2 (0.8%) |
| No therapy | 1518 (8.1%) | 305 (21.1%) | 21 (8.0%) |
The distribution of Child–Pugh grades (A/B/C) by treatment in patients with HCC was 91.4%/8.2%/0.5% for those who underwent surgery, 77.8%/20.9%/1.2% for those who underwent local ablation therapy, 67.2%/29.5%/3.3% for those who underwent TACE, 54.7%/38.9%/6.4% for those who underwent HAIC, and 71.3%/27.0%/1.6% for those who underwent systemic chemotherapy. The proportion with a Child–Pugh grade A was highest for surgery, and lower for local ablation therapy, systemic chemotherapy, TACE, and HAIC in that order (Table 11).
| Surgery | Local ablation therapy | TACE | HAIC | Systemic chemotherapy | Other therapy | No therapy | |
|---|---|---|---|---|---|---|---|
| Child–Pugh grade | n = 8610 | n = 3543 | n = 4578 | n = 579 | n = 492 | n = 193 | n = 1560 |
| A | 7867 (91.4%) | 2758 (77.8%) | 3077 (67.2%) | 317 (54.7%) | 351 (71.3%) | 137 (71.0%) | 521 (33.4%) |
| B | 703 (8.2%) | 742 (20.9%) | 1352 (29.5%) | 225 (38.9%) | 133 (27.0%) | 41 (21.2%) | 663 (42.5%) |
| C | 40 (0.5%) | 43 (1.2%) | 149 (3.3%) | 37 (6.4%) | 8 (1.6%) | 15 (7.8%) | 376 (24.1%) |
| mALBI grade | n = 8943 | n = 3675 | n = 4790 | n = 599 | n = 535 | n = 207 | n = 1844 |
| 1 | 3763 (42.1%) | 886 (24.1%) | 792 (16.5%) | 62 (10.4%) | 114 (21.3%) | 46 (22.2%) | 157 (8.5%) |
| 2a | 2542 (28.4%) | 905 (24.6%) | 1020 (21.3%) | 106 (17.7%) | 129 (24.1%) | 41 (19.8%) | 200 (10.8%) |
| 2b | 2386 (26.7%) | 1545 (42.0%) | 2222 (46.4%) | 283 (47.2%) | 232 (43.4%) | 77 (37.2%) | 647 (35.1%) |
| 3 | 252 (2.8%) | 339 (9.2%) | 756 (15.8%) | 148 (24.7%) | 60 (11.2%) | 43 (20.8%) | 840 (45.6%) |
- Abbreviations: HAIC, hepatic arterial infusion chemotherapy; mALBI, modified albumin-bilirubin; TACE, transcatheterarterial chemoembolization.
Surgery
A total of 7981 patients with HCC underwent hepatectomy (including 541 laparoscopic-assisted and 1203 laparoscopic surgeries), and 41 underwent liver transplantation (Table 12). The macroscopic classification of resected specimens for HCC was simple nodular type for 60.6%, simple nodular type with extranodular growth for 17.5%, and confluent multinodular type for 18.9% of patients. Small nodular type with indistinct margin, a pathological early HCC, was observed in 2.1% of patients. For ICC, the most common classification was mass-forming type at 72.3%, followed by periductal infiltrating type at 8.7% and intraductal growth type at 4.4% (Table 12). Table 13 summarizes macroscopic findings in resected specimens and operative findings.
| Resected hepatocellular carcinoma | Intrahepatic cholangiocarcinoma | Combined hepatocellular cholangiocarcinoma | |
|---|---|---|---|
| Surgery | (n = 7981) | (n = 823) | (n = 189) |
| Hepatectomy (open) | 6196 (77.6%) | 743 (90.3%) | 148 (78.3%) |
| Hepatectomy (laparoscopic-assisted) | 541 (6.8%) | 32 (3.9%) | 12 (6.3%) |
| Hepatectomy (laparoscopic) | 1203 (15.1%) | 48 (5.8%) | 28 (14.8%) |
| Liver transplantation | 41 (0.5%) | 0 (0.0%) | 1 (0.5%) |
| Macroscopic classification of hepatocellular carcinoma | (n = 5861) | ||
| Small nodular type with indistinct margin | 124 (2.1%) | ||
| Simple nodular type | 3554 (60.6%) | ||
| Simple nodular type with extranodular growth | 1028 (17.5%) | ||
| Confluent multinodular type | 1105 (18.9%) | ||
| Infiltrative type | 50 (0.9%) | ||
| Macroscopic classification of hepatocellular carcinoma (Eggel's classification) | (n = 1682) | ||
| Nodular | 1513 (90.0%) | ||
| Massive | 129 (7.7%) | ||
| Diffuse | 29 (1.7%) | ||
| Other | 11 (0.7%) | ||
| Macroscopic classification of intrahepatic cholangiocarcinoma | (n = 721) | ||
| Mass-forming type | 521 (72.3%) | ||
| Periductal infiltrating type | 62 (8.6%) | ||
| Intraductal growth type | 32 (4.4%) | ||
| Mix of mass-forming type and periductal infiltrating type | 78 (10.8%) | ||
| Mix of periductal infiltrating type and intraductal growth type | 6 (0.8%) | ||
| Mix of mass-forming type and intraductal growth type | 10 (1.4%) | ||
| Other | 12 (1.7%) | ||
| Maximum diameter of resected primary tumor | (n = 7749) | (n = 770) | (n = 183) |
| ≤1 cm | 263 (3.4%) | 9 (1.2%) | 3 (1.6%) |
| >1 cm to ≤2 cm | 1615 (20.8%) | 108 (14.0%) | 28 (15.3%) |
| >2 cm to ≤3 cm | 1864 (24.1%) | 172 (22.3%) | 40 (21.9%) |
| >3 cm to ≤5 cm | 1929 (24.9%) | 238 (30.9%) | 56 (30.6%) |
| >5 cm to ≤10 cm | 1511 (19.5%) | 210 (27.3%) | 47 (25.7%) |
| >10 cm to ≤15 cm | 434 (5.6%) | 27 (3.5%) | 8 (4.4%) |
| >15 cm to ≤20 cm | 112 (1.4%) | 5 (0.6%) | 1 (0.5%) |
| >20 cm to ≤25 cm | 16 (0.2%) | 1 (0.1%) | 0 (0.0%) |
| >25 cm | 5 (0.1%) | 0 (0.0%) | 0 (0.0%) |
| No. tumors resected | (n = 7791) | (n = 788) | (n = 185) |
| 1 | 6214 (79.8%) | 697 (88.5%) | 134 (72.4%) |
| 2 | 1032 (13.2%) | 48 (6.1%) | 32 (17.3%) |
| 3 | 289 (3.7%) | 13 (1.6%) | 10 (5.4%) |
| 4 | 88 (1.1%) | 5 (0.6%) | 3 (1.6%) |
| 5 | 44 (0.6%) | 4 (0.5%) | 1 (0.5%) |
| 6 | 13 (0.2%) | 2 (0.3%) | 3 (1.6%) |
| 7 | 10 (0.1%) | 2 (0.3%) | 0 (0.0%) |
| 8 | 4 (0.1%) | 0 (0.0%) | 0 (0.0%) |
| 9 | 2 (0.0%) | 0 (0.0%) | 0 (0.0%) |
| ≥10 | 95 (1.2%) | 17 (2.2%) | 2 (1.1%) |
- Note: For all parameters, n is the total number of patients, excluding those in the “unknown” category, and (%) is the percentage of n.
| Hepatocellular carcinoma | Intrahepatic cholangiocarcinoma | Combined hepatocellular cholangiocarcinoma | |
|---|---|---|---|
| Tumor distribution (1) | (n = 7648) | (n = 775) | (n = 180) |
| Hs | 3169 (41.4%) | 148 (19.1%) | 59 (32.8%) |
| H1 | 2392 (31.3%) | 280 (36.1%) | 52 (28.9%) |
| H2 | 1784 (23.3%) | 300 (38.7%) | 60 (33.3%) |
| H3 | 223 (2.9%) | 42 (5.4%) | 6 (3.3%) |
| H4 | 80 (1.0%) | 5 (0.6%) | 3 (1.7%) |
| Tumor distribution (2) | (n = 7684) | (n = 783) | (n = 185) |
| Localized to one lobe | 6842 (89.0%) | 702 (89.7%) | 153 (82.7%) |
| Both lobes | 842 (11.0%) | 81 (10.3%) | 32 (17.3%) |
| Growth pattern | (n = 7611) | (n = 760) | (n = 183) |
| Eg | 7090 (93.2%) | 383 (50.4%) | 138 (75.4%) |
| Ig | 521 (6.8%) | 377 (49.6%) | 45 (24.6%) |
| Extent of hepatectomy | (n = 7563) | (n = 783) | (n = 187) |
| Hr0 | 2401 (31.7%) | 75 (9.6%) | 55 (29.4%) |
| HrS | 1671 (22.1%) | 73 (9.3%) | 35 (18.7%) |
| Hr1 | 1883 (24.9%) | 141 (18.0%) | 43 (23.0%) |
| Hr2 | 1490 (19.7%) | 431 (55.0%) | 47 (25.1%) |
| Hr3 | 118 (1.6%) | 62 (7.9%) | 7 (3.7%) |
| Total hepatectomy | 0 (0.0%) | 1 (0.1%) | 0 (0.0%) |
| Bile duct resection | (n = 7516) | (n = 775) | (n = 185) |
| No | 7354 (97.8%) | 566 (73.0%) | 174 (94.1%) |
| Yes | 162 (2.2%) | 209 (27.0%) | 11 (5.9%) |
| Lymph node dissection | (n = 7494) | (n = 790) | (n = 186) |
| D (−) | 7388 (98.6%) | 422 (53.4%) | 167 (89.8%) |
| D (+) | 106 (1.4%) | 368 (46.6%) | 19 (10.2%) |
| Lymph nodes dissected | (n = 7442) | (n = 779) | (n = 184) |
| No | 7341 (98.6%) | 397 (51.0%) | 162 (88.0%) |
| Perihepatic only (up to #8a, 12abchp, 13a) | 81 (1.1%) | 319 (40.9%) | 15 (8.2%) |
| Outside of portal area | 20 (0.3%) | 63 (8.1%) | 7 (3.8%) |
| Residual cancer | (n = 7716) | (n = 791) | (n = 185) |
| No | 7471 (96.8%) | 740 (93.6%) | 176 (95.1%) |
| Yes | 245 (3.2%) | 51 (6.4%) | 9 (4.9%) |
| Extrahepatic metastasis | (n = 7757) | (n = 799) | (n = 188) |
| M0 | 7688 (99.1%) | 775 (97.0%) | 186 (98.9%) |
| M1 | 69 (0.9%) | 24 (3.0%) | 2 (1.1%) |
| TNM stage by LCSGJ | (n = 7028) | (n = 496) | (n = 116) |
| Stage I | 1323 (18.8%) | 50 (10.1%) | 15 (12.9%) |
| Stage II | 3557 (50.6%) | 137 (27.6%) | 44 (37.9%) |
| Stage III | 1625 (23.1%) | 181 (36.5%) | 44 (37.9%) |
| Stage IVA | 464 (6.6%) | 43 (8.7%) | 10 (8.6%) |
| Stage IVB | 59 (0.8%) | 85 (17.1%) | 3 (2.6%) |
| Curability: Hepatocellular carcinoma | (n = 7433) | ||
| A1 | 2468 (33.2%) | ||
| A2 | 2876 (38.7%) | ||
| B | 1723 (23.2%) | ||
| C | 366 (4.9%) | ||
| Curability: Intrahepatic cholangiocarcinoma | (n = 683) | ||
| A | 291 (42.6%) | ||
| B | 328 (48.0%) | ||
| C | 64 (9.4%) |
- Note: For all parameters, n is the total number of patients, excluding those in the “unknown” category, and (%) is the percentage of n.
- Abbreviations: D (−), dissection not performed; D (+), dissection performed; Eg, expansive growth, well demarcated border; Ig, infiltrative growth poorly demarcated border; F0, no fibrosis; F1, fibrous expansion of portal tract; F2, fibrous septa formation, usually incomplete; F3, bridging fibrosis formation accompanying lobular distinction; F4, cirrhosis; Hr0, resection of less than one subsegment (Couinaud's segment); Hs, cancer limited to one subsegment, H1, cancer limited to one segment; H2, cancer limited to two segments; H3, cancer limited to three segments; H4, cancer involving more than three segments; HrS, resection of one subsegment (Couinaud's segment); Hr1, resection of one segment (anterior, posterior, medial, or left lateral segmentectomy); Hr2, resection of two segments (right or left bisegmentectomy or central bisegmentectomy); Hr3, resection of three segments (right or left trisegmentectomy); lc, liver cirrhosis; nl, normal liver; TNM, tumor–node–metastasis.
- Curability: Hepatocellular carcinoma; A1, stage I and no cancer invasion at the surgical margin (SM); A2, stage II and SM (−); B, no residual cancer, but not met of criteria for A1 and A2; C, definite residual cancer.
- Curability: Intrahepatic cholangiocarcinoma; A, complete resection of stage I or II cancer without residual cancer; B, complete resection of stage III or stage IV cancer without residual cancer; C, incomplete resection with residual cancer.
Tumor diameter among patients who underwent hepatectomy for HCC was ≤2 cm in 24.2%, 2–5 cm in 49.0%, and 5–10 cm in 19.5%. The percentage with unifocal disease was 79.8% (Table 12). The type of surgery was Hr0 (limited resection) in 31.7%, HrS (1 subsegmentectomy) in 22.1%, Hr1 (1 segmentectomy) in 24.9%, Hr2 (2 segmentectomy) in 19.7%, and Hr3 (3 segmentectomy) in 1.6% of patients (Table 13). The stage of HCC was I in 18.8%, II in 50.6%, III in 23.1%, IVA in 6.6%, and IVB in 0.8% of patients (Table 13).
Among patients with ICC, tumor diameter was ≤2 cm in 15.2%, 2–5 cm in 53.1%, and 5–10 cm in 27.3% of patients, and 88.5% had unifocal disease (Table 12).
Local ablation therapy
Local ablation therapy was carried out in 4438 patients with HCC. Percutaneous ethanol injection therapy was performed in 3.8%, percutaneous microwave coagulation therapy in 3.8%, and radiofrequency ablation in 92.5% of patients. The treatment route was percutaneous in 89.6% of patients. The procedure was performed laparoscopically or thoracoscopically in 4.0%, and by laparotomy or thoracotomy in 5.7% of patients. The percentage with unifocal disease was 79.7%. Tumor diameter was ≤2 cm in 66.8%, 2–3 cm in 25.8%, and >3 cm in 7.4% of patients. The response assessed at 3 months after initiation of treatment was complete response (CR) in 83.5%, partial response (PR) in 68.7%, stable disease (SD) in 3.5%, and progressive disease (PD) in 6.1% of patients (Table 14).
| Hepatocellular carcinoma | Intrahepatic cholangiocarcinoma | Combined hepatocellular cholangiocarcinoma | |
|---|---|---|---|
| Treatment | (n = 4438) | (n = 15) | (n = 11) |
| Percutaneous ethanol injection therapy | 106 (2.4%) | 2 (13.3%) | 0 (0.0%) |
| Percutaneous microwave coagulation therapy | 167 (3.8%) | 2 (13.3%) | 2 (18.2%) |
| Radiofrequency ablation | 4105 (92.5%) | 9 (60.0%) | 7 (63.6%) |
| Other | 60 (1.4%) | 2 (13.3%) | 2 (18.2%) |
| Purpose of treatment | (n = 4436) | (n = 15) | (n = 11) |
| Curative | 4286 (96.6%) | 12 (80.0%) | 7 (63.6%) |
| Palliative | 150 (3.4%) | 3 (20.0%) | 4 (36.4%) |
| Treatment route | (n = 4422) | (n = 15) | (n = 11) |
| Percutaneous | 3960 (89.6%) | 11 (73.3%) | 7 (63.6%) |
| Laparoscopic or thoracoscopic | 176 (4.0%) | 0 (0.0%) | 1 (9.1%) |
| Laparotomy or thoracotomy | 253 (5.7%) | 3 (20.0%) | 1 (9.1%) |
| Combination of percutaneous and laparotomy | 12 (0.3%) | 0 (0.0%) | 0 (0.0%) |
| Other | 21 (0.5%) | 1 (6.7%) | 2 (18.2%) |
| Combination with other treatment | (n = 1379) | (n = 3) | (n = 5) |
| Transcatheter arterial chemoembolization | 1278 (92.7%) | 2 (66.7%) | 2 (40.0%) |
| Other | 101 (7.3%) | 1 (33.3%) | 3 (60.0%) |
| Complications (multiple choices allowed) | (n = 80) | (n = 0) | (n = 0) |
| Hemorrhage (hemobilia or hematoma) | 29 | 0 | 0 |
| Gastrointestinal perforation or penetration | 0 | 0 | 0 |
| Bile duct injury | 3 | 0 | 0 |
| Abscess | 4 | 0 | 0 |
| Extrahepatic dissemination | 1 | 0 | 0 |
| Hepatic infarction | 8 | 0 | 0 |
| Liver failure | 3 | 0 | 0 |
| Other | 32 | 0 | 0 |
| Percentages not calculated as multiple choices were allowed | |||
| No. tumors treated | (n = 4329) | (n = 14) | (n = 11) |
| 1 | 3451 (79.7%) | 12 (85.7%) | 7 (63.6%) |
| 2 | 658 (15.2%) | 1 (7.1%) | 2 (18.2%) |
| 3 | 155 (3.6%) | 1 (7.1%) | 1 (9.1%) |
| 4 | 39 (0.9%) | 0 (0.0%) | 1 (9.1%) |
| 5 | 17 (0.4%) | 0 (0.0%) | 0 (0.0%) |
| 6 | 5 (0.1%) | 0 (0.0%) | 0 (0.0%) |
| 7 | 2 (0.0%) | 0 (0.0%) | 0 (0.0%) |
| 8 | 1 (0.0%) | 0 (0.0%) | 0 (0.0%) |
| 9 | 0 (0.0%) | 0 (0.0%) | 0 (0.0%) |
| ≥10 | 1 (0.0%) | 0 (0.0%) | 0 (0.0%) |
| Maximum diameter of treated tumors | (n = 4224) | (n = 12) | (n = 10) |
| ≤1 cm | 570 (13.5%) | 2 (16.7%) | 2 (20.0%) |
| >1 cm to ≤2 cm | 2251 (53.3%) | 5 (41.7%) | 5 (50.0%) |
| >2 cm to ≤3 cm | 1091 (25.8%) | 4 (33.3%) | 1 (10.0%) |
| >3 cm to ≤5 cm | 272 (6.4%) | 0 (0.0%) | 2 (20.0%) |
| >5 cm to ≤10 cm | 28 (0.7%) | 1 (8.3%) | 0 (0.0%) |
| >10 cm to ≤15 cm | 7 (0.2%) | 0 (0.0%) | 0 (0.0%) |
| >15 cm to ≤20 cm | 5 (0.1%) | 0 (0.0%) | 0 (0.0%) |
| >20 cm to ≤25 cm | 0 (0.0%) | 0 (0.0%) | 0 (0.0%) |
| >25 cm | 0 (0.0%) | 0 (0.0%) | 0 (0.0%) |
| Direct response assessment | (n = 3969) | (n = 11) | (n = 9) |
| TE4a | 3067 (77.3%) | 6 (54.5%) | 6 (66.7%) |
| TE4b | 614 (15.5%) | 1 (9.1%) | 1 (11.1%) |
| TE3 | 173 (4.4%) | 3 (27.3%) | 2 (22.2%) |
| TE2 | 85 (2.1%) | 1 (9.1%) | 0 (0.0%) |
| TE1 | 30 (0.8%) | 0 (0.0%) | 0 (0.0%) |
| AFP value before therapy (ng/mL) | (n = 4342) | (n = 12) | (n = 11) |
| <10 | 2146 (49.4%) | 9 (75.0%) | 5 (45.5%) |
| ≤199 | 1813 (41.8%) | 2 (16.7%) | 3 (27.3%) |
| ≤399 | 147 (3.4%) | 0 (0.0%) | 0 (0.0%) |
| ≤999 | 104 (2.4%) | 1 (8.3%) | 0 (0.0%) |
| ≤9999 | 110 (2.5%) | 0 (0.0%) | 1 (9.1%) |
| ≤99 999 | 21 (0.5%) | 0 (0.0%) | 2 (18.2%) |
| ≥100 000 | 1 (0.0%) | 0 (0.0%) | 0 (0.0%) |
| Overall response at 1–3 months | (n = 3492) | (n = 12) | (n = 8) |
| CR | 2917 (83.5%) | 5 (41.7%) | 5 (62.5%) |
| PR | 239 (6.8%) | 5 (41.7%) | 0 (0.0%) |
| SD | 122 (3.5%) | 1 (8.3%) | 1 (12.5%) |
| PD | 214 (6.1%) | 1 (8.3%) | 2 (25.0%) |
| Overall response at 6 months | (n = 3384) | (n = 10) | (n = 8) |
| CR | 2715 (80.2%) | 4 (40.0%) | 3 (37.5%) |
| PR | 192 (5.7%) | 2 (20.0%) | 1 (12.5%) |
| SD | 102 (3.0%) | 3 (30.0%) | 1 (12.5%) |
| PD | 375 (11.1%) | 1 (10.0%) | 3 (37.5%) |
- Note: For all parameters, n is the total number of patients, excluding those in the “unknown” category, and (%) is the percentage of n.
- Abbreviations: CR, complete response; PD, progressive disease; PR, partial response; SD, stable disease; TE1, treatment effect in target lesion (progressive disease); TE2, treatment effect in target lesion (stable disease), TE3, treatment effect in target lesion (partial response); TE4a; treatment effect in target lesion (complete response with ablative margin); TE4b, treatment effect in target lesion (complete response without ablative margin).
TACE
TACE was carried out in 6117 patients with HCC. Lipiodol alone was used in 12.8%, gelatin sponge alone in 6.9%, lipiodol plus gelatin sponge particles in 69.6%, and drug-eluting bead in 10.7% of patients. The area of embolization was less than one segment in 37.4%, at least one segment but less than one lobe in 39.2%, one lobe or more in 17.7%, and the entire liver in 5.7% of patients. The response assessed at 3 months after initiation of treatment was CR in 36.0%, PR in 21.1%, SD in 17.8%, and PD in 25.0% of patients. TACE was carried out in 28 patients with ICC (Tables 15 and 16).
| Hepatocellular carcinoma | Intrahepatic cholangiocarcinoma | Combined hepatocellular cholangiocarcinoma | |
|---|---|---|---|
| Transarterial therapy | (n = 17 049) | (n = 1131) | (n = 237) |
| Not performed | 10 294 (60.4%) | 1096 (96.9%) | 198 (83.5%) |
| Performed | 6755 (39.6%) | 35 (3.1%) | 39 (16.5%) |
| Transcatheter arterial chemoembolization (if transarterial therapy was performed) | (n = 6745) | (n = 35) | (n = 39) |
| Not performed | 628 (9.3%) | 7 (20.0%) | 11 (28.2%) |
| Performed (TACE) | 6117 (90.7%) | 28 (80.0%) | 28 (71.8%) |
| Embolic agent | (n = 5919) | (n = 25) | (n = 26) |
| Lipiodol alone | 758 (12.8%) | 2 (8.0%) | 2 (7.7%) |
| Gelatin sponge alone | 407 (6.9%) | 2 (8.0%) | 3 (11.5%) |
| Lipiodol + gelatin sponge particles | 4118 (69.6%) | 17 (68.0%) | 17 (65.4%) |
| Beads | 636 (10.7%) | 4 (16.0%) | 4 (15.4%) |
| Combination with chemotherapy agents (multiple choices allowed) | (n = 7418) | (n = 42) | (n = 39) |
| Doxorubicin | 170 | 0 | 0 |
| Epirubicin | 3293 | 14 | 15 |
| Mitomycin | 820 | 3 | 3 |
| Cisplatin | 1366 | 15 | 12 |
| SMANCS | 1 | 0 | 0 |
| Miriplatin | 1369 | 3 | 6 |
| 5FU | 309 | 4 | 2 |
| Interferon | 14 | 1 | 0 |
| Other | 76 | 2 | 1 |
| Percentages not calculated as multiple choices were allowed | |||
| Area of embolization (enter treated area if embolization was not performed) | (n = 6353) | (n = 30) | (n = 37) |
| <1 segment | 2375 (37.4%) | 7 (23.3%) | 11 (29.7%) |
| ≥1 segment to <1 lobe | 2492 (39.2%) | 15 (50.0%) | 11 (29.7%) |
| ≥1 lobe to <entire liver | 1123 (17.7%) | 5 (16.7%) | 5 (13.5%) |
| Entire liver | 363 (5.7%) | 3 (10.0%) | 10 (27.0%) |
| Transarterial therapy Complications | (n = 166) | (n = 1) | (n = 0) |
| Acute cholecystitis | 8 | 0 | 0 |
| Biloma | 9 | 0 | 0 |
| Hepatic abscess | 23 | 1 | 0 |
| Hepatic infarction | 5 | 0 | 0 |
| Liver failure | 16 | 0 | 0 |
| Tumor rupture | 7 | 0 | 0 |
| Gastrointestinal hemorrhage | 6 | 0 | 0 |
| Pulmonary infarction | 1 | 0 | 0 |
| Spinal cord injury | 0 | 0 | 0 |
| Other | 91 | 0 | 0 |
| Percentages not calculated as multiple choices were allowed | |||
| Direct response assessment | (n = 5530) | (n = 27) | (n = 31) |
| TE4a | 822 (14.9%) | 2 (7.4%) | 2 (6.5%) |
| TE4b | 1352 (24.4%) | 4 (14.8%) | 4 (12.9%) |
| TE3 | 1547 (28.0%) | 8 (29.6%) | 7 (22.6%) |
| TE2 | 1370 (24.8%) | 9 (33.3%) | 13 (41.9%) |
| TE1 | 439 (7.9%) | 4 (14.8%) | 5 (16.1%) |
- Note: For all parameters, n is the total number of patients, excluding those in the “unknown” category, and (%) is the percentage of n.
- Abbreviations: 5FU, 5-fluorouracil; SMANCS, styrene maleic acid neocarzinostatin; TACE, transcatheterarterial chemoembolization; TE1, treatment effect in target lesion (progressive disease); TE2, treatment effect in target lesion (stable disease), TE3, treatment effect in target lesion (partial response); TE4a; treatment effect in target lesion (complete response with ablative margin); TE4b, treatment effect in target lesion (complete response without ablative margin).
| Hepatocellular carcinoma | Intrahepatic cholangiocarcinoma | Combined hepatocellular cholangiocarcinoma | |
|---|---|---|---|
| AFP value before therapy(ng/mL) | (n = 6554) | (n = 30) | (n = 38) |
| <10 | 2490 (38.0%) | 21 (70.0%) | 9 (23.7%) |
| ≤199 | 2463 (37.6%) | 6 (20.0%) | 15 (39.5%) |
| ≤399 | 308 (4.7%) | 1 (3.3%) | 1 (2.6%) |
| ≤999 | 349 (5.3%) | 0 (0.0%) | 3 (7.9%) |
| ≤9999 | 540 (8.2%) | 2 (6.7%) | 7 (18.4%) |
| ≤99 999 | 289 (4.4%) | 0 (0.0%) | 3 (7.9%) |
| ≥100 000 | 115 (1.8%) | 0 (0.0%) | 0 (0.0%) |
| First AFP value after therapy (ng/mL) | (n = 5423) | (n = 20) | (n = 32) |
| <10 | 2630 (48.5%) | 13 (65.0%) | 13 (40.6%) |
| ≤199 | 1845 (34.0%) | 3 (15.0%) | 8 (25.0%) |
| ≤399 | 203 (3.7%) | 3 (15.0%) | 3 (9.4%) |
| ≤999 | 193 (3.6%) | 0 (0.0%) | 1 (3.1%) |
| ≤9999 | 306 (5.6%) | 1 (5.0%) | 5 (15.6%) |
| ≤99 999 | 173 (3.2%) | 0 (0.0%) | 2 (6.3%) |
| ≥100 000 | 73 (1.3%) | 0 (0.0%) | 0 (0.0%) |
| AFP-L3 fraction before therapy (%) | (n = 3451) | (n = 15) | (n = 24) |
| <5.0 | 1514 (43.9%) | 6 (40.0%) | 8 (33.3%) |
| <10.0 | 567 (16.4%) | 1 (6.7%) | 3 (12.5%) |
| ≤14.9 | 230 (6.7%) | 0 (0.0%) | 0 (0.0%) |
| ≤19.9 | 140 (4.1%) | 0 (0.0%) | 1 (4.2%) |
| ≥20.0 | 1000 (29.0%) | 8 (53.3%) | 12 (50.0%) |
| Overall response at 1–3 months | (n = 4727) | (n = 21) | (n = 26) |
| CR | 1704 (36.0%) | 5 (23.8%) | 7 (26.9%) |
| PR | 997 (21.1%) | 6 (28.6%) | 2 (7.7%) |
| SD | 843 (17.8%) | 1 (4.8%) | 5 (19.2%) |
| PD | 1183 (25.0%) | 9 (42.9%) | 12 (46.2%) |
| Overall response at 6 months | (n = 4167) | (n = 20) | (n = 21) |
| CR | 1531 (36.7%) | 5 (25.0%) | 4 (19.0%) |
| PR | 658 (15.8%) | 5 (25.0%) | 4 (19.0%) |
| SD | 526 (12.6%) | 1 (5.0%) | 2 (9.5%) |
| PD | 1452 (34.8%) | 9 (45.0%) | 11 (52.4%) |
- Note: For all parameters, n is the total number of patients, excluding those in the “unknown” category, and (%) is the percentage of n.
- Abbreviations: AFP, α-fetoprotein; AFP-L3, lectin-reactive α-fetoprotein; CR, complete response; PD, progressive disease; PR, partial response; SD, stable disease.
HAIC
-
One-shot hepatic arterial infusion chemotherapy
One-shot HAIC was carried out in 207 patients. The area of treatment was less than one segment in 15.3%, at least one segment but less than one lobe in 26.0%, one lobe or more in 30.5%, and the entire liver in 28.2% of patients. The response assessed at 3 months after initiation of treatment was CR in 9.2%, PR in 9.2%, SD in 29.2%, and PD in 52.3% of patients (Tables 17 and 18).
-
Continuous hepatic arterial infusion chemotherapy using a reservoir (implanted port system)
| Hepatocellular carcinoma | Intrahepatic cholangiocarcinoma | Combined hepatocellular cholangiocarcinoma | |
|---|---|---|---|
| One-shot hepatic arterial infusion chemotherapy | (n = 207) | (n = 0) | (n = 1) |
| Performed | 207 (100.0%) | 0 (0.0%) | 1 (100.0%) |
| Combination with chemotherapy agents (multiple choices allowed) | (n = 265) | (n = 0) | (n = 1) |
| Doxorubicin | 4 | 0 | 0 |
| Epirubicin | 37 | 0 | 0 |
| Mitomycin | 34 | 0 | 0 |
| Cisplatin | 141 | 0 | 1 |
| SMANCS | 0 | 0 | 0 |
| Miriplatin | 21 | 0 | 0 |
| 5FU | 19 | 0 | 0 |
| Interferon | 0 | 0 | 0 |
| Other | 9 | 0 | 0 |
| Percentages not calculated as multiple choices were allowed | |||
| Area of treatment | (n = 177) | (n = 0) | (n = 1) |
| <1 segment | 27 (15.3%) | 0 (0.0%) | 0 (0.0%) |
| ≥1 segment to <1 lobe | 46 (26.0%) | 0 (0.0%) | 0 (0.0%) |
| ≥1 lobe to <entire liver | 54 (30.5%) | 0 (0.0%) | 0 (0.0%) |
| Entire liver | 50 (28.2%) | 0 (0.0%) | 1 (100.0%) |
| One-shot hepatic arterial infusion chemotherapy Complications | (n = 7) | (n = 0) | (n = 0) |
| Acute cholecystitis | 0 | 0 | 0 |
| Biloma | 0 | 0 | 0 |
| Hepatic abscess | 0 | 0 | 0 |
| Hepatic infarction | 0 | 0 | 0 |
| Liver failure | 1 | 0 | 0 |
| Tumor rupture | 1 | 0 | 0 |
| Gastrointestinal hemorrhage | 0 | 0 | 0 |
| Pulmonary infarction | 0 | 0 | 0 |
| Spinal cord injury | 0 | 0 | 0 |
| Other | 5 | 0 | 0 |
| Percentages not calculated as multiple choices were allowed | |||
| Direct response assessment | (n = 147) | (n = 0) | (n = 1) |
| TE4a | 5 (3.4%) | 0 (0.0%) | 0 (0.0%) |
| TE4b | 8 (5.4%) | 0 (0.0%) | 0 (0.0%) |
| TE3 | 10 (6.8%) | 0 (0.0%) | 0 (0.0%) |
| TE2 | 77 (52.4%) | 0 (0.0%) | 1 (100.0%) |
| TE1 | 47 (32.0%) | 0 (0.0%) | 0 (0.0%) |
- Note: For all parameters, n is the total number of patients, excluding those in the “unknown” category, and (%) is the percentage of n.
- Abbreviations: 5FU, 5-fluorouracil; SMANCS, styrene maleic acid neocarzinostatin; TACE, transcatheterarterial chemoembolization; TE1, treatment effect in target lesion (progressive disease); TE2, treatment effect in target lesion (stable disease), TE3, treatment effect in target lesion (partial response); TE4a; treatment effect in target lesion (complete response with ablative margin); TE4b, treatment effect in target lesion (complete response without ablative margin).
| Hepatocellular carcinoma | Intrahepatic cholangiocarcinoma | Combined hepatocellular cholangiocarcinoma | |
|---|---|---|---|
| AFP value before therapy (ng/mL) | (n = 197) | (n = 0) | (n = 1) |
| <10 | 38 (19.3%) | 0 (0.0%) | 0 (0.0%) |
| ≤199 | 60 (30.5%) | 0 (0.0%) | 1 (100.0%) |
| ≤399 | 5 (2.5%) | 0 (0.0%) | 0 (0.0%) |
| ≤999 | 15 (7.6%) | 0 (0.0%) | 0 (0.0%) |
| ≤9999 | 29 (14.7%) | 0 (0.0%) | 0 (0.0%) |
| ≤99 999 | 34 (17.3%) | 0 (0.0%) | 0 (0.0%) |
| ≥100 000 | 16 (8.1%) | 0 (0.0%) | 0 (0.0%) |
| First AFP value after therapy (ng/mL) | (n = 162) | (n = 0) | (n = 1) |
| <10 | 34 (21.0%) | 0 (0.0%) | 0 (0.0%) |
| ≤199 | 41 (25.3%) | 0 (0.0%) | 1 (100.0%) |
| ≤399 | 14 (8.6%) | 0 (0.0%) | 0 (0.0%) |
| ≤999 | 13 (8.0%) | 0 (0.0%) | 0 (0.0%) |
| ≤9999 | 20 (12.3%) | 0 (0.0%) | 0 (0.0%) |
| ≤99 999 | 22 (13.6%) | 0 (0.0%) | 0 (0.0%) |
| ≥100 000 | 18 (11.1%) | 0 (0.0%) | 0 (0.0%) |
| AFP-L3 fraction before therapy (%) | (n = 112) | (n = 0) | (n = 1) |
| <5.0 | 26 (23.2%) | 0 (0.0%) | 0 (0.0%) |
| <10.0 | 8 (7.1%) | 0 (0.0%) | 0 (0.0%) |
| ≤14.9 | 7 (6.3%) | 0 (0.0%) | 0 (0.0%) |
| ≤19.9 | 4 (3.6%) | 0 (0.0%) | 0 (0.0%) |
| ≥20.0 | 67 (59.8%) | 0 (0.0%) | 1 (100.0%) |
| Overall response at 1–3 months | (n = 130) | (n = 0) | (n = 0) |
| CR | 12 (9.2%) | 0 (0.0%) | 0 (0.0%) |
| PR | 12 (9.2%) | 0 (0.0%) | 0 (0.0%) |
| SD | 38 (29.2%) | 0 (0.0%) | 0 (0.0%) |
| PD | 68 (52.3%) | 0 (0.0%) | 0 (0.0%) |
| Overall response at 6 months | (n = 99) | (n = 0) | (n = 0) |
| CR | 11 (11.1%) | 0 (0.0%) | 0 (0.0%) |
| PR | 7 (7.1%) | 0 (0.0%) | 0 (0.0%) |
| SD | 16 (16.2%) | 0 (0.0%) | 0 (0.0%) |
| PD | 65 (65.7%) | 0 (0.0%) | 0 (0.0%) |
- Note: For all parameters, n is the total number of patients, excluding those in the “unknown” category, and (%) is the percentage of n.
- Abbreviations: AFP, α-fetoprotein; AFP-L3, lectin-reactive α-fetoprotein; CR, complete response; PD, progressive disease; PR, partial response; SD, stable disease.
Continuous HAIC was performed via a catheter in 221 patients. The area of treatment was less than one segment in 11.9%, at least one segment but less than one lobe in 17.9%, one lobe or more in 20.9%, and the entire liver in 49.3% of patients. The response assessed at 3 months after initiation of treatment was CR in 3.7%, PR in 23.8%, SD in 28.7%, and PD in 43.9% of patients (Tables 19 and 20).
| Hepatocellular carcinoma | Intrahepatic cholangiocarcinoma | Combined hepatocellular cholangiocarcinoma | |
|---|---|---|---|
| Hepatic arterial infusion chemotherapy using a reservoir | (n = 221) | (n = 0) | (n = 0) |
| Performed | 221 (100.0%) | 0 (0.0%) | 0 (0.0%) |
| Combination with chemotherapy agents (multiple choices allowed) | (n = 403) | (n = 0) | (n = 0) |
| Doxorubicin | 0 | 0 | 0 |
| Epirubicin | 3 | 0 | 0 |
| Mitomycin | 2 | 0 | 0 |
| Cisplatin | 195 | 0 | 0 |
| SMANCS | 0 | 0 | 0 |
| Miriplatin | 4 | 0 | 0 |
| 5FU | 183 | 0 | 0 |
| Interferon | 11 | 0 | 0 |
| Other | 5 | 0 | 0 |
| Percentages not calculated as multiple choices were allowed | |||
| Treated area | (n = 134) | (n = 0) | (n = 0) |
| <1 segment | 16 (11.9%) | 0 (0.0%) | 0 (0.0%) |
| ≥1 segment to <1 lobe | 24 (17.9%) | 0 (0.0%) | 0 (0.0%) |
| ≥1 lobe to <entire liver | 28 (20.9%) | 0 (0.0%) | 0 (0.0%) |
| Entire liver | 66 (49.3%) | 0 (0.0%) | 0 (0.0%) |
| Hepatic arterial infusion chemotherapy using a reservoir Complications | (n = 21) | (n = 0) | (n = 0) |
| Acute cholecystitis | 1 | 0 | 0 |
| Biloma | 0 | 0 | 0 |
| Hepatic abscess | 0 | 0 | 0 |
| Hepatic infarction | 1 | 0 | 0 |
| Liver failure | 3 | 0 | 0 |
| Tumor rupture | 1 | 0 | 0 |
| Gastrointestinal hemorrhage | 1 | 0 | 0 |
| Pulmonary infarction | 0 | 0 | 0 |
| Spinal cord injury | 0 | 0 | 0 |
| Other | 14 | 0 | 0 |
| Percentages not calculated as multiple choices were allowed | |||
| Direct response assessment | (n = 168) | (n = 0) | (n = 0) |
| TE4a | 1 (0.6%) | 0 (0.0%) | 0 (0.0%) |
| TE4b | 5 (3.0%) | 0 (0.0%) | 0 (0.0%) |
| TE3 | 27 (16.1%) | 0 (0.0%) | 0 (0.0%) |
| TE2 | 97 (57.7%) | 0 (0.0%) | 0 (0.0%) |
| TE1 | 38 (22.6%) | 0 (0.0%) | 0 (0.0%) |
- Note: For all parameters, n is the total number of patients, excluding those in the “unknown” category, and (%) is the percentage of n.
- Abbreviations: 5FU, 5-fluorouracil; SMANCS, styrene maleic acid neocarzinostatin; TACE, transcatheterarterial chemoembolization; TE1, treatment effect in target lesion (progressive disease); TE2, treatment effect in target lesion (stable disease), TE3, treatment effect in target lesion (partial response); TE4a; treatment effect in target lesion (complete response with ablative margin); TE4b, treatment effect in target lesion (complete response without ablative margin).
| AFP value before therapy (ng/ml) | (n = 215) | (n = 0) | (n = 0) |
| <10 | 28 (13.0%) | 0 (0.0%) | 0 (0.0%) |
| ≤199 | 60 (27.9%) | 0 (0.0%) | 0 (0.0%) |
| ≤399 | 21 (9.8%) | 0 (0.0%) | 0 (0.0%) |
| ≤999 | 14 (6.5%) | 0 (0.0%) | 0 (0.0%) |
| ≤9999 | 37 (17.2%) | 0 (0.0%) | 0 (0.0%) |
| ≤99 999 | 36 (16.7%) | 0 (0.0%) | 0 (0.0%) |
| ≥100 000 | 19 (8.8%) | 0 (0.0%) | 0 (0.0%) |
| First AFP value after therapy (ng/mL) | (n = 185) | (n = 0) | (n = 0) |
| <10 | 22 (11.9%) | 0 (0.0%) | 0 (0.0%) |
| ≤199 | 69 (37.3%) | 0 (0.0%) | 0 (0.0%) |
| ≤399 | 14 (7.6%) | 0 (0.0%) | 0 (0.0%) |
| ≤999 | 9 (4.9%) | 0 (0.0%) | 0 (0.0%) |
| ≤9999 | 34 (18.4%) | 0 (0.0%) | 0 (0.0%) |
| ≤99 999 | 24 (13.0%) | 0 (0.0%) | 0 (0.0%) |
| ≥100 000 | 13 (7.0%) | 0 (0.0%) | 0 (0.0%) |
| AFP-L3 fraction before therapy (%) | (n = 134) | (n = 0) | (n = 0) |
| <5.0 | 22 (16.4%) | 0 (0.0%) | 0 (0.0%) |
| <10.0 | 13 (9.7%) | 0 (0.0%) | 0 (0.0%) |
| ≤14.9 | 7 (5.2%) | 0 (0.0%) | 0 (0.0%) |
| ≤19.9 | 10 (7.5%) | 0 (0.0%) | 0 (0.0%) |
| ≥20.0 | 82 (61.2%) | 0 (0.0%) | 0 (0.0%) |
| Overall response at 1–3 months | (n = 164) | (n = 0) | (n = 0) |
| CR | 6 (3.7%) | 0 (0.0%) | 0 (0.0%) |
| PR | 39 (23.8%) | 0 (0.0%) | 0 (0.0%) |
| SD | 47 (28.7%) | 0 (0.0%) | 0 (0.0%) |
| PD | 72 (43.9%) | 0 (0.0%) | 0 (0.0%) |
| Overall response at 6 months | (n = 122) | (n = 0) | (n = 0) |
| CR | 8 (6.6%) | 0 (0.0%) | 0 (0.0%) |
| PR | 28 (23.0%) | 0 (0.0%) | 0 (0.0%) |
| SD | 26 (21.3%) | 0 (0.0%) | 0 (0.0%) |
| PD | 60 (49.2%) | 0 (0.0%) | 0 (0.0%) |
- Note: For all parameters, n is the total number of patients, excluding those in the “unknown” category, and (%) is the percentage of n.
- Abbreviations: AFP, α-fetoprotein; AFP-L3, lectin-reactive α-fetoprotein; CR, complete response; PD, progressive disease; PR, partial response; SD, stable disease.
Systemic chemotherapy (molecular targeted therapy)
The proportion of patients who underwent chemotherapy was higher in the 19th and earlier surveys, because HAIC was included under the category of chemotherapy at that time. Starting in the 20th survey, HAIC was placed in its own category separate from systemic chemotherapy and also divided into subcategories by whether or not a reservoir was used. Systemic chemotherapy was carried out in 423 patients with HCC. The route of administration was intravenous in 9.7% and oral in 90.3% of patients. Sorafenib was approved in Japan in May 2009, and the number of patients treated with sorafenib (354 patients) was the highest in this 23rd survey (2014–2015) than in any previous survey. The response assessed at 3 months after initiation of systemic chemotherapy was CR in 6.4%, PR in 9.9%, SD in 27.1%, and PD in 56.7% of patients. The response assessed at 6 months was CR in 7.0%, PR in 9.3%, SD in 19.0%, and PD in 64.7% of patients. Systemic chemotherapy was carried out in 363 patients with ICC. The route of administration was intravenous in 79.9% and oral in 20.1% of patients. The response assessed at 3 months after initiation of treatment was CR in 8.8%, PR in 11.3%, SD in 29.6%, and PD in 50.4% of patients. The response assessed at 6 months was CR in 10.0%, PR in 5.0%, SD in 25.0%, and PD in 60.0% of patients (Table 21).
| Hepatocellular carcinoma | Intrahepatic cholangiocarcinoma | Combined hepatocellular cholangiocarcinoma | |
|---|---|---|---|
| Systemic chemotherapy route of administration | (n = 423) | (n = 363) | (n = 32) |
| Intravenous | 41 (9.7%) | 290 (79.9%) | 9 (28.1%) |
| Oral | 382 (90.3%) | 73 (20.1%) | 23 (71.9%) |
| Chemotherapy agent | (n = 461) | (n = 587) | (n = 38) |
| Doxorubicin | 1 | 0 | 0 |
| Epirubicin | 4 | 0 | 0 |
| Mitomycin | 2 | 0 | 0 |
| Cisplatin | 27 | 199 | 6 |
| 5FU | 26 | 18 | 2 |
| Interferon | 1 | 0 | 0 |
| Sorafenib | 354 | 6 | 15 |
| Gemcitabine | 5 | 271 | 8 |
| Lenvatinib | 0 | 0 | 0 |
| Regorafenib | 0 | 0 | 0 |
| Other | 41 | 93 | 7 |
| Percentages not calculated as multiple choices were allowed | |||
| AFP value before therapy (ng/mL) | (n = 423) | (n = 260) | (n = 31) |
| <10 | 97 (22.9%) | 203 (78.1%) | 8 (25.8%) |
| ≤199 | 121 (28.6%) | 44 (16.9%) | 9 (29.0%) |
| ≤399 | 21 (5.0%) | 5 (1.9%) | 1 (3.2%) |
| ≤999 | 40 (9.5%) | 2 (0.8%) | 2 (6.5%) |
| ≤9999 | 63 (14.9%) | 5 (1.9%) | 9 (29.0%) |
| ≤99 999 | 56 (13.2%) | 1 (0.4%) | 2 (6.5%) |
| ≥100 000 | 25 (5.9%) | 0 (0.0%) | 0 (0.0%) |
| First AFP value after therapy (ng/mL) | (n = 344) | (n = 55) | (n = 22) |
| <10 | 93 (27.0%) | 29 (52.7%) | 6 (27.3%) |
| ≤199 | 98 (28.5%) | 19 (34.5%) | 7 (31.8%) |
| ≤399 | 17 (4.9%) | 3 (5.5%) | 3 (13.6%) |
| ≤999 | 26 (7.6%) | 1 (1.8%) | 2 (9.1%) |
| ≤9999 | 52 (15.1%) | 3 (5.5%) | 2 (9.1%) |
| ≤99 999 | 38 (11.0%) | 0 (0.0%) | 2 (9.1%) |
| ≥100 000 | 20 (5.8%) | 0 (0.0%) | 0 (0.0%) |
| AFP-L3 fraction before therapy (%) | (n = 214) | (n = 54) | (n = 16) |
| <5.0 | 54 (25.2%) | 29 (53.7%) | 2 (12.5%) |
| <10.0 | 16 (7.5%) | 6 (11.1%) | 1 (6.3%) |
| ≤14.9 | 17 (7.9%) | 2 (3.7%) | 1 (6.3%) |
| ≤19.9 | 9 (4.2%) | 3 (5.6%) | 1 (6.3%) |
| ≥20.0 | 118 (55.1%) | 14 (25.9%) | 11 (68.8%) |
| Overall response at 1–3 months | (n = 314) | (n = 274) | (n = 24) |
| CR | 20 (6.4%) | 24 (8.8%) | 2 (8.3%) |
| PR | 31 (9.9%) | 31 (11.3%) | 0 (0.0%) |
| SD | 85 (27.1%) | 81 (29.6%) | 6 (25.0%) |
| PD | 178 (56.7%) | 138 (50.4%) | 16 (66.7%) |
| Overall response at 6 months | (n = 258) | (n = 220) | (n = 21) |
| CR | 18 (7.0%) | 22 (10.0%) | 1 (4.8%) |
| PR | 24 (9.3%) | 11 (5.0%) | 0 (0.0%) |
| SD | 49 (19.0%) | 55 (25.0%) | 2 (9.5%) |
| PD | 167 (64.7%) | 132 (60.0%) | 18 (85.7%) |
- Note: For all parameters, n is the total number of patients, excluding those in the “unknown” category, and (%) is the percentage of n.
- Abbreviations: 5FU, 5-fluorouracil; AFP, α-fetoprotein; AFP-L3, lectin-reactive α-fetoprotein; CR, complete response; PD, progressive disease; PR, partial response; SD, stable disease; SMANCS, styrene maleic acid neocarzinostatin; TACE, transcatheterarterial chemoembolization.
Pathology
A pathological diagnosis was obtained for 9156 patients with HCC (48.7%). Of these, 13.4% were made from a biopsy alone, 86.0% from a resected specimen alone, and 0.6% from cytology. In addition, 52.3% of patients had no pathological diagnosis. The histological grade of HCC was well differentiated in 25.3%, moderately differentiated in 63.2%, poorly differentiated in 11.0%, and undifferentiated in 0.3% of patients. The histological grade of ICC was well differentiated in 22.5%, moderately differentiated in 53.3%, and poorly differentiated in 21.0% of patients. The non-cancerous liver parenchyma in patients with HCC was normal in 13.4%, showed chronic hepatitis in 55.1%, and showed cirrhosis in 31.5%. In patients with ICC, it was normal in 51.5%, showed chronic hepatitis in 40.3%, and showed cirrhosis in 8.1% (Tables 22 and 23).
| Hepatocellular carcinoma | Intrahepatic cholangiocarcinoma | Combined hepatocellular cholangiocarcinoma | |
|---|---|---|---|
| Pathological diagnosis | (n = 9156) | (n = 1107) | (n = 228) |
| Resected specimen | 7876 (86.0%) | 817 (73.8%) | 188 (82.5%) |
| Biopsy | 1225 (13.4%) | 248 (22.4%) | 35 (15.4%) |
| Cytology | 55 (0.6%) | 42 (3.8%) | 5 (2.2%) |
| Histopathological classification | (n = 8522) | ||
| Well-differentiated type | 2158 (25.3%) | ||
| Moderately differentiated type | 5390 (63.2%) | ||
| Poorly differentiated adenocarcinoma | 939 (11.0%) | ||
| Undifferentiated type | 24 (0.3%) | ||
| Fibrolamellar carcinoma | 5 (0.1%) | ||
| Sarcomatous type | 6 (0.1%) | ||
| Histopathological type of HCC | (n = 7442) | ||
| Trabecular type | 5773 (77.6%) | ||
| Pseudoglandular type | 761 (10.2%) | ||
| Compact type | 855 (11.5%) | ||
| Scirrhous type | 53 (0.7%) | ||
| Histopathological classification | (n = 865) | ||
| Well-differentiated adenocarcinoma | 195 (22.5%) | ||
| Moderately differentiated adenocarcinoma | 461 (53.3%) | ||
| Poorly differentiated adenocarcinoma | 182 (21.0%) | ||
| Special type | 27 (3.1%) | ||
| Capsule formation | (n = 7599) | (n = 739) | (n = 184) |
| fc(−) | 2157 (28.4%) | 698 (94.5%) | 113 (61.4%) |
| fc(+) | 5442 (71.6%) | 41 (5.5%) | 71 (38.6%) |
| Capsule invasion | (n = 5382) | (n = 39) | (n = 71) |
| fc-inf(−) | 1653 (30.7%) | 9 (23.1%) | 17 (23.9%) |
| fc-inf(+) | 3729 (69.3%) | 30 (76.9%) | 54 (76.1%) |
| Septum formation | (n = 7527) | (n = 730) | (n = 177) |
| sf(−) | 2576 (34.2%) | 681 (93.3%) | 89 (50.3%) |
| sf(+) | 4951 (65.8%) | 49 (6.7%) | 88 (49.7%) |
| Serosal invasion | (n = 7520) | (n = 757) | (n = 179) |
| s0 | 6821 (90.7%) | 550 (72.7%) | 144 (80.4%) |
| s1 | 550 (7.3%) | 175 (23.1%) | 32 (17.9%) |
| s2 | 62 (0.8%) | 31 (4.1%) | 1 (0.6%) |
| s3 (rupture) | 87 (1.2%) | 1 (0.1%) | 2 (1.1%) |
| Lymph node metastasis | (n = 6883) | (n = 730) | (n = 165) |
| n0 | 6834 (99.3%) | 561 (76.8%) | 153 (92.7%) |
| n1 | 49 (0.7%) | 169 (23.2%) | 12 (7.3%) |
- Note: For all parameters, n is the total number of patients, excluding those in the “unknown” category, and (%) is the percentage of n.
- Abbreviations: fc (−), absence of capsule formation; fc (+), presence of capsule formation; fc-Inf (−), absence of cancerous infiltration of the tumor capsule; fc-Inf (+), presence of cancerous infiltration into the tumor capsule; s0, absence of tumor invasion of the serosa; s1, tumor invasion of the serosa; s2, tumor invasion of adjacent organs; s3, tumor rupture with intraperitoneal bleeding; sf (−), absence of formation of a fibrous septum within the tumor; sf (+), presence of fibrous septum within the tumor.
| Hepatocellular carcinoma | Intrahepatic cholangiocarcinoma | Combined hepatocellular cholangiocarcinoma | |
|---|---|---|---|
| Vascular invasion: Portal vein | (n = 7596) | (n = 762) | (n = 182) |
| vp0 | 5612 (73.9%) | 362 (47.5%) | 97 (53.3%) |
| vp1 | 1621 (21.3%) | 282 (37.0%) | 70 (38.5%) |
| vp2 | 175 (2.3%) | 57 (7.5%) | 5 (2.7%) |
| vp3 | 134 (1.8%) | 49 (6.4%) | 4 (2.2%) |
| vp4 | 54 (0.7%) | 12 (1.6%) | 6 (3.3%) |
| Vascular invasion: Hepatic vein | (n = 7584) | (n = 765) | (n = 182) |
| vv0 | 6600 (87.0%) | 523 (68.4%) | 133 (73.1%) |
| vv1 | 841 (11.1%) | 192 (25.1%) | 45 (24.7%) |
| vv2 | 106 (1.4%) | 40 (5.2%) | 1 (0.5%) |
| vv3 | 37 (0.5%) | 10 (1.3%) | 3 (1.6%) |
| Vascular invasion: Hepatic artery | (n = 7553) | (n = 755) | (n = 179) |
| va0 | 7447 (98.6%) | 717 (95.0%) | 172 (96.1%) |
| va1 | 96 (1.3%) | 27 (3.6%) | 6 (3.4%) |
| va2 | 8 (0.1%) | 7 (0.9%) | 1 (0.6%) |
| va3 | 2 (0.0%) | 4 (0.5%) | 0 (0.0%) |
| Bile duct invasion | (n = 7571) | (n = 739) | (n = 181) |
| b0 | 7359 (97.2%) | 386 (52.2%) | 160 (88.4%) |
| b1 | 124 (1.6%) | 174 (23.5%) | 12 (6.6%) |
| b2 | 40 (0.5%) | 81 (11.0%) | 2 (1.1%) |
| b3 | 29 (0.4%) | 72 (9.7%) | 3 (1.7%) |
| b4 | 19 (0.3%) | 26 (3.5%) | 4 (2.2%) |
| Peritoneal metastasis | (n = 7549) | (n = 756) | (n = 185) |
| P0 | 7524 (99.7%) | 747 (98.8%) | 184 (99.5%) |
| P1 | 20 (0.3%) | 8 (1.1%) | 1 (0.5%) |
| P2 | 5 (0.1%) | 1 (0.1%) | 0 (0.0%) |
| Intrahepatic metastasis | (n = 7269) | (n = 734) | (n = 177) |
| Im (−) | 6422 (88.3%) | 631 (86.0%) | 141 (79.7%) |
| Im (+) | 847 (11.7%) | 103 (14.0%) | 36 (20.3%) |
| Invasion of surgical margin | (n = 7422) | (n = 767) | (n = 177) |
| Sm (+) with tumor exposure | 516 (7.0%) | 144 (18.8%) | 23 (13.0%) |
| Sm (−) distance unknown | 2930 (39.5%) | 330 (43.0%) | 69 (39.0%) |
| Sm (−) 0 mm | 548 (7.4%) | 42 (5.5%) | 16 (9.0%) |
| Sm (−) ≤5 mm | 2027 (27.3%) | 130 (16.9%) | 38 (21.5%) |
| Sm (−) ≤10 mm | 793 (10.7%) | 50 (6.5%) | 17 (9.6%) |
| Sm (−) >10 mm | 608 (8.2%) | 71 (9.3%) | 14 (7.9%) |
| Findings in non-cancerous liver parenchyma: Fibrosis | (n = 6335) | (n = 493) | (n = 144) |
| f0 (nl) | 847 (13.4%) | 254 (51.5%) | 23 (16.0%) |
| f1 | 1164 (18.4%) | 117 (23.7%) | 23 (16.0%) |
| f2 | 1170 (18.5%) | 49 (9.9%) | 26 (18.1%) |
| f3 | 1158 (18.3%) | 33 (6.7%) | 30 (20.8%) |
| f4 (lc) | 1996 (31.5%) | 40 (8.1%) | 42 (29.2%) |
| Findings in non-cancerous liver parenchyma: Activity | (n = 4188) | (n = 352) | (n = 104) |
| a0 | 852 (20.3%) | 190 (54.0%) | 27 (26.0%) |
| a1 | 2004 (47.9%) | 97 (27.6%) | 49 (47.1%) |
| a2 | 1202 (28.7%) | 59 (16.8%) | 24 (23.1%) |
| a3 | 130 (3.1%) | 6 (1.7%) | 4 (3.8%) |
- Note: For all parameters, n is the total number of patients, excluding those in the “unknown” category, and (%) is the percentage of n.
- Abbreviations: b0, absence of invasion of the bile ducts; b1, invasion of (or tumor thrombus in) the third order or more peripheral branches of the bile duct, but not of second order branches; b2, invasion of (or tumor thrombus in) the second order branches of the bile duct; b3, invasion of (or tumor thrombus in) the first order branches of the bile duct; b4, invasion of (or tumor thrombus in) the common hepatic duct; vp0, absence of invasion of (or tumor thrombus in) the portal vein; vp1, invasion of (or tumor thrombus in) distal to the second order branches of the portal vein, but not of the second order branches; vp2, invasion of (or tumor thrombus in) second order branches of the portal vein; vp3, invasion of (or tumor thrombus in) first order branches of the portal vein; vp4, invasion of (or tumor thrombus in) the main trunk of the portal vein and/or contra-lateral portal vein branch to the primarily involved lobe; vv0, absence of invasion of (or tumor thrombus in) the hepatic vein; vv1, invasion of (or tumor thrombus in) peripheral branches of the hepatic vein; vv2, invasion of (or tumor thrombus in) the right, middle, or left hepatic vein, the inferior right hepatic vein, or the short hepatic vein; vv3, invasion of (or tumor thrombus in) the inferior vena cava; va0, absence of invasion of the hepatic artery; va1, invasion distal to the second order branches of the hepatic artery, but not of the second order branches; va2, invasion to the second order branches of the hepatic artery; va3, invasion to the left or right hepatic artery, or the proper hepatic artery; im (−), absence of intrahepatic metastasis; im (+), presence of intrahepatic metastasis; P0, absence of dissemination to the peritoneum; P1, presence of dissemination to the adjacent peritoneum (cranial to transverse colon, greater omentum to be included); P2, dissemination to the remote peritoneum detected.
Recurrence
Recurrence during the survey period (within 2 years of diagnosis) was reported in 7606 patients with HCC (51.8%). The most frequently performed treatment for intrahepatic recurrence was TACE in 36.3%, followed by local ablation therapy in 26.2% and HAIC in 513.%. The most common sites of extrahepatic recurrence were the lungs, bone, lymph nodes, peritoneum, adrenal glands, and brain, in that order. The most frequently performed treatments for extrahepatic recurrence were molecular targeted therapy, radiation therapy, and resection, in that order.
Autopsy
- II.
OS and cumulative survival rates
OS and cumulative survival rates from the 18th to 23rd surveys (2004–2015)
OS and cumulative survival rates were calculated for patients with HCC, ICC, and combined HCC who were newly registered in the surveys from 2004 to 2015, and whose final outcome was survival or death (excluding unknown).
OS and cumulative survival rates for HCC in all cases
Table 24 shows median OS and cumulative survival rates among the 94 289 patients with HCC registered between 2004 and 2015. The median OS was 67.22 months, and 5- and 10-year survival rates were 53.6% and 27.8% (Table 24, Supplementary Figure S1).
| Survival rate (%) (year) | ||||||||||||||
|---|---|---|---|---|---|---|---|---|---|---|---|---|---|---|
| Fig. No. | Title | Category name | n | Median OS (months) | 1 year | 2 years | 3 years | 4 years | 5 years | 6 years | 7 years | 8 years | 9 years | 10 years |
| Suppl Figure S1 | All patients | 94 289 | 67.22 | 83.8 | 74.3 | 66.5 | 59.7 | 53.6 | 47.4 | 41.3 | 36.1 | 32.0 | 27.8 | |
| Figure 1 | Child–Pugh grade | Child–Pugh A | 65 570 | 80.36 | 90.0 | 81.9 | 74.6 | 67.9 | 61.5 | 54.7 | 47.9 | 41.9 | 37.3 | 32.3 |
| Child–Pugh B | 16 822 | 30.39 | 70.6 | 56.0 | 45.4 | 37.4 | 31.8 | 26.4 | 21.7 | 18.4 | 15.2 | 12.8 | ||
| Child–Pugh C | 3244 | 4.63 | 35.6 | 23.4 | 17.8 | 15.5 | 14.0 | 12.5 | 11.4 | 9.9 | 9.3 | 8.6 | ||
| Figure 2 | TNM stage | Stage I | 13 611 | 156.45 | 96.1 | 90.7 | 85.9 | 80.8 | 74.8 | 68.4 | 61.4 | 52.9 | 52.9 | 52.9 |
| Stage II | 22 957 | 90.22 | 92.2 | 85.2 | 78.2 | 72.5 | 66.7 | 60.2 | 52.7 | 48.5 | 41.6 | 41.6 | ||
| Stage III | 12 747 | 50.04 | 81.1 | 67.5 | 57.7 | 51.0 | 45.3 | 39.3 | 33.6 | 28.7 | 28.7 | 19.1 | ||
| Stage IV A | 4485 | 10.64 | 47.6 | 32.2 | 25.9 | 22.6 | 20.1 | 17.8 | 16.3 | 13.5 | 13.5 | 13.5 | ||
| Stage IV B | 1563 | 4.63 | 27.2 | 15.7 | 10.9 | 8.7 | 7.7 | 6.3 | 3.0 | - | - | - | ||
| Figure 3 | mALBI grade | 1 | 3541 | 102.87 | 92.9 | 86.4 | 81.1 | 75.9 | 70.8 | 65.1 | 58.3 | 52.8 | 48.1 | 42.8 |
| 2a | 21 266 | 71.43 | 88.3 | 79.8 | 71.7 | 64.3 | 56.9 | 49.4 | 42.9 | 35.8 | 31.1 | 26.3 | ||
| 2b | 29 364 | 39.49 | 77.1 | 63.7 | 52.8 | 43.7 | 36.9 | 30.5 | 24.8 | 20.6 | 17.3 | 14.2 | ||
| 3 | 6180 | 10.41 | 47.5 | 33.3 | 24.7 | 20.1 | 17.2 | 14.3 | 12.5 | 10.6 | 9.7 | 8.9 | ||
| Figure 4 | Combination of Child–Pugh grade and TNM stage (JIS score) | 0 | 10 443 | 156.45 | 97.8 | 94.0 | 90.2 | 85.9 | 80.8 | 74.1 | 67.4 | 57.8 | 57.8 | 57.8 |
| 1 | 20 379 | 97.58 | 94.2 | 87.8 | 81.2 | 75.7 | 69.5 | 62.7 | 54.7 | 50.3 | 43.1 | 43.1 | ||
| 2 | 12 804 | 58.87 | 85.3 | 72.9 | 62.8 | 55.4 | 49.6 | 43.1 | 36.8 | 31.8 | 31.8 | 15.9 | ||
| 3 | 5167 | 19.68 | 63.9 | 45.1 | 35.0 | 29.8 | 26.3 | 23.1 | 19.3 | 18.8 | 18.8 | - | ||
| 4 | 2411 | 6.93 | 35.5 | 21.1 | 16.2 | 13.4 | 11.5 | 8.9 | 6.7 | - | - | - | ||
| 5 | 908 | 2.20 | 13.0 | 7.0 | 4.2 | 3.1 | 3.1 | 3.1 | 2.0 | 1.0 | 1.0 | 1.0 | ||
| 6 | 162 | 0.95 | 7.1 | 3.3 | 2.5 | 1.7 | 1.7 | 1.7 | - | - | - | - | ||
- Abbreviation: OS, overall survival.
| Survival rate, % (years) | ||||||||||||||
|---|---|---|---|---|---|---|---|---|---|---|---|---|---|---|
| Fig. No. | Title | Category name | n | Median OS (month) | 1 year | 2 years | 3 years | 4 years | 5 years | 6 years | 7 years | 8 years | 9 years | 10 years |
| Suppl Figure S2 | All patients | 35 125 | 99.78 | 91.7 | 85.2 | 79.4 | 74.2 | 69.1 | 62.8 | 56.8 | 51.5 | 47.4 | 42.5 | |
| Age at admission (years) | 0∼39 | 416 | - | 89.1 | 79.3 | 73.5 | 70.5 | 67.9 | 63.3 | 61.0 | 58.4 | 53.1 | 53.1 | |
| 40∼59 | 5000 | 140.62 | 91.4 | 85.0 | 80.2 | 75.9 | 72.7 | 68.2 | 65.1 | 61.5 | 58.7 | 53.8 | ||
| 60∼79 | 23 208 | 94.03 | 91.8 | 85.3 | 79.3 | 73.9 | 68.6 | 62.1 | 55.0 | 49.4 | 44.6 | 38.5 | ||
| ≥80 | 2670 | 72.25 | 89.7 | 80.2 | 71.4 | 65.9 | 57.1 | 50.1 | 41.2 | 32.7 | 22.7 | 17.0 | ||
| Gender | Male | 26 937 | 97.25 | 91.5 | 85.0 | 79.1 | 73.9 | 68.8 | 62.2 | 55.9 | 50.5 | 46.3 | 41.5 | |
| Female | 8188 | 111.41 | 92.2 | 85.8 | 80.4 | 75.2 | 70.4 | 64.9 | 59.8 | 55.0 | 51.2 | 45.8 | ||
| Figure 5 | Maximum tumor diameter | ≤2 cm | 7415 | 119.20 | 96.8 | 93.6 | 89.6 | 84.9 | 80.0 | 73.3 | 66.6 | 59.6 | 55.2 | 49.7 |
| >2 cm to ≤3 cm | 8416 | 112.43 | 95.5 | 90.9 | 85.7 | 80.5 | 75.2 | 68.1 | 61.4 | 56.4 | 52.3 | 46.1 | ||
| >3 cm to ≤5 cm | 9257 | 96.92 | 92.8 | 85.9 | 80.0 | 74.2 | 69.0 | 61.9 | 56.1 | 50.7 | 45.4 | 41.3 | ||
| >5 cm to ≤10 cm | 6678 | 80.03 | 86.5 | 77.0 | 70.0 | 64.0 | 58.7 | 53.7 | 47.9 | 44.2 | 41.7 | 37.2 | ||
| >10 cm | 2585 | 38.57 | 74.5 | 60.5 | 51.7 | 48.0 | 45.4 | 41.7 | 38.4 | 33.4 | 32.4 | 31.3 | ||
| Figure 6 | No. tumors | 1 | 26 703 | 112.03 | 93.4 | 87.9 | 82.9 | 78.3 | 73.3 | 67.2 | 61.1 | 55.6 | 51.6 | 46.3 |
| 2 | 4779 | 81.74 | 90.2 | 82.0 | 74.9 | 68.0 | 62.2 | 54.8 | 48.7 | 44.4 | 39.5 | 35.3 | ||
| ≥3 | 3002 | 46.92 | 80.4 | 67.8 | 57.6 | 49.4 | 45.3 | 39.2 | 33.7 | 29.5 | 26.8 | 24.5 | ||
| Figure 7 | Portal vein invasion | Vp0 | 28 710 | 106.97 | 94.3 | 89.0 | 83.4 | 78.1 | 72.9 | 66.1 | 59.5 | 53.8 | 49.6 | 44.4 |
| Vp1 | 3507 | 80.56 | 85.2 | 73.4 | 66.5 | 61.0 | 56.9 | 52.6 | 49.0 | 45.3 | 42.0 | 38.5 | ||
| Vp2 | 926 | 36.96 | 71.1 | 55.7 | 50.4 | 46.8 | 42.9 | 41.0 | 38.9 | 36.9 | 34.2 | 28.3 | ||
| Vp3 | 687 | 24.84 | 64.2 | 50.4 | 42.0 | 35.6 | 33.1 | 29.6 | 25.7 | 23.7 | 21.0 | 21.0 | ||
| Vp4 | 347 | 14.09 | 54.4 | 32.5 | 23.3 | 22.0 | 19.2 | 15.8 | 15.8 | 15.8 | 8.8 | 8.8 | ||
| Capsular invasion | Fc-Inf (−) | 12 831 | 106.02 | 94.2 | 89.0 | 84.0 | 78.8 | 73.0 | 65.9 | 59.8 | 54.1 | 49.8 | 44.0 | |
| Fc-Inf (+) | 12 229 | 93.83 | 90.1 | 82.1 | 75.5 | 69.9 | 65.2 | 59.6 | 53.6 | 49.0 | 45.0 | 41.1 | ||
| Figure 8 | AFP (ng/mL) | ≤10 | 16 423 | 113.35 | 95.7 | 91.3 | 86.5 | 81.7 | 76.5 | 70.1 | 62.9 | 57.6 | 52.6 | 47.2 |
| >10 to ≤200 | 10 142 | 88.41 | 92.1 | 84.8 | 78.4 | 72.4 | 66.6 | 59.4 | 52.7 | 45.9 | 41.8 | 37.8 | ||
| >200 to ≤400 | 1457 | 88.34 | 89.4 | 81.8 | 75.3 | 68.4 | 62.9 | 57.7 | 52.8 | 47.5 | 45.4 | 36.7 | ||
| >400 to ≤1000 | 1642 | 80.95 | 86.3 | 76.6 | 68.1 | 64.0 | 59.2 | 53.4 | 49.4 | 45.1 | 42.9 | 36.6 | ||
| >1000 to ≤10000 | 2644 | 80.95 | 82.0 | 71.7 | 64.2 | 59.3 | 56.1 | 51.8 | 49.2 | 46.2 | 43.9 | 41.5 | ||
| >10 000 | 1108 | 42.74 | 73.7 | 59.5 | 52.7 | 46.6 | 44.6 | 41.3 | 39.7 | 36.2 | 32.9 | 30.2 | ||
| Figure 9 | AFP-L3 fraction (%) | <10 | 10 702 | 111.93 | 95.4 | 90.6 | 85.4 | 80.4 | 75.0 | 68.8 | 61.6 | 56.3 | 51.4 | 47.1 |
| ≥10 | 5505 | 82.66 | 84.9 | 74.3 | 67.6 | 62.6 | 58.7 | 53.9 | 49.5 | 45.4 | 43.4 | 38.5 | ||
| Figure 10 | PIVKA-II (mAU/mL) | <40 | 11 775 | 117.16 | 96.3 | 92.4 | 88.2 | 83.9 | 79.0 | 72.0 | 65.3 | 59.2 | 54.6 | 49.4 |
| ≥40 to <300 | 4492 | 96.92 | 92.9 | 86.3 | 80.5 | 74.7 | 69.1 | 61.4 | 56.0 | 50.5 | 46.8 | 43.5 | ||
| ≥300 to <500 | 1719 | 82.23 | 90.9 | 83.8 | 77.3 | 70.3 | 64.9 | 58.9 | 48.9 | 43.8 | 41.6 | 35.9 | ||
| ≥500 to <1000 | 2015 | 90.84 | 90.3 | 82.3 | 75.2 | 68.0 | 63.0 | 59.0 | 51.9 | 48.4 | 38.1 | 36.3 | ||
| ≥1000 | 8132 | 71.16 | 83.4 | 72.1 | 64.1 | 58.5 | 53.9 | 49.5 | 44.9 | 41.6 | 38.9 | 32.9 | ||
| HBsAg, HCV-Ab | HBsAg (−) HCV-Ab (−) | 12 019 | 102.93 | 91.7 | 85.1 | 79.2 | 74.6 | 70.2 | 63.5 | 57.0 | 52.3 | 48.2 | 44.3 | |
| HBsAg (−) HCV-Ab (+) | 15 044 | 85.82 | 91.6 | 84.8 | 78.6 | 72.3 | 65.9 | 58.7 | 51.0 | 44.4 | 39.9 | 34.9 | ||
| HBsAg (+) HCV-Ab (−) | 5690 | 216.54 | 91.6 | 85.6 | 80.6 | 76.8 | 74.1 | 70.0 | 67.1 | 64.6 | 61.6 | 57.0 | ||
| HBsAg (+) HCV-Ab (+) | 492 | 115.02 | 89.7 | 85.4 | 81.1 | 77.2 | 70.1 | 64.9 | 61.4 | 55.8 | 53.9 | 46.7 | ||
| Non-cancerous tissue finding | nl | 1484 | 111.93 | 92.5 | 84.0 | 77.1 | 73.7 | 68.5 | 63.1 | 58.2 | 55.0 | 51.5 | 48.8 | |
| ch, lf | 7496 | 106.64 | 92.3 | 85.3 | 79.5 | 73.7 | 68.3 | 62.7 | 57.4 | 53.2 | 49.4 | 44.7 | ||
| lc | 6009 | 71.85 | 89.4 | 81.8 | 73.9 | 64.9 | 57.8 | 49.9 | 44.0 | 38.4 | 34.5 | 30.8 | ||
| Procedure | Extended lobectomy | 680 | 46.39 | 73.7 | 60.2 | 55.4 | 48.6 | 43.9 | 42.7 | 40.3 | 36.6 | 34.4 | 32.9 | |
| Lobectomy | 7090 | 84.04 | 84.2 | 74.6 | 67.5 | 63.2 | 59.4 | 54.4 | 50.1 | 46.3 | 42.5 | 38.6 | ||
| Segmentectomy | 8105 | 112.43 | 92.6 | 86.5 | 81.2 | 76.7 | 71.6 | 65.3 | 59.7 | 55.7 | 51.4 | 44.9 | ||
| Sub-segmentectomy | 7776 | 113.12 | 95.1 | 89.8 | 84.8 | 80.1 | 74.8 | 69.0 | 62.4 | 55.8 | 52.2 | 47.5 | ||
| Partial resection | 10 228 | 95.41 | 94.7 | 89.3 | 83.4 | 76.7 | 71.1 | 63.2 | 56.0 | 49.9 | 45.3 | 40.2 | ||
| Curability | Curability A or B | 29 128 | 107.99 | 93.9 | 88.1 | 82.6 | 77.4 | 72.4 | 65.9 | 59.3 | 54.0 | 49.9 | 44.7 | |
| Curability C | 2933 | 29.24 | 69.6 | 54.2 | 45.7 | 39.3 | 35.3 | 31.7 | 29.1 | 25.2 | 23.1 | 20.3 | ||
| Figure 11 | Child–Pugh grade | Child–Pugh A | 29 867 | 104.48 | 92.4 | 86.2 | 80.6 | 75.6 | 70.6 | 64.4 | 58.3 | 52.9 | 48.7 | 43.6 |
| Child–Pugh B | 2625 | 66.04 | 83.2 | 73.2 | 65.7 | 58.3 | 53.6 | 45.7 | 39.8 | 35.5 | 31.2 | 26.5 | ||
| Child–Pugh C | 36 | 23.03 | 65.7 | 48.7 | 48.7 | 48.7 | 48.7 | 48.7 | 24.4 | 24.4 | 24.4 | 24.4 | ||
| Figure 12 | mALBI grade | 1 | 19 360 | 123.10 | 94.4 | 89.1 | 84.7 | 80.6 | 76.6 | 71.5 | 65.0 | 59.9 | 56.2 | 51.0 |
| 2a | 8561 | 90.15 | 91.3 | 84.9 | 78.1 | 72.4 | 66.5 | 59.1 | 53.5 | 47.8 | 42.6 | 37.1 | ||
| 2b | 6316 | 62.23 | 85.0 | 74.7 | 66.1 | 58.1 | 51.5 | 43.7 | 38.1 | 33.2 | 29.8 | 26.2 | ||
| 3 | 332 | 45.37 | 68.8 | 59.3 | 52.6 | 49.0 | 43.8 | 33.4 | 26.3 | 24.1 | 21.4 | 21.4 | ||
| Figure 13 | TNM stage | I | 4028 | 123.47 | 97.7 | 95.0 | 91.8 | 87.8 | 83.9 | 76.9 | 70.3 | 63.3 | 58.3 | 51.6 |
| II | 17 030 | 114.30 | 95.4 | 90.7 | 85.6 | 81.1 | 75.8 | 69.6 | 62.8 | 56.9 | 52.9 | 47.5 | ||
| III | 8033 | 77.57 | 88.0 | 78.6 | 71.3 | 64.5 | 59.6 | 52.9 | 47.3 | 43.0 | 39.5 | 35.7 | ||
| IV A | 2369 | 34.43 | 74.5 | 58.3 | 49.7 | 44.0 | 39.9 | 35.5 | 33.0 | 29.7 | 26.2 | 23.7 | ||
| IV B | 334 | 17.64 | 60.2 | 46.1 | 37.8 | 33.5 | 32.3 | 30.5 | 21.0 | 21.0 | 12.6 | 12.6 | ||
| Suppl Figure S3 |
|
All patients | 14 499 | 114.04 | 96.3 | 92.3 | 87.7 | 82.9 | 78.0 | 71.2 | 64.3 | 58.1 | 54.0 | 47.5 |
| Child–Pugh A | 13 363 | 117.16 | 96.7 | 93.1 | 88.6 | 84.1 | 79.2 | 72.5 | 65.6 | 59.6 | 55.6 | 48.7 | ||
| Child–-Pugh B | 1123 | 79.31 | 91.5 | 83.7 | 76.9 | 67.8 | 63.0 | 55.4 | 48.6 | 40.4 | 35.2 | 32.3 | ||
| Child–Pugh C | 13 | - | 83.9 | 64.7 | 64.7 | 64.7 | 64.7 | 64.7 | 64.7 | 64.7 | 64.7 | 64.7 | ||
- Abbreviations: AFP, α-fetoprotein; OS, overall survival; PIVKA-II, protein induced by vitamin K absence or antagonist-II; Vp0, absence of invasion of(or tumor thrombus in) the portal vein; Vp1, invasion of(or tumor thrombus in) distal to the second order branches of the portal vein, but not of the second order branches; Vp2, invasion of(or tumor thrombus in) second order branches of the portal vein; Vp3, invasion of(or tumor thrombus in) first order branches of the portal vein; Vp4, invasion of(or tumor thrombus in) the main trunk of the portal vein and/or contra-lateral portal vein branch to the primarily involved lobe.
- (1)
Median OS and cumulative survival rates for resected HCC (Table 25)
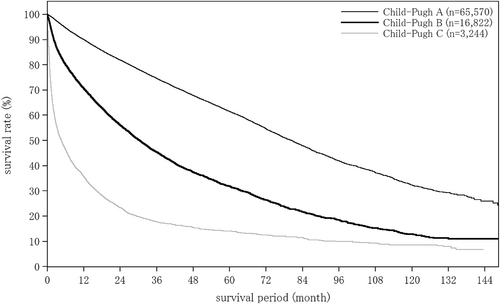
Survival curves for all hepatocellular carcinoma patients by Child–Pugh grade.
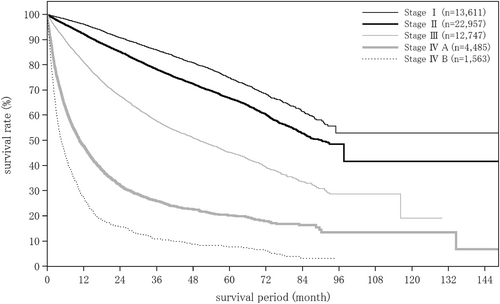
Survival curves for all hepatocellular carcinoma patients by TNM stage.
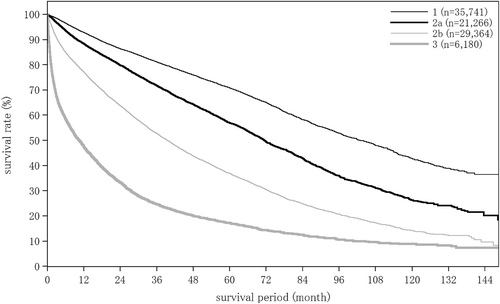
Survival curves for all hepatocellular carcinoma patients by modified albumin-bilirubin grade.
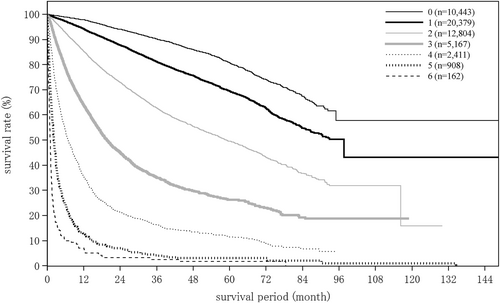
Survival curves for all hepatocellular carcinoma patients by combining Child–Pugh grade and TNM stage (Japan Integrated Staging score).
- (2)
Median OS and cumulative survival rates for HCC treated with radiofrequency ablation therapy (Table 27)
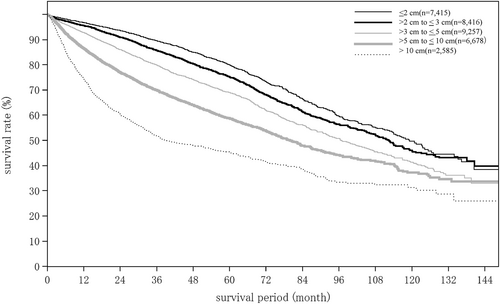
Survival curves for resected hepatocellular carcinoma patients by maximum tumor diameter.
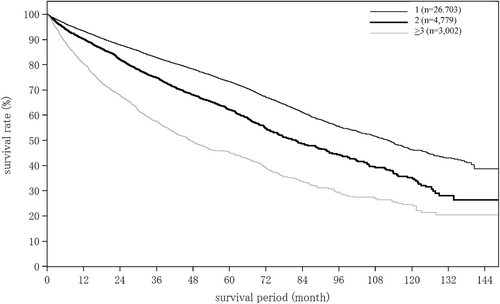
Survival curves for resected hepatocellular carcinoma patients by number of tumors.
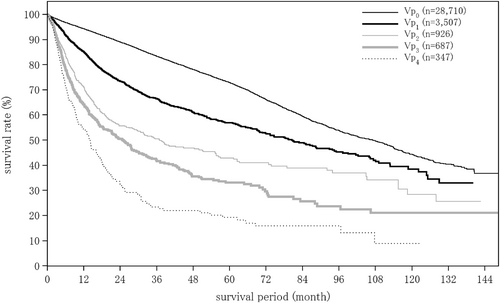
Survival curves for hepatocellular carcinoma patients by the extent of portal vein invasion.
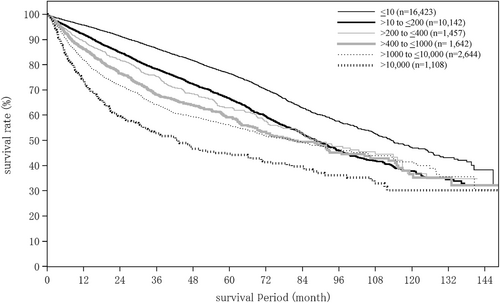
Survival curves for resected hepatocellular carcinoma patients by α-fetoprotein level (ng/mL).
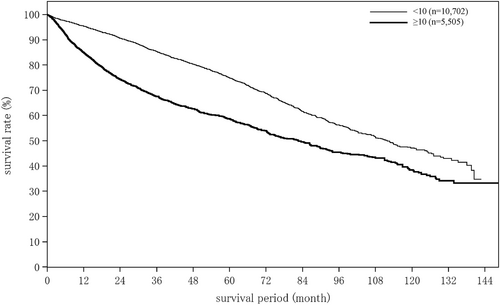
Survival curves for resected hepatocellular carcinoma patients by α-fetoprotein L3 fraction (%).
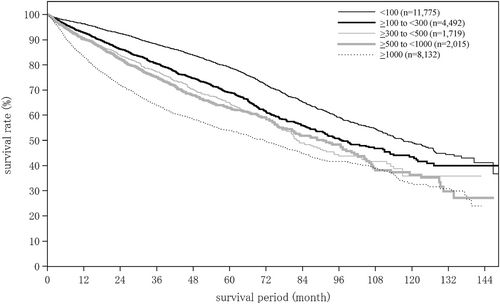
Survival curves for resected hepatocellular carcinoma patients by protein induced by vitamin K absence or antagonist-II level (m AU/mL).
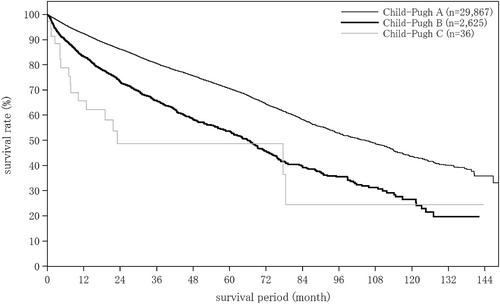
Survival curves for resected hepatocellular carcinoma patients by Child–Pugh grade. The median overall survival for Child–Pugh grade A patients who underwent resection was 104.48 months, and 5- and 10-year survival rates were 70.6% and 43.6%.
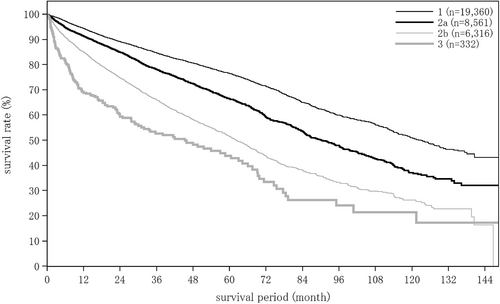
Survival curves for resected hepatocellular carcinoma patients by modified albumin-bilirubin grade.
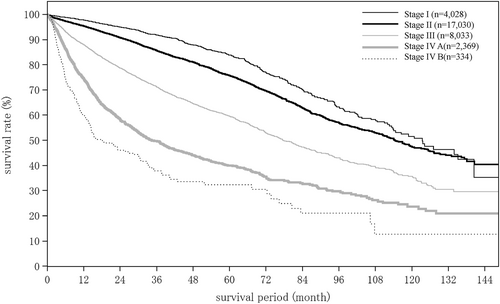
Survival curves for resected hepatocellular carcinoma patients by TNM stage.
| Median OS (month) | Survival rate, % (years) | |||||||||||||
|---|---|---|---|---|---|---|---|---|---|---|---|---|---|---|
| Fig. No. | Title | Category name | n | 1 year | 2 years | 3 years | 4 years | 5 years | 6 years | 7 years | 8 years | 9 years | 10 years | |
| Suppl Figure 4 | All patients | 371 | - | 88.1 | 82.9 | 80.9 | 79.1 | 77.0 | 74.9 | 72.3 | 70.3 | 67.5 | 65.5 | |
| Figure 14 | Milan criteria | ≤3 tumors ≤3 cm in diameter, or 1 tumor ≤5 cm in diameter | 230 | - | 86.7 | 82.9 | 81.6 | 79.4 | 76.9 | 74.7 | 72.1 | 70.5 | 70.5 | 70.5 |
| Outside the criteria | 104 | - | 90.8 | 82.1 | 78.0 | 78.0 | 76.0 | 73.4 | 70.4 | 67.2 | 57.3 | 57.3 | ||
| Median OS (month) | Survival rate, % (years) | |||||||||||||
|---|---|---|---|---|---|---|---|---|---|---|---|---|---|---|
| Fig. No. | Title | Category name | n | 1 year | 2 years | 3 years | 4 years | 5 years | 6 years | 7 years | 8 years | 9 years | 10 years | |
| Suppl Figure S5 | All patients | 20 578 | 80.30 | 95.8 | 89.0 | 81.8 | 73.3 | 65.0 | 56.2 | 47.5 | 40.5 | 34.4 | 28.3 | |
| Figure 15 | Child–Pugh grade | Child–Pugh A | 14 884 | 87.92 | 97.4 | 92.4 | 86.3 | 78.6 | 70.6 | 61.6 | 52.6 | 45.1 | 39.3 | 32.5 |
| Child–Pugh B | 3869 | 53.72 | 90.9 | 77.3 | 65.5 | 54.6 | 45.0 | 36.7 | 29.8 | 25.1 | 19.0 | 14.6 | ||
| Child–Pugh C | 248 | 26.94 | 77.6 | 54.9 | 42.1 | 32.3 | 19.7 | 15.5 | 10.6 | - | - | - | ||
| mALBI grade | 1 | 7226 | 113.71 | 98.4 | 94.8 | 91.0 | 85.5 | 79.4 | 72.0 | 65.1 | 58.8 | 52.2 | 43.9 | |
| 2a | 5024 | 82.33 | 97.2 | 92.6 | 86.1 | 78.0 | 68.0 | 58.4 | 48.6 | 39.0 | 34.3 | 28.2 | ||
| 2b | 7245 | 61.08 | 93.4 | 83.1 | 72.3 | 60.7 | 51.1 | 41.4 | 31.7 | 26.2 | 19.3 | 14.9 | ||
| 3 | 779 | 34.96 | 85.8 | 62.9 | 49.3 | 35.6 | 28.3 | 23.0 | 19.7 | 14.1 | 14.1 | 12.3 | ||
| Figure 16 | No. tumors | 1 | 15 625 | 84.50 | 96.1 | 89.5 | 82.9 | 75.1 | 67.3 | 59.0 | 50.3 | 43.3 | 37.5 | 30.4 |
| 2 | 3306 | 73.36 | 95.2 | 87.6 | 79.5 | 69.9 | 60.2 | 50.5 | 42.3 | 35.0 | 27.7 | 23.6 | ||
| 3 | 948 | 63.47 | 94.0 | 86.0 | 75.5 | 62.9 | 52.2 | 42.3 | 33.9 | 28.1 | 21.3 | 20.3 | ||
| 4 | 225 | 66.17 | 95.0 | 85.1 | 76.1 | 65.9 | 54.9 | 39.9 | 29.1 | 18.1 | 14.5 | 14.5 | ||
| ≥5 | 138 | 52.11 | 96.6 | 86.8 | 70.0 | 55.0 | 46.6 | 28.1 | 17.3 | 17.3 | 17.3 | 13.9 | ||
| Figure 17 | Maximum tumor diameter | ≤1 cm | 1596 | 105.30 | 96.9 | 92.3 | 86.6 | 82.1 | 75.8 | 69.0 | 59.3 | 51.8 | 47.1 | 36.3 |
| >1 cm to ≤2 cm | 8915 | 86.21 | 96.6 | 91.0 | 84.7 | 77.4 | 70.3 | 61.7 | 51.2 | 44.0 | 36.8 | 31.4 | ||
| >2 cm to ≤3 cm | 4379 | 75.43 | 95.3 | 87.7 | 79.2 | 70.2 | 62.1 | 52.6 | 44.8 | 36.4 | 30.4 | 24.2 | ||
| >3 cm to ≤5 cm | 1208 | 61.47 | 92.5 | 80.6 | 71.4 | 60.7 | 51.1 | 43.1 | 38.3 | 32.9 | 29.9 | 23.8 | ||
| >5 cm | 162 | 62.92 | 86.9 | 74.1 | 70.0 | 62.1 | 50.9 | 46.6 | 36.2 | 30.7 | 27.6 | 18.4 | ||
| AFP (ng/mL) | ≤10 | 9511 | 92.16 | 96.9 | 91.5 | 85.7 | 78.4 | 71.1 | 62.9 | 54.9 | 47.5 | 42.0 | 34.9 | |
| >10 to ≤200 | 8498 | 73.30 | 95.5 | 88.3 | 80.1 | 71.0 | 61.7 | 51.2 | 41.5 | 35.0 | 28.4 | 23.6 | ||
| >200 to ≤400 | 785 | 74.64 | 94.5 | 83.6 | 74.5 | 63.6 | 57.1 | 51.4 | 40.3 | 26.4 | 21.2 | 16.9 | ||
| >400 to ≤1000 | 612 | 67.78 | 92.8 | 83.0 | 74.8 | 62.9 | 53.8 | 47.6 | 37.8 | 36.5 | 22.8 | 16.3 | ||
| >1000 to ≤10000 | 452 | 50.37 | 88.9 | 71.9 | 59.6 | 51.8 | 41.6 | 37.7 | 33.9 | 31.0 | 29.1 | 19.6 | ||
| >10000 | 36 | 52.11 | 84.5 | 69.5 | 69.5 | 52.5 | 43.0 | 43.0 | 28.7 | 28.7 | 28.7 | 28.7 | ||
| AFP-L3fraction (%) | <10 | 9702 | 81.77 | 96.8 | 90.9 | 84.3 | 76.3 | 67.9 | 57.6 | 48.5 | 41.6 | 36.1 | 30.0 | |
| ≥10 | 2221 | 67.52 | 92.6 | 81.3 | 71.3 | 62.0 | 54.9 | 46.9 | 37.9 | 30.0 | 22.2 | 16.7 | ||
| PIVKA-II (mAU/mL) | <100 | 12 132 | 87.95 | 97.3 | 92.4 | 86.5 | 79.4 | 71.5 | 62.7 | 53.1 | 45.7 | 39.1 | 32.2 | |
| ≥100 to <300 | 2031 | 65.38 | 93.4 | 82.9 | 73.7 | 64.1 | 53.7 | 46.4 | 38.9 | 33.1 | 28.0 | 24.1 | ||
| ≥300 to <500 | 487 | 52.11 | 92.6 | 78.4 | 65.8 | 54.1 | 43.9 | 37.6 | 31.5 | 24.0 | 17.6 | 9.4 | ||
| ≥500 to <1000 | 416 | 60.12 | 90.9 | 78.9 | 66.4 | 54.6 | 51.0 | 42.8 | 35.6 | 31.9 | 31.9 | 31.9 | ||
| ≥1000 | 704 | 55.06 | 89.4 | 74.4 | 63.8 | 53.2 | 48.0 | 44.6 | 39.9 | 32.8 | 29.3 | 24.8 | ||
| Suppl Figure S6 | ≤3 tumors, tumor diameter ≤3 cm Child–Pugh grade | All patients | 13 734 | 85.91 | 96.3 | 90.2 | 83.4 | 76.1 | 68.9 | 60.7 | 51.1 | 43.4 | 36.7 | 30.3 |
| Child–Pugh A | 10 738 | 91.56 | 97.7 | 93.3 | 87.7 | 81.0 | 74.3 | 66.2 | 56.3 | 47.7 | 41.2 | 34.0 | ||
| Child–Pugh B | 2822 | 58.09 | 91.6 | 79.3 | 67.9 | 58.1 | 49.1 | 40.5 | 32.3 | 28.3 | 21.1 | 17.4 | ||
| Child–Pugh C | 174 | 29.34 | 77.7 | 56.2 | 47.8 | 35.0 | 19.2 | 15.4 | 10.3 | - | - | - | ||
- Abbreviation: OS, overall survival.
| Median OS (month) | Survival rate, % (years) | |||||||||||||
|---|---|---|---|---|---|---|---|---|---|---|---|---|---|---|
| Fig. No. | Title | Category name | n | 1 year | 2 years | 3 years | 4 years | 5 years | 6 years | 7 years | 8 years | 9 years | 10 years | |
| Suppl Figure S7 | All patients | 19 353 | 39.23 | 82.4 | 65.9 | 52.8 | 42.8 | 34.9 | 29.1 | 22.9 | 17.8 | 14.0 | 12.1 | |
| Figure 18 | Child–Pugh grade | Child–Pugh A | 12 292 | 47.44 | 87.0 | 72.4 | 59.9 | 49.3 | 40.6 | 33.7 | 26.8 | 20.6 | 15.8 | 13.9 |
| Child–Pugh B | 4853 | 26.81 | 74.0 | 53.5 | 38.6 | 28.9 | 23.1 | 18.1 | 13.3 | 10.2 | 8.1 | 7.6 | ||
| Child–Pugh C | 540 | 13.73 | 54.1 | 31.6 | 21.4 | 16.3 | 14.6 | 13.6 | 11.9 | 11.9 | 11.9 | 8.9 | ||
| Figure 19 | mALBI grade | 1 | 5346 | 60.55 | 90.0 | 77.4 | 68.0 | 58.7 | 50.4 | 43.7 | 35.3 | 29.5 | 23.0 | 21.6 |
| 2a | 4391 | 43.76 | 85.4 | 70.8 | 57.7 | 47.3 | 38.8 | 32.1 | 25.1 | 16.4 | 11.3 | 8.8 | ||
| 2b | 7984 | 30.59 | 79.1 | 59.5 | 43.4 | 32.2 | 24.6 | 19.2 | 14.5 | 11.2 | 9.7 | 7.9 | ||
| 3 | 1371 | 17.58 | 62.3 | 40.1 | 26.2 | 19.5 | 15.1 | 12.0 | 9.5 | 8.1 | 7.2 | 6.3 | ||
| Figure 20 | No. tumors | 1 | 8288 | 52.11 | 86.9 | 73.8 | 62.7 | 52.8 | 45.4 | 39.2 | 31.5 | 24.5 | 19.3 | 17.2 |
| 2 | 3736 | 41.23 | 86.1 | 70.5 | 55.3 | 44.9 | 34.9 | 28.1 | 21.5 | 16.3 | 11.4 | 11.4 | ||
| 3 | 2123 | 35.78 | 84.8 | 66.0 | 49.6 | 38.5 | 30.4 | 22.3 | 15.0 | 10.1 | 7.7 | 7.7 | ||
| 4 | 1077 | 33.05 | 86.5 | 66.5 | 47.4 | 33.5 | 25.8 | 21.4 | 17.8 | 16.6 | 12.9 | 7.7 | ||
| >5 | 3620 | 20.50 | 68.2 | 44.7 | 31.9 | 23.4 | 16.7 | 13.3 | 11.1 | 8.9 | 7.8 | 5.3 | ||
| Figure 21 | Maximum tumor diameter | ≤2 cm | 5074 | 57.10 | 92.9 | 81.9 | 67.9 | 57.3 | 47.8 | 40.8 | 34.0 | 26.8 | 20.4 | 19.0 |
| >2 cm to ≤3 cm | 4434 | 46.36 | 90.2 | 74.0 | 59.9 | 48.6 | 38.9 | 32.3 | 25.0 | 19.2 | 15.7 | 13.7 | ||
| >3 cm to ≤5 cm | 4783 | 34.99 | 83.0 | 62.8 | 49.5 | 38.2 | 30.7 | 25.1 | 18.9 | 15.0 | 11.6 | 9.2 | ||
| >5 cm to ≤10 cm | 3421 | 22.18 | 67.9 | 47.8 | 35.6 | 28.3 | 23.3 | 18.9 | 14.0 | 10.9 | 8.5 | 6.7 | ||
| >10 cm | 1070 | 12.06 | 50.7 | 33.4 | 25.3 | 19.6 | 15.6 | 12.3 | 10.0 | 6.0 | 6.0 | 6.0 | ||
| Figure 22 | Portal vein invasion | Image-Vp0 | 16 591 | 42.74 | 86.4 | 70.5 | 56.6 | 45.8 | 37.5 | 31.2 | 24.5 | 19.1 | 15.2 | 13.4 |
| Image-Vp1 | 576 | 19.06 | 67.1 | 42.1 | 28.7 | 21.4 | 14.5 | 11.6 | 9.9 | 6.6 | - | - | ||
| Image-Vp2 | 548 | 11.24 | 48.2 | 22.4 | 16.6 | 11.1 | 6.8 | 3.6 | 3.6 | - | - | - | ||
| Image-Vp3 | 480 | 6.67 | 33.6 | 15.5 | 11.2 | 10.6 | 9.3 | 5.2 | 5.2 | - | - | - | ||
| Image-Vp4 | 195 | 5.98 | 26.1 | 11.5 | 8.5 | 4.7 | 2.4 | 2.4 | 2.4 | 2.4 | 2.4 | 2.4 | ||
| Figure 23 | AFP (ng/mL) | ≤10 | 6613 | 52.90 | 90.3 | 77.7 | 65.0 | 54.2 | 45.8 | 37.9 | 29.7 | 23.4 | 17.1 | 15.7 |
| >10 to ≤200 | 7090 | 39.36 | 86.5 | 68.5 | 53.4 | 42.2 | 33.6 | 28.0 | 21.0 | 16.0 | 13.4 | 11.1 | ||
| >200 to ≤400 | 1098 | 31.05 | 79.5 | 57.7 | 44.4 | 33.1 | 25.1 | 20.8 | 17.9 | 12.7 | 8.1 | 6.1 | ||
| >400 to ≤1000 | 1094 | 27.30 | 71.8 | 54.2 | 40.8 | 31.9 | 24.9 | 21.9 | 18.0 | 14.1 | 11.3 | 9.4 | ||
| >1000 to ≤10000 | 1653 | 18.89 | 63.8 | 43.2 | 32.4 | 25.9 | 20.9 | 18.2 | 16.3 | 12.6 | 10.9 | 9.4 | ||
| >10000 | 677 | 11.50 | 48.4 | 26.1 | 19.1 | 15.6 | 11.0 | 7.3 | 6.4 | 3.7 | 3.7 | 3.7 | ||
| AFP-L3fraction (%) | <10 | 5104 | 45.67 | 88.6 | 74.0 | 59.4 | 48.5 | 38.8 | 31.8 | 24.6 | 20.0 | 15.8 | 13.5 | |
| ≥10 | 3356 | 24.44 | 71.5 | 50.3 | 37.7 | 30.0 | 23.0 | 18.5 | 15.0 | 11.5 | 9.6 | 8.8 | ||
| PIVKA-II (mAU/mL) | <40 | 5581 | 59.01 | 92.6 | 81.2 | 68.8 | 59.2 | 49.4 | 41.9 | 35.2 | 28.7 | 23.0 | 20.9 | |
| ≥40 to <300 | 2511 | 37.72 | 86.6 | 67.0 | 51.5 | 40.8 | 30.7 | 23.5 | 15.8 | 10.8 | 9.1 | 7.7 | ||
| ≥300 to <500 | 964 | 33.31 | 83.1 | 62.9 | 46.8 | 34.5 | 26.0 | 19.5 | 15.8 | 9.8 | 8.1 | 8.1 | ||
| ≥500 to <1000 | 1114 | 28.75 | 80.4 | 57.4 | 43.7 | 34.5 | 28.7 | 20.0 | 15.4 | 12.1 | 9.7 | 8.5 | ||
| ≥1000 | 4504 | 19.06 | 63.9 | 43.6 | 32.4 | 24.4 | 20.5 | 17.3 | 13.9 | 11.1 | 8.2 | 6.6 | ||
- Abbreviation: OS, overall survival.
| Survival rate, % (years) | ||||||||||||||
|---|---|---|---|---|---|---|---|---|---|---|---|---|---|---|
| Fig. No. | Title | Category name | n | Median OS (months) | 1 year | 2 years | 3 years | 4 years | 5 years | 6 years | 7 years | 8 years | 9 years | 10 years |
| All patients | 1116 | 7.23 | 39.4 | 27.4 | 21.9 | 17.3 | 15.1 | 11.0 | 7.0 | 1.9 | 1.9 | - | ||
| Suppl Figure S8 | Child–Pugh grade | Child–Pugh A | 518 | 11.40 | 48.8 | 36.4 | 29.3 | 22.2 | 18.1 | 12.7 | 7.6 | 2.5 | 2.5 | - |
| Child–Pugh B | 411 | 4.90 | 28.8 | 16.7 | 13.9 | 11.6 | 11.6 | 8.1 | 8.1 | - | - | - | ||
| Child–Pugh C | 98 | 4.30 | 32.5 | 21.7 | 14.7 | 14.7 | 12.2 | 12.2 | 6.1 | - | - | - | ||
| mALBI grade | 1 | 181 | 19.98 | 58.8 | 48.4 | 41.4 | 35.4 | 29.0 | 14.5 | 14.5 | 14.5 | 14.5 | - | |
| 2a | 186 | 10.41 | 45.1 | 29.7 | 25.0 | 19.3 | 16.6 | 12.4 | 8.3 | - | - | - | ||
| 2b | 552 | 5.95 | 35.3 | 23.3 | 18.6 | 13.9 | 12.9 | 11.3 | 3.8 | - | - | - | ||
| 3 | 178 | 4.60 | 28.2 | 19.7 | 12.2 | 10.7 | 9.1 | 6.1 | 6.1 | - | - | - | ||
| No. tumors | 1 | 280 | 11.96 | 49.8 | 40.7 | 38.5 | 29.6 | 25.2 | 16.8 | 8.4 | - | - | - | |
| 2 | 108 | 13.40 | 53.0 | 38.9 | 31.2 | 23.6 | 18.9 | 12.6 | - | - | - | - | ||
| 3 | 74 | 21.09 | 62.7 | 42.8 | 29.8 | 19.9 | 19.9 | 19.9 | 19.9 | 19.9 | 19.9 | - | ||
| 4 | 29 | 7.39 | 43.0 | 23.9 | 15.9 | 8.0 | - | - | - | - | - | - | ||
| >5 | 531 | 4.93 | 28.6 | 16.9 | 11.5 | 9.5 | 7.8 | 6.3 | 4.7 | - | - | - | ||
| Maximum tumor diameter | ≤2 cm | 150 | 38.93 | 76.8 | 61.7 | 51.8 | 44.4 | 36.6 | 24.4 | - | - | - | - | |
| >2 cm to ≤3 cm | 115 | 20.93 | 62.9 | 41.7 | 30.5 | 22.9 | 22.9 | - | - | - | - | - | ||
| >3 cm to ≤5 cm | 169 | 12.91 | 51.8 | 35.2 | 26.3 | 20.5 | 17.5 | 8.8 | 8.8 | - | - | - | ||
| >5 cm to ≤10 cm | 302 | 5.32 | 27.1 | 17.8 | 14.6 | 9.7 | 8.5 | 6.4 | 6.4 | 2.1 | 2.1 | - | ||
| >10 cm | 219 | 3.78 | 13.1 | 9.5 | 9.5 | 9.5 | 9.5 | 9.5 | - | - | - | - | ||
| Figure 24 | Portal vein invasion | Image-Vp0 | 454 | 19.09 | 59.3 | 43.1 | 34.3 | 28.6 | 24.8 | 20.2 | 5.1 | - | - | - |
| Image-Vp1 | 44 | 7.46 | 36.1 | 20.6 | 15.5 | - | - | - | - | - | - | - | ||
| Image-Vp2 | 82 | 6.70 | 30.2 | 17.0 | 14.9 | - | - | - | - | - | - | - | ||
| Image-Vp3 | 210 | 3.94 | 21.4 | 13.1 | 11.4 | 8.2 | 8.2 | 4.1 | - | - | - | - | ||
| Image-Vp4 | 262 | 3.52 | 18.9 | 12.2 | 9.8 | 6.8 | 5.7 | 4.3 | 4.3 | 1.4 | 1.4 | - | ||
| Figure 25 | Hepatic vein invasion | Image-Vv0 | 726 | 10.09 | 44.7 | 31.4 | 24.6 | 19.8 | 17.5 | 10.4 | 5.6 | 2.8 | 2.8 | - |
| Image-Vv1 | 40 | 5.06 | 18.1 | 18.1 | 18.1 | - | - | - | - | - | - | - | ||
| Image-Vv2 | 77 | 3.32 | 15.0 | 10.0 | 10.0 | - | - | - | - | - | - | - | ||
| Image-Vv3 | 91 | 3.68 | 21.3 | 14.8 | 14.8 | 14.8 | 14.8 | 14.8 | 14.8 | - | - | - | ||
| Extrahepatic spread | Present | 99 | 3.45 | 15.9 | 9.5 | 6.3 | 6.3 | 6.3 | - | - | - | - | - | |
| Absent | 566 | 6.90 | 38.8 | 26.4 | 21.4 | 18.0 | 16.6 | 8.9 | - | - | - | - | ||
| AFP (ng/mL) | ≤10 | 228 | 17.28 | 59.3 | 40.6 | 34.5 | 27.7 | 22.3 | 17.0 | 4.2 | - | - | - | |
| >10 to ≤200 | 292 | 12.02 | 50.3 | 35.1 | 26.8 | 20.4 | 15.5 | - | - | - | - | - | ||
| >200 to ≤400 | 44 | 6.80 | 39.1 | 34.7 | 27.8 | 27.8 | 27.8 | - | - | - | - | - | ||
| >400 to ≤1000 | 68 | 6.41 | 32.9 | 22.2 | 13.3 | 13.3 | 13.3 | 13.3 | 13.3 | - | - | - | ||
| >1000 to ≤10000 | 179 | 6.05 | 31.1 | 19.7 | 19.7 | 13.9 | 13.9 | 11.1 | 11.1 | 3.7 | 3.7 | - | ||
| >10000 | 168 | 3.38 | 14.3 | 9.9 | 8.2 | - | - | - | - | - | - | - | ||
| AFP-L3 fraction (%) | <10 | 182 | 14.98 | 53.9 | 38.6 | 32.1 | 27.8 | 23.5 | 17.1 | - | - | - | - | |
| ≥10 | 325 | 4.67 | 27.7 | 16.6 | 13.5 | 9.3 | 8.2 | 5.4 | 5.4 | - | - | - | ||
| PIVKA-II (mAU/mL) | <40 | 108 | 35.35 | 73.6 | 55.0 | 48.5 | 42.9 | 38.6 | - | - | - | - | - | |
| ≥40 to <300 | 101 | 15.24 | 54.3 | 37.4 | 27.7 | 24.2 | 24.2 | 18.1 | - | - | - | - | ||
| ≥300 to <500 | 39 | 11.27 | 47.8 | 31.9 | 25.5 | 12.7 | 6.4 | - | - | - | - | - | ||
| ≥500 to <1000 | 58 | 10.81 | 43.4 | 24.0 | 21.0 | 16.8 | 11.2 | - | - | - | - | - | ||
| ≥1000 | 629 | 4.70 | 25.3 | 16.0 | 12.0 | 6.8 | 6.8 | 5.5 | 5.5 | 1.8 | 1.8 | - | ||
- Abbreviation: OS, overall survival.
| Survival rate, % (years) | ||||||||||||||
|---|---|---|---|---|---|---|---|---|---|---|---|---|---|---|
| Fig. No. | Title | Category name | n | Median OS (months) | 1 year | 2 years | 3 years | 4 years | 5 years | 6 years | 7 years | 8 years | 9 years | 10 years |
| All patients | 1436 | 8.11 | 40.1 | 20.6 | 14.4 | 10.7 | 8.2 | 6.1 | 5.3 | 3.5 | 2.8 | 2.8 | ||
| Figure 26 | Child–Pugh grade | Child–Pugh A | 774 | 12.25 | 50.4 | 26.4 | 18.0 | 13.6 | 10.3 | 6.5 | 5.7 | 4.3 | 4.3 | 4.3 |
| Child–Pugh B | 479 | 5.42 | 28.0 | 13.4 | 9.1 | 6.0 | 5.0 | 5.0 | 5.0 | 3.7 | 2.5 | 2.5 | ||
| Child–Pugh C | 76 | 3.12 | 14.5 | 4.5 | 4.5 | 4.5 | 4.5 | 4.5 | 4.5 | - | - | - | ||
| mALBI grade | 1 | 280 | 13.86 | 55.4 | 28.8 | 22.3 | 20.0 | 17.3 | 13.5 | 11.2 | 11.2 | 11.2 | 11.2 | |
| 2a | 296 | 11.33 | 47.1 | 25.1 | 16.7 | 9.3 | 8.3 | 4.2 | 4.2 | - | - | - | ||
| 2b | 668 | 6.80 | 34.2 | 17.4 | 12.6 | 8.9 | 5.2 | 4.5 | 4.5 | 3.4 | 2.2 | 2.2 | ||
| 3 | 165 | 4.07 | 25.9 | 13.0 | 4.4 | 4.4 | 4.4 | 4.4 | 4.4 | - | - | - | ||
| No. tumors | 1 | 283 | 11.30 | 47.7 | 22.8 | 16.1 | 13.9 | 9.4 | 8.0 | 5.4 | 5.4 | 5.4 | 5.4 | |
| 2 | 121 | 8.57 | 42.6 | 26.0 | 19.6 | 11.4 | 11.4 | 5.7 | - | - | - | - | ||
| 3 | 69 | 15.18 | 55.6 | 37.8 | 30.4 | 20.2 | 20.2 | 13.5 | 13.5 | 13.5 | 13.5 | 13.5 | ||
| 4 | 33 | 11.76 | 47.8 | 32.4 | 32.4 | 32.4 | 16.2 | 16.2 | 16.2 | 16.2 | 16.2 | 16.2 | ||
| >5 | 779 | 6.97 | 37.6 | 18.0 | 11.4 | 9.2 | 7.4 | 6.1 | 5.4 | 2.7 | 1.3 | 1.3 | ||
| Maximum tumor diameter | ≤2 cm | 59 | 21.62 | 65.2 | 49.2 | 45.4 | 37.8 | 33.6 | 22.4 | - | - | - | - | |
| >2 cm to ≤3 cm | 74 | 18.37 | 63.9 | 38.3 | 35.4 | 22.1 | 14.7 | 14.7 | 14.7 | - | - | - | ||
| >3 cm to ≤5 cm | 212 | 14.85 | 57.0 | 31.8 | 23.5 | 19.7 | 13.8 | 9.2 | 9.2 | 9.2 | 6.1 | 6.1 | ||
| >5 cm to ≤10 cm | 502 | 8.51 | 40.0 | 18.9 | 12.1 | 7.9 | 5.8 | 4.6 | 4.6 | 2.3 | 2.3 | 2.3 | ||
| >10 cm | 370 | 6.08 | 27.8 | 12.1 | 5.5 | 5.5 | 3.9 | 3.0 | - | - | - | - | ||
| Figure 27 | Portal vein invasion | Image-Vp0 | 326 | 14.23 | 55.6 | 32.7 | 22.8 | 15.8 | 14.9 | 8.8 | 7.3 | 7.3 | 4.9 | 4.9 |
| Image-Vp1 | 58 | 10.45 | 46.4 | 24.7 | 14.1 | 9.4 | 9.4 | - | - | - | - | - | ||
| Image-Vp2 | 144 | 12.06 | 50.1 | 28.3 | 15.9 | 13.9 | 7.4 | 7.4 | 3.7 | - | - | - | ||
| Image-Vp3 | 379 | 6.87 | 35.7 | 18.7 | 13.7 | 10.5 | 6.8 | 6.8 | 6.8 | 4.5 | 4.5 | 4.5 | ||
| Image-Vp4 | 478 | 5.72 | 28.1 | 10.5 | 8.1 | 4.7 | 2.8 | 2.8 | 2.8 | - | - | - | ||
| Figure 28 | Hepatic vein invasion | Image-Vv0 | 944 | 9.86 | 44.6 | 22.4 | 15.5 | 11.3 | 9.0 | 5.9 | 4.6 | 4.6 | 3.5 | 3.5 |
| Image-Vv1 | 56 | 7.79 | 40.1 | 25.6 | 15.4 | 5.1 | 5.1 | 5.1 | - | - | - | - | ||
| Image-Vv2 | 123 | 4.93 | 26.6 | 14.3 | 8.0 | 6.4 | 2.1 | 2.1 | 2.1 | 2.1 | 2.1 | 2.1 | ||
| Image-Vv3 | 139 | 6.74 | 31.1 | 15.6 | 10.7 | 8.0 | 8.0 | 8.0 | 8.0 | - | - | - | ||
| extrahepatic spread | Present | 125 | 4.53 | 21.0 | 14.2 | 5.5 | - | - | - | - | - | - | - | |
| Absent | 634 | 9.13 | 43.3 | 19.7 | 12.7 | 12.0 | 10.2 | 6.6 | 6.6 | - | - | - | ||
| AFP (ng/mL) | ≤10 | 199 | 14.78 | 59.1 | 32.4 | 25.2 | 17.8 | 15.8 | 7.9 | 5.9 | 4.0 | 4.0 | 4.0 | |
| >10 to ≤200 | 336 | 12.62 | 50.3 | 27.6 | 17.1 | 12.8 | 9.1 | 7.6 | 7.6 | 7.6 | 7.6 | 7.6 | ||
| >200 to ≤400 | 93 | 7.49 | 36.7 | 14.4 | 10.8 | 5.4 | 5.4 | - | - | - | - | - | ||
| >400 to ≤1000 | 100 | 6.83 | 34.7 | 19.4 | 13.6 | 9.3 | 7.0 | 7.0 | 7.0 | - | - | - | ||
| >1000 to ≤10000 | 277 | 7.82 | 39.9 | 19.1 | 15.4 | 10.0 | 7.2 | 4.8 | 2.4 | 2.4 | - | - | ||
| >10 000 | 223 | 5.39 | 25.9 | 13.3 | 8.9 | 8.9 | 7.5 | 7.5 | 7.5 | 5.0 | 5.0 | 5.0 | ||
| AFP-L3 fraction (%) | <10 | 242 | 15.21 | 56.3 | 33.7 | 24.9 | 15.9 | 11.8 | 11.8 | 8.9 | 4.4 | 4.4 | 4.4 | |
| ≥10 | 571 | 6.60 | 32.4 | 15.4 | 9.7 | 8.3 | 5.5 | 4.3 | 4.3 | 4.3 | 2.9 | 2.9 | ||
| PIVKA-II (mAU/mL) | <40 | 96 | 20.47 | 64.3 | 42.9 | 32.1 | 29.6 | 24.7 | 13.2 | 13.2 | 13.2 | 6.6 | 6.6 | |
| ≥40 to <300 | 91 | 11.04 | 48.5 | 30.5 | 30.5 | 24.6 | 13.7 | 13.7 | 6.8 | - | - | - | ||
| ≥300 to <500 | 54 | 13.77 | 55.0 | 35.7 | 29.1 | 18.2 | 10.9 | 7.3 | - | - | - | - | ||
| ≥500 to <1000 | 89 | 8.38 | 41.0 | 23.6 | 15.0 | 11.2 | 7.5 | - | - | - | - | - | ||
| ≥1000 | 933 | 7.00 | 35.0 | 15.0 | 8.9 | 6.2 | 4.9 | 4.5 | 4.5 | 3.0 | 3.0 | 3.0 | ||
- Abbreviations: OS, overall survival; Vp0, absence of invasion of(or tumor thrombus in) the portal vein; Vp1,invasion of (or tumor thrombus in) distal to the second order branches of the portal vein, but not of the second order branches; Vp2, invasion of (or tumor thrombus in) second order branches of the portal vein; Vp3, invasion of(or tumor thrombus in) first order branches of the portal vein; Vp4, invasion of(or tumor thrombus in) the main trunk of the portal vein and/or contra-lateral portal vein branch to the primarily involved lobe.
| Median OS (month) | Survival rate, % (years) | |||||||||||||
|---|---|---|---|---|---|---|---|---|---|---|---|---|---|---|
| Fig. No. | Title | Category name | n | 1 year | 2 years | 3 years | 4 years | 5 years | 6 years | 7 years | 8 years | 9 years | 10 years | |
| All patients | 1171 | 10.09 | 45.7 | 29.7 | 20.1 | 17.9 | 17.3 | 5.2 | - | - | - | - | ||
| Figure 29 | Child–Pugh grade | Child–Pugh A | 815 | 12.35 | 50.4 | 32.9 | 22.3 | 20.7 | 19.9 | 5.8 | - | - | - | - |
| Child–Pugh B | 271 | 6.31 | 33.6 | 21.0 | 13.1 | 9.2 | 9.2 | - | - | - | - | - | ||
| Child–Pugh C | 17 | 3.48 | 23.5 | 15.7 | 15.7 | 15.7 | 15.7 | - | - | - | - | - | ||
| mALBI grade | 1 | 410 | 14.78 | 57.2 | 38.3 | 26.6 | 25.0 | 23.5 | 6.7 | - | - | - | - | |
| 2a | 268 | 10.74 | 47.4 | 28.7 | 19.1 | 14.7 | - | - | - | - | - | - | ||
| 2b | 438 | 7.39 | 36.0 | 23.7 | 15.6 | 13.7 | 13.7 | - | - | - | - | - | ||
| 3 | 45 | 4.93 | 24.1 | 13.8 | 6.9 | 6.9 | 6.9 | - | - | - | - | - | ||
| No. tumors | 1 | 328 | 14.06 | 54.8 | 36.0 | 28.8 | 26.1 | 26.1 | 26.1 | - | - | - | - | |
| 2 | 118 | 18.46 | 56.2 | 42.4 | 34.5 | 21.6 | 16.2 | - | - | - | - | - | ||
| 3 | 77 | 18.89 | 56.2 | 45.6 | 26.6 | 26.6 | 26.6 | - | - | - | - | - | ||
| 4 | 42 | 22.21 | 58.4 | 48.9 | 20.0 | 20.0 | - | - | - | - | - | - | ||
| >5 | 500 | 7.95 | 35.7 | 19.8 | 10.5 | 9.9 | 9.9 | - | - | - | - | - | ||
| Maximum tumor diameter | ≤2 cm | 80 | 29.40 | 71.0 | 57.1 | 48.2 | 38.1 | 38.1 | - | - | - | - | - | |
| >2 cm to ≤3 cm | 93 | 23.52 | 60.7 | 48.2 | 39.8 | 39.8 | 39.8 | - | - | - | - | - | ||
| >3 cm to ≤5 cm | 188 | 20.04 | 65.5 | 48.0 | 26.5 | 22.0 | 22.0 | - | - | - | - | - | ||
| >5 cm to ≤10 cm | 399 | 9.10 | 41.9 | 22.3 | 11.2 | 10.6 | 9.3 | 4.6 | - | - | - | - | ||
| >10 cm | 289 | 6.97 | 30.8 | 19.7 | 16.9 | 13.9 | 13.9 | - | - | - | - | - | ||
| Figure 30 | Portal vein invasion | Image-Vp0 | 580 | 16.36 | 58.2 | 40.1 | 25.8 | 22.9 | 21.3 | 10.6 | - | - | - | - |
| Image-Vp1 | 70 | 16.23 | 64.1 | 39.5 | 33.7 | 33.7 | 33.7 | - | - | - | - | - | ||
| Image-Vp2 | 117 | 7.75 | 29.4 | 17.9 | 11.6 | 8.7 | 8.7 | - | - | - | - | - | ||
| Image-Vp3 | 182 | 6.08 | 33.8 | 15.8 | 11.1 | 8.0 | 8.0 | - | - | - | - | - | ||
| Image-Vp4 | 167 | 5.19 | 20.7 | 14.3 | 10.4 | 10.4 | - | - | - | - | - | - | ||
| Suppl Figure S9 | Hepatic vein invasion | Image-Vv0 | 824 | 12.29 | 50.3 | 34.6 | 23.6 | 20.8 | 19.7 | 6.6 | - | - | - | - |
| Image-Vv1 | 61 | 11.07 | 48.0 | 26.9 | 17.3 | 17.3 | - | - | - | - | - | - | ||
| Image-Vv2 | 108 | 5.95 | 27.1 | 17.7 | 7.6 | 7.6 | - | - | - | - | - | - | ||
| Image-Vv3 | 104 | 6.83 | 35.1 | 16.1 | 13.8 | 10.4 | - | - | - | - | - | - | ||
| Suppl Figure S10 | Extrahepatic spread | Absent | 668 | 14.49 | 56.1 | 36.7 | 24.5 | 22.3 | 21.0 | 7.0 | - | - | - | - |
| Present | 440 | 6.57 | 31.1 | 19.4 | 13.9 | 13.2 | 13.2 | - | - | - | - | - | ||
| Figure 31 | Vascular invasion and/or extrahepatic spread | Absent | 322 | 25.92 | 72.5 | 51.6 | 32.2 | 28.3 | 25.5 | 12.7 | - | - | - | - |
| Present | 795 | 7.52 | 34.6 | 20.8 | 15.4 | 14.1 | 14.1 | - | - | - | - | - | ||
|
All patients | 309 | 25.79 | 73.1 | 51.4 | 32.0 | 28.0 | 25.2 | 12.6 | - | - | - | - | |
| Child–Pugh A | 251 | 25.92 | 75.0 | 51.9 | 31.8 | 29.2 | 26.3 | 13.1 | - | - | - | - | ||
| Child–Pugh B | 57 | 24.97 | 66.1 | 50.1 | 34.7 | 17.4 | - | - | - | - | - | - | ||
| Child–Pugh C | 1 | 0.89 | - | - | - | - | - | - | - | - | - | - | ||
|
All patients | 756 | 7.59 | 34.6 | 20.8 | 15.4 | 14.1 | 14.1 | - | - | - | - | - | |
| Child–Pugh A | 535 | 8.90 | 38.5 | 23.9 | 18.1 | 16.9 | 16.9 | - | - | - | - | - | ||
| Child–Pugh B | 206 | 5.19 | 25.5 | 13.0 | 8.1 | 6.1 | 6.1 | - | - | - | - | - | ||
| Child–Pugh C | 15 | 3.48 | 20.0 | 13.3 | 13.3 | 13.3 | 13.3 | - | - | - | - | - | ||
| AFP (ng/mL) | ≤10 | 202 | 21.85 | 61.9 | 44.5 | 30.3 | 26.3 | 26.3 | - | - | - | - | - | |
| >10 to ≤200 | 322 | 13.80 | 54.2 | 36.8 | 23.1 | 20.0 | 20.0 | - | - | - | - | - | ||
| >200 to ≤400 | 75 | 13.04 | 50.3 | 33.3 | 22.2 | 16.6 | 16.6 | - | - | - | - | - | ||
| >400 to ≤1000 | 92 | 13.70 | 52.6 | 40.1 | 31.9 | 31.9 | 23.9 | 23.9 | - | - | - | - | ||
| >1000 to ≤10000 | 200 | 7.39 | 35.0 | 19.3 | 10.1 | 8.7 | 8.7 | - | - | - | - | - | ||
| >10000 | 160 | 5.19 | 24.6 | 12.8 | 9.2 | - | - | - | - | - | - | - | ||
| AFP-L3fraction (%) | <10 | 206 | 15.21 | 57.5 | 41.1 | 29.5 | 23.6 | 23.6 | 23.6 | - | - | - | - | |
| ≥10 | 407 | 8.18 | 39.9 | 26.1 | 17.6 | 15.7 | 15.7 | - | - | - | - | - | ||
| PIVKA-II (mAU/mL) | <40 | 122 | 19.65 | 61.3 | 43.3 | 35.0 | 30.0 | - | - | - | - | - | - | |
| ≥40 to <300 | 101 | 15.77 | 61.7 | 35.5 | 21.4 | 21.4 | 14.3 | - | - | - | - | - | ||
| ≥300 to <500 | 42 | 11.40 | 45.7 | 34.1 | 34.1 | 34.1 | - | - | - | - | - | - | ||
| ≥500 to <1000 | 72 | 25.92 | 67.4 | 53.2 | 29.3 | 24.4 | 24.4 | - | - | - | - | - | ||
| ≥1000 | 716 | 7.75 | 36.5 | 22.0 | 14.4 | 13.1 | 13.1 | - | - | - | - | - | ||
- Abbreviation: OS, overall survival.
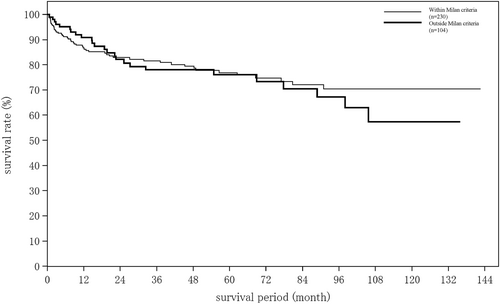
Survival curves of liver transplantation patients within or outside the Milan criteria.
- (3)
Median OS and cumulative survival rates for HCC treated with TACE (Table 28)

Survival curves for hepatocellular carcinoma patients treated with radiofrequency ablation by Child–Pugh grade. The median overall survival for Child–Pugh grade A patients who underwent radiofrequency ablation therapy was 87.92 months, and 5- and 10-year survival rates were 70.6% and 32.5%.
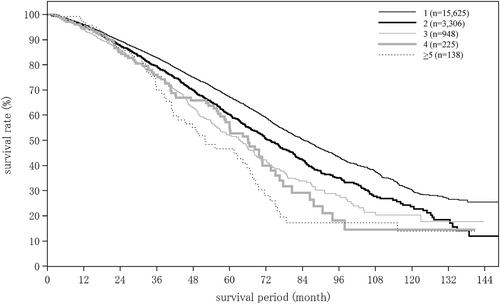
Survival curves for hepatocellular carcinoma patients treated with radiofrequency ablation therapy by number of tumors.
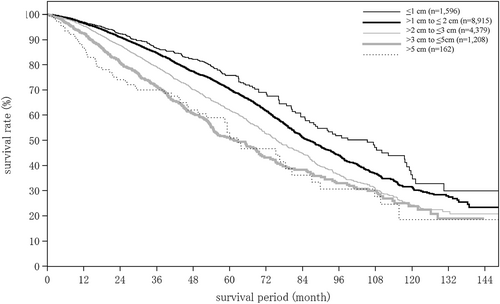
Survival curves for hepatocellular carcinoma patients treated with radiofrequency ablation therapy by maximum tumor diameter.
- (4)
Median OS and cumulative survival rates for HCC treated with one-shot HAIC (Table 29).
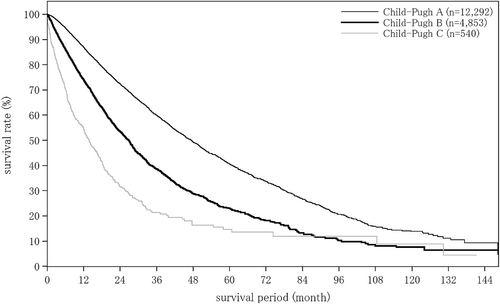
Survival curves for hepatocellular carcinoma patients treated with transcatheter arterial chemoembolization by Child–Pugh grade. The median overall survival for Child–Pugh grade A patients who underwent transcatheter arterial chemoembolization was 47.44 months, and 5- and 10-year survival rates were 40.6% and 13.9%.
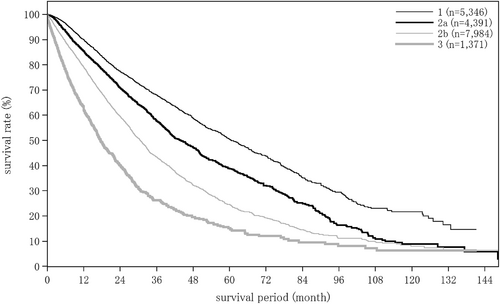
Survival curves for hepatocellular carcinoma patients treated with transcatheter arterial chemoembolization by modified albumin-bilirubin grade.
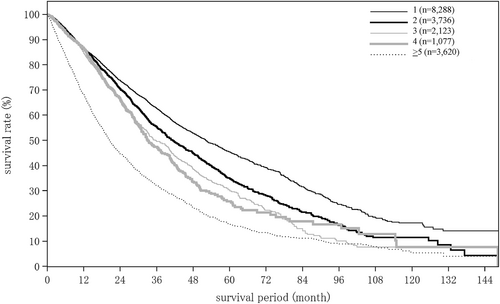
Survival curves for hepatocellular carcinoma patients treated with transcatheter arterial chemoembolization by number of tumors.
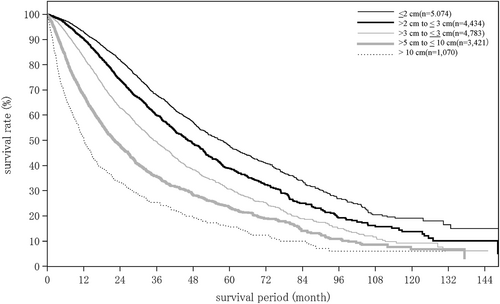
Survival curves for hepatocellular carcinoma patients treated with transcatheter arterial chemoembolization by maximum tumor diameter.
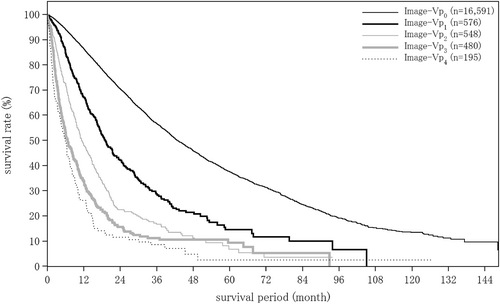
Survival curves for hepatocellular carcinoma patients treated with transcatheter arterial chemoembolization by portal vein invasion.
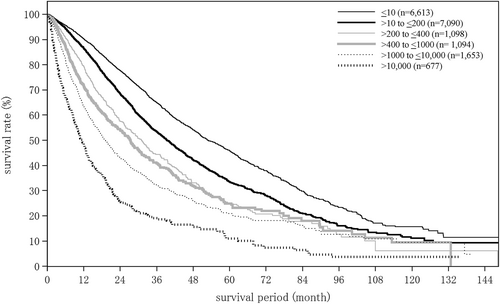
Survival curves for hepatocellular carcinoma patients treated with transcatheter arterial chemoembolization by α-fetoprotein level.
- (5)
Median OS and cumulative survival rates for HCC treated with continuous HAIC using a reservoir (Table 30)
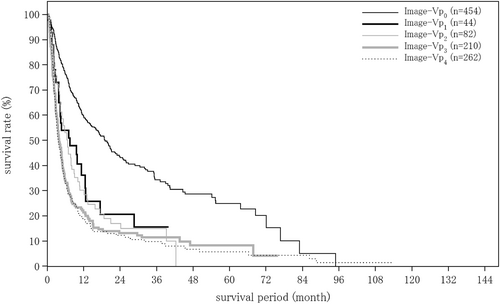
Survival curves for hepatocellular carcinoma patients treated with one-shot hepatic arterial infusion chemotherapy by the extent of portal vein invasion.
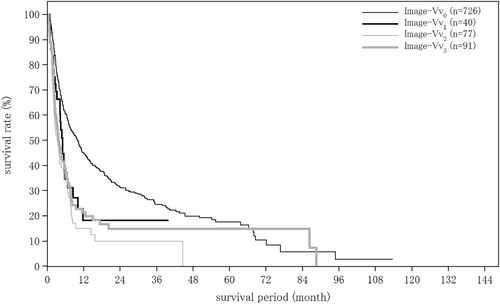
Survival curves for hepatocellular carcinoma patients treated with one-shot hepatic arterial infusion chemotherapy by the extent of hepatic vein invasion.
- (6)
Median OS and cumulative survival rates for HCC treated with systemic chemotherapy (molecular targeted therapy; Table 31)
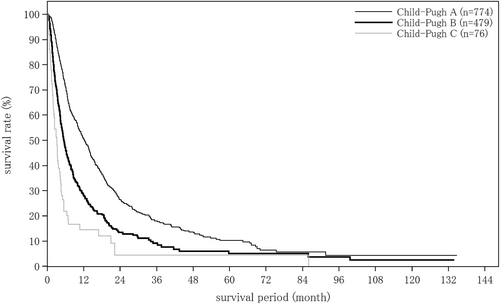
Survival curves for hepatocellular carcinoma patients treated with hepatic arterial infusion chemotherapy using a reservoir (implanted port system) by Child–Pugh grade.
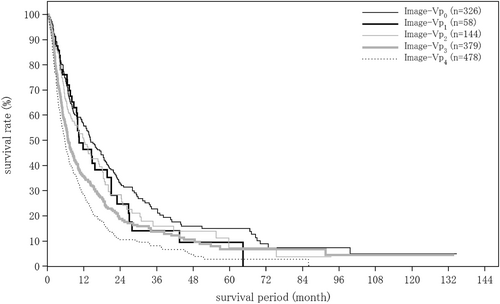
Survival curves for hepatocellular carcinoma patients treated with continuous hepatic arterial infusion chemotherapy using a reservoir (implanted port system) by the extent of portal vein invasion.
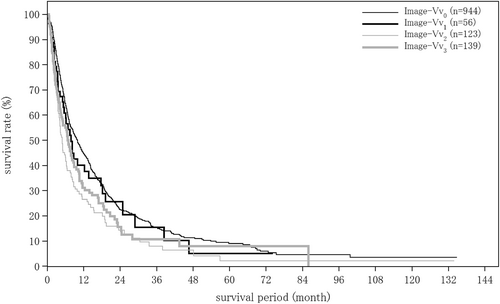
Survival curves for hepatocellular carcinoma patients treated with continuous hepatic arterial infusion chemotherapy using a reservoir (implanted port system) by the extent of hepatic vein invasion.
The median OS for patients with a Child–Pugh grade A who underwent systemic chemotherapy (molecular targeted therapy) was 12.35 months, and the 5-year survival rate was 19.9% (Figure 29).
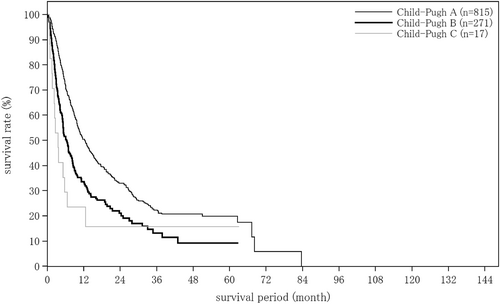
Survival curves for hepatocellular carcinoma patients treated with systemic therapy by Child–Pugh grade. The median overall survival for Child–Pugh grade A patients treated by systemic therapy was 12.35 months, and 5-year survival was 19.9%.
- (7)
Median OS and cumulative survival rates for ICC and combined HCC

Survival curves for hepatocellular carcinoma patients treated with systemic therapy by the extent of portal vein invasion.
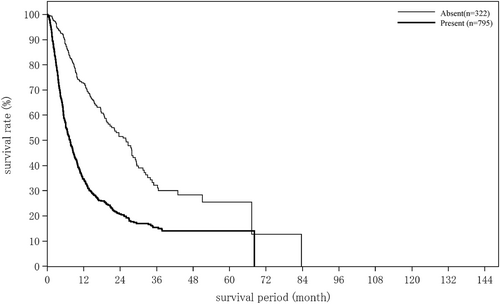
Survival curves for hepatocellular carcinoma patients treated with systemic therapy by the presence or absence of vascular invasion and/or extrahepatic spread.
Tables 32 and 33 show median OS and cumulative survival rates for patients with ICC (all patients and by patient factors) and patients with combined HCC and ICC (all patients). The median OS, 5-year and 10 year-survival rates for ICC who received resection was 56.34 months, and 48.3% and 26.5% (Supplementary Figure S11). The tumor diameter, the number of tumors, and CA 19-9 level were correlated with survival in ICC (Figures 32-35). The median OS, 5 year- and 10 year-survival rates for combined HCC and ICC treated by resection (n = 655) was 65.12 months, 53.4% and 33.7% (Figure 35).
| Survival rate, % (years) | ||||||||||||||
|---|---|---|---|---|---|---|---|---|---|---|---|---|---|---|
| Fig. No. | Title | Category name | n | Median OS (months) | 1 year | 2 years | 3 years | 4 years | 5 years | 6 years | 7 years | 8 years | 9 years | 10 years |
| All patients | 5748 | 21.45 | 62.5 | 47.7 | 40.4 | 36.6 | 33.0 | 29.2 | 25.8 | 22.2 | 19.9 | 17.9 | ||
| Suppl Figure S11 | Resection | Yes | 3406 | 56.34 | 82.9 | 67.2 | 58.7 | 53.3 | 48.3 | 43.5 | 38.6 | 32.9 | 29.7 | 26.5 |
| No | 171 | 45.31 | 74.6 | 59.9 | 51.8 | 48.2 | 41.8 | 36.2 | 33.2 | 29.9 | 19.9 | 19.9 | ||
| Figure 32 | Resected: Maximum tumor diameter | ≤2 cm | 446 | 94.49 | 92.7 | 82.6 | 74.2 | 69.2 | 65.6 | 61.0 | 57.2 | 49.8 | 46.0 | 46.0 |
| >2 cm to ≤5 cm | 1736 | 67.42 | 86.8 | 71.4 | 62.2 | 56.4 | 52.3 | 46.3 | 40.9 | 35.8 | 30.8 | 28.1 | ||
| >5 cm to ≤10 cm | 898 | 32.00 | 74.3 | 56.0 | 48.3 | 43.7 | 36.8 | 33.4 | 30.4 | 23.0 | 21.4 | 17.3 | ||
| >10 cm | 158 | 19.78 | 63.1 | 39.9 | 31.8 | 30.1 | 18.8 | 15.1 | 7.5 | 7.5 | 7.5 | 7.5 | ||
| Figure 33 | Resected: No. tumors | 1 | 2869 | 65.48 | 85.2 | 70.5 | 62.5 | 57.1 | 52.1 | 47.3 | 42.7 | 37.1 | 33.2 | 29.3 |
| 2 | 192 | 44.98 | 84.2 | 64.7 | 52.0 | 47.1 | 43.2 | 34.1 | 27.3 | 11.7 | 11.7 | 11.7 | ||
| ≥3 | 250 | 16.95 | 62.3 | 37.8 | 28.3 | 21.8 | 18.0 | 16.0 | 16.0 | 16.0 | 16.0 | - | ||
| Resection curability | Curability A or B | 380 | 71.79 | 87.7 | 76.6 | 68.6 | 66.0 | 57.9 | 48.6 | 45.5 | 33.6 | 29.4 | 22.1 | |
| Curability C | 597 | 25.03 | 69.1 | 50.6 | 39.0 | 34.8 | 31.5 | 28.6 | 28.6 | 23.8 | 13.0 | 13.0 | ||
| Resection metastasis | N0 | 2499 | 74.74 | 87.9 | 74.9 | 66.2 | 61.0 | 56.1 | 50.6 | 46.1 | 39.5 | 35.0 | 31.2 | |
| N1 | 732 | 18.60 | 65.8 | 40.4 | 33.2 | 26.8 | 23.1 | 20.4 | 16.5 | 15.4 | 15.4 | 15.4 | ||
| CEA (ng/ml) | ≦9.9 | 2638 | 65.28 | 85.5 | 70.7 | 61.7 | 56.3 | 51.2 | 46.3 | 41.1 | 35.3 | 31.2 | 27.2 | |
| ≦9.9 | 186 | 25.20 | 72.9 | 50.9 | 36.6 | 30.8 | 21.2 | 15.9 | 15.9 | - | - | - | ||
| ≦49.9 | 121 | 18.60 | 62.9 | 45.2 | 39.3 | 34.8 | 31.3 | 31.3 | 31.3 | 31.3 | 31.3 | 31.3 | ||
| ≦99.9 | 58 | 16.85 | 71.1 | 35.3 | 30.2 | 30.2 | 30.2 | 30.2 | - | - | - | - | ||
| ≧100 | 98 | 11.24 | 47.9 | 26.7 | 22.4 | 17.6 | 17.6 | 17.6 | 17.6 | 17.6 | 17.6 | 17.6 | ||
| Figure 34 | CA19-9 (U/ml) | <37 | 1370 | 83.88 | 89.7 | 77.8 | 70.4 | 66.1 | 59.6 | 54.0 | 49.7 | 43.8 | 40.7 | 39.1 |
| ≦99 | 515 | 67.09 | 86.8 | 74.3 | 64.6 | 56.1 | 51.9 | 48.5 | 41.5 | 35.6 | 33.2 | 25.8 | ||
| ≦299 | 372 | 40.44 | 81.0 | 64.4 | 54.4 | 45.9 | 43.6 | 36.6 | 25.1 | 25.1 | - | - | ||
| ≦999 | 291 | 27.40 | 78.0 | 52.7 | 40.1 | 33.1 | 29.4 | 26.4 | 23.1 | 19.8 | 16.5 | 8.8 | ||
| ≦2999 | 224 | 21.13 | 70.5 | 43.3 | 31.7 | 28.9 | 25.3 | 23.0 | 18.4 | 15.3 | 10.2 | - | ||
| ≦9999 | 139 | 14.65 | 58.6 | 32.1 | 25.4 | 23.4 | 18.6 | 14.9 | 14.9 | - | - | - | ||
| ≧10 000 | 149 | 12.62 | 51.3 | 23.2 | 13.1 | 13.1 | 6.5 | 6.5 | - | - | - | - | ||
| Fig. No. | Title | Category name | n | Median OS (month) | Survival rate, % (years) | |||||||||
|---|---|---|---|---|---|---|---|---|---|---|---|---|---|---|
| 1 year | 2 years | 3 years | 4 years | 5 years | 6 years | 7 years | 8 years | 9 years | 10 years | |||||
| Figure 35 | All patients | 980 | 29.70 | 65.3 | 53.0 | 46.7 | 43.2 | 40.0 | 36.2 | 32.9 | 30.8 | 28.0 | 26.0 | |
| Hepatic resection | Resection (+) | 655 | 65.12 | 81.4 | 67.3 | 60.3 | 56.3 | 53.4 | 47.9 | 43.3 | 40.3 | 36.3 | 33.7 | |
| Resection (−) | 117 | 15.64 | 58.2 | 43.3 | 29.0 | 22.6 | 15.1 | 15.1 | 15.1 | 15.1 | 15.1 | - | ||
- Abbreviation: OS, overall survival.
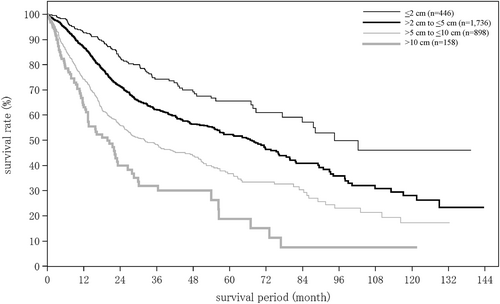
Survival curves for resected intrahepatic cholangiocarcinoma patients by maximum tumor diameter.
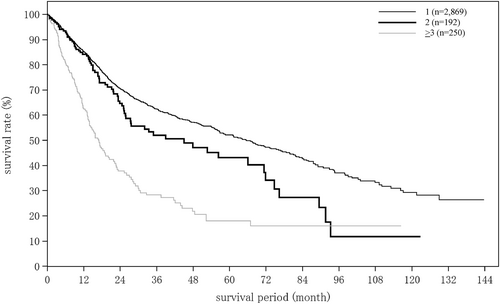
Survival curves for resected intrahepatic cholangiocarcinoma by number of tumors.
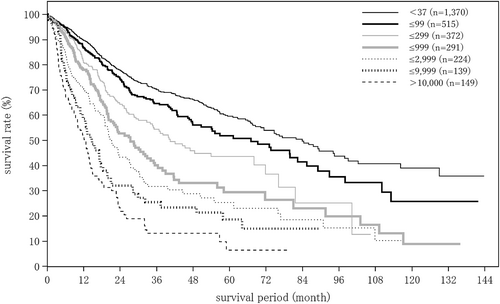
Survival curves for resected intrahepatic cholangiocarcinoma by CA19-9 level (ng/mL).
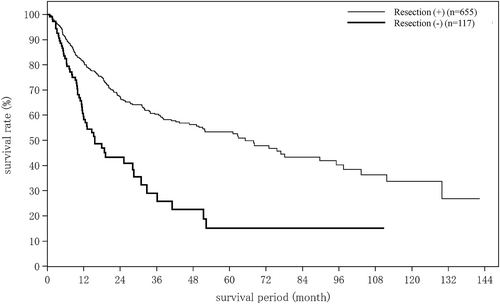
Survival curves for patients with combined hepatocellular carcinoma and intrahepatic cholangiocarcinoma by receiving resection or no resection.
Changes in survival outcome over time
-
Changes in survival outcome for HCC
Cumulative survival rates were calculated by registration date for previously registered patients with HCC whose final outcome was survival or death (excluding unknown; Table 34). Patients were grouped into five time period groups by 8-year periods (with the exception of period 5, which is a 6-year period). Period 1 consisted of those registered in the fifth to eighth surveys (1978–1985), period 2 of those registered in the ninth to 12th surveys (1986–1993), period 3 of those registered in the 13th to 16th surveys (1994–2001), period 4 of those registered in the 17th to 20th surveys (2002–2009). and period 5 of those registered in the 21st to 23rd surveys (2010–2015). The median OS and cumulative survival rates for HCC were calculated for each of these groups (Table 34, Figure 36). The median OS and cumulative survival rates (5-year/10-year) were 5.03 months and 12.3%/5.2% for period 1 (1978–1985, n = 5570), 25.59 months and 25.5%/10.1% for period 2 (1986–1993, n = 32 720), 41.40 months and 38.3%/19.3% for period 3 (1994–2001, n = 63 862), 59.27 months and 49.6%/25.8% for period 4 (2002–2009, n = 65 862), and the 5-year survival rate was 63.4% for period 5 (2010–2015, n = 44 542). The number of new registrations has been increasing over time, and the prognosis of HCC is improving dramatically (Table 34, Figure 36).
-
Changes in survival outcome for intrahepatic cholangiocarcinoma
| Median OS (month) | Survival rate, % (years) | |||||||||||||
|---|---|---|---|---|---|---|---|---|---|---|---|---|---|---|
| Fig. No. | Title | Category name | n | 1 year | 2 years | 3 years | 4 years | 5 years | 6 years | 7 years | 8 years | 9 years | 10 years | |
| Figure 36 |
|
Registered in 5th to 8th surveys (1978–1985) | 5570 | 5.03 | 34.2 | 23.7 | 18.6 | 15.3 | 12.3 | 10.0 | 8.6 | 7.3 | 6.0 | 5.2 |
| Registered in 9th to 12th surveys (1986–1993) | 32,720 | 25.59 | 66.9 | 51.7 | 40.5 | 31.9 | 25.5 | 20.5 | 16.9 | 14.1 | 11.7 | 10.1 | ||
| Registered in 13th to 16th surveys (1994–2001) | 63,232 | 41.40 | 78.3 | 65.0 | 54.2 | 45.4 | 38.3 | 32.9 | 28.4 | 24.7 | 21.7 | 19.3 | ||
| Registered in 17th to 20st surveys (2002–2009) | 65,862 | 59.27 | 84.4 | 73.8 | 64.8 | 56.6 | 49.6 | 43.4 | 37.9 | 33.0 | 29.1 | 25.8 | ||
| Registered in 21st to 23rd surveys (2010–2015) | 44,542 | - | 82.9 | 74.9 | 69.0 | 65.7 | 63.4 | 61.3 | 61.3 | 61.3 | - | - | ||
| Figure 37 |
|
Registered in 5th to 8th surveys (1978–1985) | 340 | 3.71 | 21.3 | 15.0 | 12.0 | 12.0 | 11.4 | 9.5 | 9.5 | 9.5 | 8.5 | 8.5 |
| Registered in 9th to 12th surveys (1986–1993) | 1057 | 7.56 | 38.3 | 25.6 | 20.6 | 16.8 | 14.2 | 11.7 | 10.4 | 9.6 | 8.0 | 7.7 | ||
| Registered in 13th to 16th surveys (1994–2001) | 2215 | 11.93 | 49.9 | 33.5 | 27.7 | 23.8 | 20.9 | 18.9 | 17.9 | 16.3 | 14.7 | 13.9 | ||
| Registered in 17th to 20st surveys (2002–2009) | 3187 | 21.22 | 62.9 | 47.1 | 39.8 | 35.5 | 31.0 | 27.7 | 24.3 | 20.7 | 18.3 | 16.8 | ||
| Registered in 21st to 23rd surveys (2010–2015) | 3263 | 20.14 | 61.1 | 47.1 | 40.3 | 37.2 | 36.1 | - | - | - | - | - | ||
| Figure 38 |
|
Registered in 5th to 8th surveys (1978–1985) | 69 | 2.86 | 15.5 | 7.7 | 7.7 | 6.2 | 6.2 | 3.1 | 3.1 | 3.1 | 3.1 | 3.1 |
| Registered in 9th to 12th surveys (1986–1993) | 126 | 19.55 | 61.9 | 35.8 | 29.0 | 23.7 | 22.6 | 21.4 | 18.7 | 17.3 | 17.3 | 17.3 | ||
| Registered in 13th to 16th surveys (1994–2001) | 341 | 14.49 | 53.1 | 36.6 | 27.8 | 23.3 | 21.0 | 19.5 | 16.7 | 15.5 | 14.2 | 12.1 | ||
| Registered in 17th to 20st surveys (2002–2009) | 502 | 24.11 | 65.8 | 50.4 | 42.5 | 38.7 | 34.5 | 31.5 | 28.8 | 26.1 | 23.4 | 22.2 | ||
| Registered in 21st to 23rd surveys (2010–2015) | 588 | 36.17 | 64.0 | 54.0 | 50.0 | 48.6 | 47.3 | - | - | - | - | - | ||
- Abbreviation: OS, overall survival.
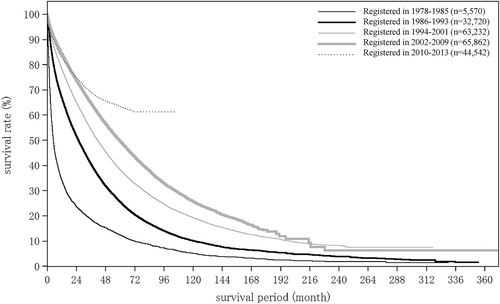
Changes in survival over time for hepatocellular carcinoma patients. Cumulative overall survivals among patients newly registered between 1978 and 2015 (n = 211 926) were compared by dividing them into five groups by registration date. The median overall survival and cumulative survival rates (5-year/10-year) was 5.03 months and 12.3%/5.2% for period 1 (1978–1985, n = 5570), 25.59 months and 25.5%/10.1% for period 2 (1986–1993, n = 32 720), 41.40 months and 38.3%/19.3% for period 3 (1994–2001, n = 63 232), and 59.37 months, 49.1%/25.6% for period 4 (2002–2019, n = 65 862); median overall survival was not reached, and 5-year survival rate was 63.4% for period 5 (2010–2015, n = 44 542).
- 3.
Changes in survival outcome for combined HCC and ICC
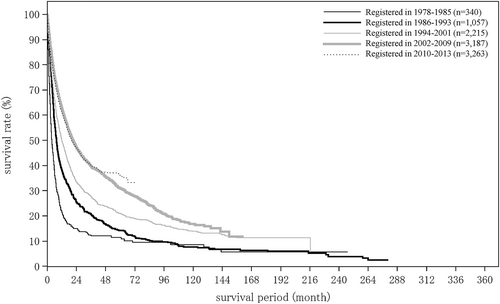
Changes in survival over time for intrahepatic cholangiocarcinoma. A total of 10 062 patients were registered between 1978 and 2015. The median overall survival and cumulative survival rates (5-year/10-year) was 3.71 months and 11.4%/8.5% for period 1 (n = 340), 7.56 months and 14.2%/7.7% for period 2 (n = 1057), 11.93 months and 20.9%/13.9% for period 3 (n = 2215), 21.22 months and 31.3%/17.8% for period 4 (n = 31,87), and 28.94 months for period 5 (n = 3263).
The median OS and cumulative survival rates were calculated to determine how survival has changed over time in combined HCC and ICC. Median OS and survival rates (5-year/10-year) were 2.86 months and 6.2%/3.1% for period 1 (n = 69), 19.55 months and 22.6%/17.3% for period 2 (n = 126), and 14.49 months and 21.0%/12.1% for period 3 (n = 341), 24.11 months and 34.5%/22.3% for period 4 (n = 502), and 36.17 months and 47.3% (5-year survival rate) for period 5 (n = 588; Table 34, Figure 38).
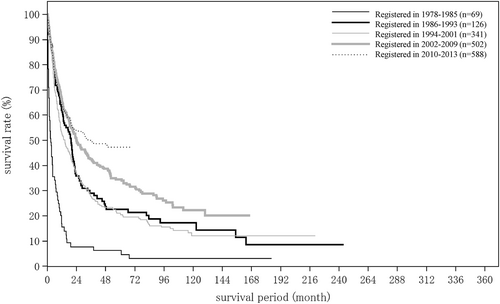
Changes in survival over time for combined hepatocellular cholangiocarcinoma. A total of 1626 patients were registered between 1978 and 2015. The median overall survival and cumulative survival rates (5-year/10-year) were 2.86 months and 6.2%/3.1% for period 1 (n = 69), 19.55 months and 22.6%/17.3% for period 2 (n = 126), 14.49 months and 21.0%/12.1% for period 3 (n = 341), 24.11 months and 35.1%/22.3% for period 4 (n = 502), the median OS and 5-year survival were not available for period 5 (n = 369).
CONCLUSION
Primary liver cancer is the fifth most common cause of cancer death in Japan after lung cancer, colorectal cancer, gastric cancer, and pancreatic cancer. The number of deaths from HCC peaked at 34 637 in 2002, and has continued to decrease gradually every year since. Nevertheless, it is reported that >24 000 people still die of HCC each year.122 Approximately 50% of the patients with primary liver cancer in Japan were newly registered in the 23rd Nationwide Follow-up Survey of Primary Liver Cancer.
Compared with the 22nd survey, the population of patients with HCC in this survey was older at the time of clinical diagnosis, had more female patients, was less frequently positive for hepatitis B surface antigen and hepatitis C virus antibody, had smaller tumor diameters, and was more frequently treated with resection and with radiofrequency ablation as local ablation therapy. Calculation of the median OS and cumulative survival rates for patients newly registered in five time periods between 1978 and 2013 revealed marked improvement in survival outcome for HCC, which can be attributed to establishment of a nationwide surveillance system and advances in early diagnosis and treatment.122-124
We believe that this large set of data from registered patients analyzed in this follow-up survey will advance research on and treatment outcomes of primary liver cancer in the world.
ACKNOWLEDGMENTS
The authors express sincere gratitude to all the doctors at collaborating institutions across Japan who contributed to this Nationwide Follow-up Survey Study by the Japan Association of Liver Cancer (Formerly Liver Cancer Study Group of Japan).
CONFLICT OF INTEREST STATEMENT
Dr Shoji Kudo, Dr Ryosuke Tateishi, and Dr Takamichi Murakami are Editorial Board members of Hepatology Research and coauthors of this article. To minimize bias, they were excluded from all editorial decision-making related to the acceptance of this article for publication. Dr Masayuki Kurosaki is Editor-in-Chief of the journal and a coauthor of this article. He was excluded from the peer-review process and all editorial decisions related to the acceptance and publication of this article. Peer-review was handled independently by Yoshiyuki Ueno of this manuscript to minimize bias. Dr Michiie Sakamoto is a former member of Hepatology Research Editorial Board and coauthor of this article.
ETHICS STATEMENT
Approval of the research protocol: Kindai University Ethics Committee 19-069.
Informed Consent: Not necessary, as this was an observational study.
Registry and the Registration No. of the study/trial: N/A.
Animal Studies: N/A.
Research involving recombinant DNA: N/A.
Open Research
DATA AVAILABILITY STATEMENT
The data that support the findings of this study are available from the corresponding author upon reasonable request.


