Invasive Fish Reshape Biodiversity Patterns in China's Freshwater Lakes
Funding: This work was supported by the earmarked fund for China Agriculture Research System (CARS-45), National Natural Science Foundation of China (32172980), National Key Research and Development Program of China (2023YFD2400900), and China Scholarship Council (202304910486).
ABSTRACT
Globalization has dramatically accelerated the spread of non-native species, intensifying threats to freshwater ecosystems. While China ranks among the most heavily invaded countries, the role of non-native species as key drivers of biodiversity changes is often overlooked in research on anthropogenic impacts. This oversight hampers the development of effective conservation and management strategies by limiting a full understanding of what shapes biodiversity patterns. To bridge this gap, an extensive dataset from 131 lakes across China was compiled and analyzed using a novel composite diversity index that integrates species richness with functional and phylogenetic uniqueness, allowing for a more precise identification of fish multidimensional diversity hotspots. Additionally, gradient forest models were employed to elucidate the impacts of non-native species, geography, climate, and physicochemical factors on these patterns. Our findings revealed significant taxonomic and functional homogenization in non-native hotspots within the overall fish community, coupled with phylogenetic diversification. Notably, non-native fish diversity emerged as the primary factor shaping overall and native fish multidimensional diversity patterns. While the establishment of non-native species may provide an immediate enhancement to overall diversity, it often leads to the extirpation/extinction of native species, ultimately resulting in biodiversity loss at local and potentially the regional scale. This study highlights the importance of examining multiple dimensions to characterize the intricate dynamics between native and non-native species, which is essential for understanding their true impact on biodiversity and for achieving global conservation goals.
1 Introduction
Freshwater ecosystems are some of the most endangered on Earth (Dudgeon 2010; Reid et al. 2019), with most of the world's lakes significantly impacted by human activities (Carpenter et al. 2011; Dudgeon et al. 2006; Su et al. 2021). In today's globalized world, where the movement of people and goods accelerates species invasions, the introduction of non-native species has wreaked havoc—disrupting ecosystems (Reid et al. 2019; Su et al. 2021; Tedesco et al. 2017), outcompeting or preying on native species, and reshaping biodiversity patterns (Cucherousset and Olden 2011; Liu et al. 2017).
To tackle these challenges, it is essential to identify current biodiversity hotspots and understand the role of non-native species, alongside other factors, in shaping biodiversity (Cucherousset and Olden 2011; Olden et al. 2010; Strayer and Dudgeon 2010). To achieve these objectives, species richness (i.e., the number of species within a community), and related diversity measures (e.g., Shannon–Wiener index) have traditionally been used as proxies for diversity to describe biodiversity patterns and explore their determining factors (Abell et al. 2008; Dawson et al. 2017; Guo et al. 2019; He et al. 2020; Kang et al. 2014). However, focusing only on taxonomic diversity overlooks other important aspects. The additional consideration of functional diversity, which quantifies the variety of functions and resource use strategies, and phylogenetic diversity, which quantifies the relationship of different evolutionary lineages, provides a more complete picture of biodiversity and species differences (Su et al. 2021, 2023; Tao et al. 2023; Xiang et al. 2023; Xu et al. 2024). For many taxonomic groups, detailed trait data remain scarce, whereas evolutionary relationships are often better documented (Mouquet et al. 2012). Given that species traits can be shaped by shared evolutionary history, some researchers have proposed using phylogeny as a surrogate for unmeasured or difficult-to-measure traits (Faith 1992; Gerhold et al. 2018; Winter et al. 2013). However, this approach—known as “phylogeny-by-proxy”—remains contentious due to the often weak or inconsistent correlation between phylogenetic and functional diversity, as well as the lack of strong phylogenetic signal in many traits (Mazel et al. 2017, 2018; Winter et al. 2013).
To overcome these limitations, combining taxonomic, functional, and phylogenetic diversities into a composite index can provide a more integrated measure of biodiversity patterns, allowing for more effective conservation strategies (Chao et al. 2014; Nakamura et al. 2020; Su et al. 2021; Tordoni et al. 2024; Villéger et al. 2010; Winter et al. 2013). Most research on these aspects has been concentrated in developed countries like those in North America (Qian et al. 2020, 2021; Su et al. 2023) and Europe (Côte et al. 2023; Devictor et al. 2010; Gaüzère et al. 2022), leaving a gap in biodiversity studies for developing countries, especially in the application of these composite indices to address important questions in conservation.
China, one of the most biodiverse countries globally (McNeely et al. 1990; Tang et al. 2006), has long utilized its freshwater resources for fisheries to meet growing demands for food (Hu et al. 2021; Wang et al. 2015; Xiong et al. 2023). However, this demand has also made it one of the countries having the most invasive species, with over 400 non-native freshwater fish species (Liu et al. 2017; Xiong et al. 2015). These introductions pose severe threats to native species and have caused noticeable taxonomic homogenization of freshwater fish communities (Liu et al. 2017; Xiang et al. 2023). Since lakes are often spatially discrete and have relatively low connectivity compared with rivers and marine systems and many terrestrial habitats, they are excellent systems to study the impact of non-native species and other pressures (Heino et al. 2021).
Despite these challenges, non-native fishes are often overlooked as potential drivers of biodiversity change in studies on China's freshwater ecosystems (Guo et al. 2019; Kang et al. 2014; Tao et al. 2023; Xiang et al. 2023; Zhao et al. 2006). This gap leads to an incomplete understanding of biodiversity patterns and may misguide conservation priorities. Here, we developed a composite diversity index, combining species richness with functional and phylogenetic uniqueness, allowing for a more precise multidimensional identification of fish diversity hotspots. Additionally, gradient forest models were determined to assess the effects of non-native fish introductions and environmental pressures on China's freshwater biodiversity. We focused on three key questions: Where are the multidimensional diversity hotspots for both native and non-native fishes? Are these hotspots showing signs of taxonomic, functional, and phylogenetic homogenization? Finally, are non-native species the main forces shaping current biodiversity patterns, and how will these trends change as invasion increases? By identifying the key drivers of biodiversity patterns in China's lake ecosystems, we provide essential insights for developing targeted conservation strategies that safeguard native fish diversity amid growing ecological threats.
2 Methods
2.1 Biodiversity Patterns and Hotspots of Freshwater Fish α-Diversity
2.1.1 Fish Occurrence, Functional Traits and Phylogenetic Data Set
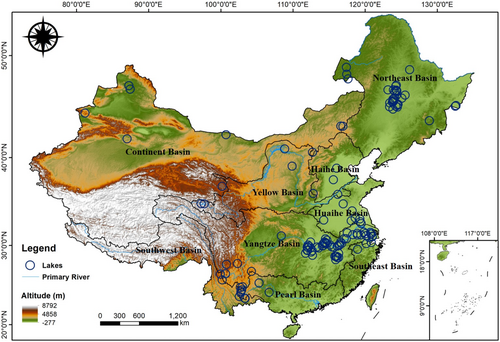
We compiled data on 328 fish species from 131 major lakes (Figure 1; Appendix S1), using a thorough review of literature sources such as journal articles, monographs, survey reports, and recent field surveys—all conducted after 2000 (Guo et al. 2019; Kang et al. 2014; Xiang et al. 2023; Zhang and Zhao 2016; Zhao et al. 2006). While sampling efforts varied, we reduced potential bias by focusing on species presence, converting quantitative data into occurrence data. To overcome the biases caused by gaps in early monitoring data, non-native fish species were defined as those with documented records of introduction to a given lake or lake group (Figure 1; Appendix S1; Xiong et al. 2015). All fish species names were cross-checked using Eschmeyer's Catalog of Fishes (Van Der Laan et al. 2024).
We recorded 15 functional traits for each species, including eight continuous and seven categorical variables (Appendix S2: Table S1), sourced from Fishbase (www.fishbase.se). These traits, essential for analyzing functional diversity, were related to feeding (e.g., dietary preference, snout length, water column position), reproduction (e.g., spawning and reproductive modes), and movement (e.g., pectoral fin position, swimming ability, rheophily). We assumed low intraspecific variability compared to interspecific variation. This assumption enables us to treat species' functional traits as constant for the purpose of analyzing functional diversity patterns, focusing on interspecific differences rather than individual-level trait variability (McGill et al. 2006).
Mitochondrial CO I gene sequences (cytochrome c oxidase subunit I) for each species were retrieved from the National Center for Biotechnology Information (NCBI) public database (accessible at https://www.ncbi.nlm.nih.gov/) (Benson et al. 1990). We used Mega 7.0 software and the neighbor-joining method (Hall 2013) to build a phylogenetic tree (Appendix S2: Figure S1).
2.1.2 Fish Multidimensional α-Diversity
The quantification of taxonomic, functional, and phylogenetic α-diversities relies on our comprehensive fish occurrence database developed for 131 major lakes in China. This database includes overall occurrence data as well as separate databases for native and non-native fishes. We calculated overall fish taxonomic diversity (OA_TD), native fish taxonomic diversity (NA_TD), and non-native fish taxonomic diversity (NN_TD) based on species richness. Overall fish functional diversity (OA_FD), native fish functional diversity (NA_FD), and non-native fish functional diversity (NN_FD) were measured using the convex hull volume of the functional trait space filled by species in each assemblage (functional richness, FRic) (Villéger et al. 2008), with the “dbFD” function from the “FD” package in R (Laliberté and Legendre 2010). Overall fish phylogenetic diversity (OA_PD), native fish phylogenetic diversity (NA_PD), and non-native fish phylogenetic diversity (NN_PD) were assessed using Faith's PD metric (Faith 1992) with the “pd” function from the “picante” package in R (Kembel et al. 2010).
2.1.3 Hotspots Identification of Fish Multidimensional Diversity
To better reveal spatial patterns in multidimensional diversity, we developed a novel composite diversity index (OA_CD, NA_CD, NN_CD) that integrates taxonomic (TD), functional (FD), and phylogenetic (PD) diversities. Each diversity metric was standardized using z-scores by subtracting the mean and dividing by the standard deviation of the respective index, ensuring comparability across scales. To retain only positive contributions that signify above-average levels of diversity, we applied a transformation to the effect sizes of TD, FD, and PD to set all negative values to zero. The transformed values were then equally weighted (1/3 each) and averaged to construct the composite diversity index. Equal weighting ensures that no single dimension dominates the index, allowing for a balanced representation of biodiversity patterns. This new index offers a measure of diversity patterns that integrates multiple biodiversity dimensions. Rather than replacing existing indices, it provides an additional, integrative measure across different forms of diversity. We employed the Getis-Ord Gi statistic to identify statistically significant hotspots of NA_CD, NN_CD, NA_TD, NN_TD, NA_FD, NN_FD, NA_PD, and NN_PD, a robust method for detecting areas with exceptionally high diversity (Getis and Ord 1992). The analysis was carried out using the “localG” function from the “spdep” package in R (Bivand et al. 2014).
2.2 Temporal Variation in β-Diversity Within Non-Native Fish Hotspots
2.2.1 Fish Occurrence, Functional Traits, and Phylogenetic Dataset
Long-term studies on species introductions are crucial, as their impacts can unfold over decades, often leading to native extirpations long after the initial disturbance—a phenomenon known as extinction debt (Crystal-Ornelas and Lockwood 2020; Essl et al. 2015; Rahel 2002). In contrast, short-term assessments may identify instances where impacts occur very quickly or could overlook these delayed effects, potentially leading to misleading conclusions. To examine such temporal shifts, we focused on 12 hotspots for non-native fishes on the Yunnan-Guizhou-Chuan Plateau in southwestern China. The major invasions of non-native fish species occurred around the 1990s, leading to significant shifts in community composition in the following decades (Kang et al. 2023). To assess these long-term changes, we compared the fish occurrence records for the pre-1990 period (Chu 1990; Gao 1990; Li 1982; Wu 1989) with post-2000 data to assess long-term changes in fish diversity. The functional traits and phylogenetic datasets were calculated following the methods outlined in Section 2.1.1. We used Pagel's λ to assess phylogenetic signal, which measures the association between trait variation and phylogenetic relatedness (Pagel 1999). A λ value near zero indicates no phylogenetic signal, while λ = 1 suggests trait evolution follows a Brownian motion model. Intermediate values reflect varying degrees of signal. We tested the significance of λ using a likelihood ratio test, comparing models with the estimated λ and λ = 0. A significant phylogenetic signal occurs if the model with the estimated λ fits better. Pagel's λ was calculated using the “phylosig” function from the “phytools” package (Revell 2012) in R. The results of Pagel's λ statistic indicated that non-native fish traits were generally not phylogenetically conserved, except for relative head depth and position in the water column (Appendix S2: Table S2).
2.2.2 Fish Multidimensional β-Diversity
To measure overall taxonomic β-diversity (β_OA_TD), we applied the Sorensen multisite dissimilarity index, calculated using the “vegdist” function from the “vegan” package in R (Oksanen et al. 2024). For functional and phylogenetic β-diversities (β_OA_FD and β_OA_PD), we calculated the mean pairwise functional or phylogenetic distance between communities using the “mean” and “sapply” functions from the “base” package in R (Crawley 2012). Temporal differences in the three β-diversity indices between the two periods were statistically compared using a pairwise t-test, performed with the “t.test” function from the “stats” package in R (Crawley 2012).
2.3 Determinants of Biodiversity Patterns of Lake Fish α-Diversity
2.3.1 Predictor Variables Data Set
To complement the quantification of multidimensional diversity of non-native fishes, we summarized multiyear averages for key predictor variables to characterize geographic factors, climate conditions, and physicochemical properties of each lake post-2000 (Appendix S3). We opted for multiyear averages instead of data from the specific year when fish sampling occurred because sampling frequency and timing varied across the region, and there were gaps in the availability of predictor data for certain years. While using averages may smooth over annual fluctuations, it effectively captures long-term environmental differences among lakes and provides meaningful correlations with biodiversity patterns over time. Geographic variables included longitude (°E), latitude (°N), and altitude (m) with the first two principal components (PC1 and PC2) accounting for 89.20% of the variance. Climate variables such as average annual temperature (°C) and precipitation (mm) were represented by PC1, which explained 92.41% of the variance. Lake morphological characteristics—lake area (km2), mean and maximum depth (m), and volume (108 m3)—were analyzed with PC1 and PC2 together explaining 95.77% of the variance. Water chemistry measures, including total nitrogen (mg/L), total phosphorus (mg/L), and chlorophyll a (μg/L), were summarized with PC1 and PC2 capturing 71.95% of the variance. Geographic data were obtained from the Geospatial Data Cloud (https://www.gscloud.cn), while climate data were sourced from China National Meteorological Administration (http://data.cma.cn). Other physical and nutrient properties were extracted from published information (Nanjing Institute of Geography and Limnology 2019). Principal component analysis (PCA) was conducted using a correlation matrix with the “rda” function from the “vegan” package in R (Oksanen et al. 2024), enabling us to summarize the gradient patterns of these variables across the lakes.
2.3.2 Identification of Determinants
To assess multicollinearity among the PCA axis scores of the predictor variables—geographic factors, climate conditions, physical and nutrient properties, and non-native fish multidimensional diversity—we calculated variance inflation factors (VIFs). Our results indicated that none of the predictor pairs had high multicollinearity, with all VIF values ranging from 1.13 to 2.12 being below the threshold of concern (VIFs < 2.50). This analysis was conducted using the “vif” function from the “car” package in R (Fox et al. 2012).
We then explored the relative contributions of these predictor variables on fish multidimensional diversity using gradient forest (GF) models. While GF models have been widely employed to study gene expression relationships (e.g., Fitzpatrick et al. 2021; Fitzpatrick and Keller 2015; Láruson et al. 2022), their potential in biodiversity research is only beginning to be tapped (Vanhove and Launey 2023). As machine learning algorithms, GF models excel at capturing complex interactions, making them particularly suited for analyzing how environmental gradients influence biodiversity (Ellis et al. 2012). They often outperform more traditional approaches like generalized linear models (GLMs) and generalized additive models (GAMs) (Bonsoms and Ninyerola 2024; Knudby et al. 2010). The GF models were built using the “gradientForest” function from the “gradientForest” package in R (Ellis et al. 2012), providing robust insights into the drivers of fish diversity across multiple dimensions. To assess the robustness of the GF models, we performed 5-fold cross-validation on 131 lakes. The results showed high consistency in environmental variable rankings, with the top four variables unchanged across folds and minimal variation in importance score (Appendix S2: Table S3). These outcomes suggest the GF models provided stable estimates of key environmental drivers of fish diversity, reinforcing the reliability of our findings.
3 Results
3.1 Determinants of Biodiversity Patterns of Lake Fish α-Diversity
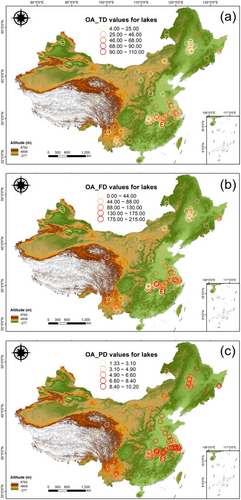
The biodiversity patterns of fishes across major Chinese lakes showed generally similar patterns in variation among the three dimensions of diversity—taxonomic, functional, and phylogenetic (Figure 2). Eastern China, particularly the lower Yangtze, Huaihe, and Haihe Basins, exhibited notably higher overall fish diversity compared to other regions.
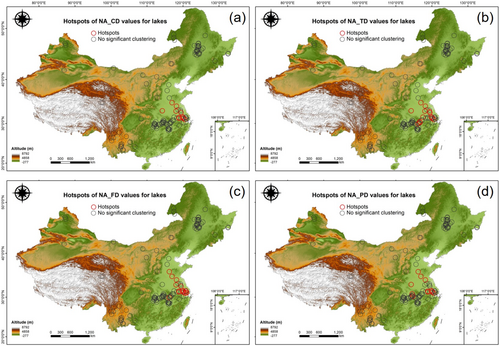
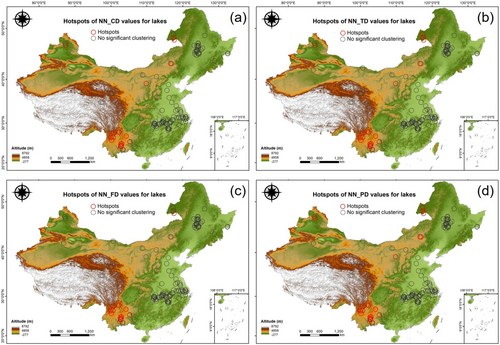
A comparison of biodiversity hotspots between native and non-native fishes revealed stark contrasts (Figures 3 and 4). Hotspots for native fish multidimensional diversity were primarily concentrated in the lower Yangtze and Huaihe Basins (Figure 3; Appendix S2: Table S4), while non-native fish diversity hotspots were clustered in the Yunnan-Guizhou-Chuan Plateau in southwestern China (Figure 4; Appendix S2: Table S5). The locations of these hotspots varied significantly across different dimensions of diversity (Appendix S2: Tables S4 and S5).
3.2 Impacts of Non-Native Species on Biodiversity Patterns
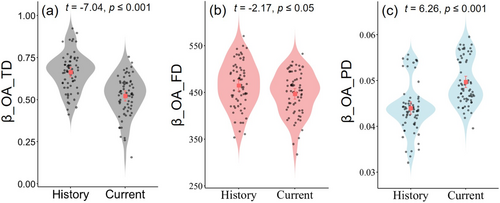
In the 12 non-native fish hotspots on the Yunnan–Guizhou–Chuan Plateau, taxonomic and functional β-diversities have significantly declined over time, indicating substantial homogenization of fish communities (Figure 5a,b). Interestingly, phylogenetic β-diversity has significantly increased, suggesting a rise in evolutionary diversity among species in these regions (Figure 5c).
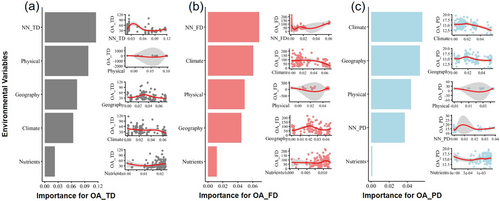
The analysis of the predictor variables for overall fish diversity highlighted different factors driving diversity across dimensions (Figure 6). Non-native fish diversity emerged as the most influential predictor of taxonomic and functional diversities (Figure 6a,b). However, for phylogenetic diversity, the climate variable was the dominant driver (Figure 6c). Partial dependence plots revealed a complex nonlinear relationship between non-native and overall fish diversity. Initially, as non-native fish invasions began, there was a positive correlation with overall fish diversity, followed by a negative correlation, and eventually a return to a positive correlation as invasions became more severe (Figure 6).
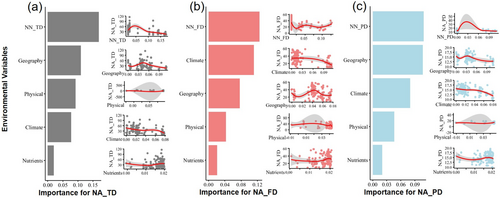
For native fish diversity, non-native fish diversity consistently ranked as the most important predictor in all dimensions (Figure 7). The relationship between non-native and native fish diversity was predominantly negative, with the exception of some fluctuations in the functional dimension (Figure 7b). Overall, the impact of non-native on native fish diversity was largely detrimental across taxonomic, functional, and phylogenetic dimensions (Figure 7).
4 Discussion
Integrating multiple dimensions of biodiversity into a composite diversity (CD) index provides a comprehensive, balanced view of biodiversity. This approach sharpens our ability to detect broad patterns, offering a more integrative measure of ecological dynamics and pinpointing areas with hotspots of fish diversity. While previous studies have developed indices to integrate taxonomic, functional, and phylogenetic dimensions, such as the Cumulative Change in Biodiversity Facets (CCBF) index by Su et al. (2021) and the multidimensional β-diversity framework by Nakamura et al. (2020), these methods were primarily designed to assess temporal dynamics or community assembly processes. In contrast, the CD index differs methodologically by applying z-score standardization and equal weighting to multiple diversity components, thereby ensuring comparability across dimensions and reducing biases introduced by scale differences. This unified integration provides a straightforward and interpretable metric that facilitates direct identification of multidimensional biodiversity hotspots. Compared with existing approaches, the CD index offers a simpler yet effective framework for spatial biodiversity assessment and prioritization, making it a valuable tool for guiding conservation planning and ecological research.
Our findings showed that hotpots of native fish diversity were mainly concentrated in eastern China, consistent with earlier studies (Abell et al. 2008; Zhao et al. 2006). The lakes in this region, particularly in the lower Yangtze River Basin, have benefited from long-standing hydrological connectivity with the river (Shi 1989), providing nutrient-rich inflows that have supported higher fish diversity (Tao et al. 2023). However, this area faces a conservation gap—despite its rich biodiversity, these regions remain largely unprotected and are increasingly threatened by human activity (Tao et al. 2023). In contrast, the hotspots of non-native fish diversity were concentrated in the Yunnan-Guizhou-Chuan Plateau. Notably, native and non-native hotspots did not overlap, a pattern consistent with the “diversity-invasibility hypothesis,” which suggests that species-rich systems with many native species tend to exhibit greater resistance to non-native species (Elton 2020; Enders et al. 2020; Henriksson et al. 2015; Levine and D'Antonio 1999). Regions with higher native biodiversity tend to have more-fully occupied ecological niches, limiting opportunities for non-native species. Conversely, regions with lower native diversity present more opportunities for invaders, emphasizing biodiversity's role in ecosystem resilience. These findings underscore the necessity of region-specific conservation strategies. In biodiversity-rich regions such as the lower Yangtze River Basin, conservation efforts should prioritize habitat protection and the prevention of further ecological degradation. In contrast, areas with high non-native species diversity, such as the Yunnan–Guizhou–Chuan Plateau, require proactive management strategies focused on early detection, minimizing dispersal, and effective control of non-native species to minimize their ecological impact. By incorporating spatial distribution patterns into conservation planning, our study offers a scientific foundation for adaptive management approaches tailored to the ecological characteristics of different regions.
To explore the impact of non-native fish introductions, we analyzed long-term shifts in taxonomic, functional, and phylogenetic β-diversity in 12 non-native fish hotspots. We found a clear trend of taxonomic and functional homogenization, alongside phylogenetic heterogenization. The loss of specialist species and the dominance of generalists, particularly non-native generalists, both indicators of taxonomic homogenization (Olden et al. 2006; Rahel 2002), were evident. Over recent decades, 33 fish species have vanished from the region, while 27 non-native species have been introduced. The observed functional homogenization is likely due to the region's high endemism where many native species were and are adapted to the unique, high-altitude tectonic lakes of the Plateau (Kang et al. 2014). In contrast, most non-native fishes are opportunists, characterized by rapid growth and early maturity (Lawson and Hill 2022; Su et al. 2023). These invaders have found exploitable niches in the region's relatively simple ecosystems, contributed to the loss of native species, and resulted in functional homogenization (Clavel et al. 2011; Kang et al. 2013; Vanessa et al. 2022).
Interestingly, the phylogenetic dimension followed a different pattern with newly introduced species coming from 24 genera, 15 of which were previously absent. This shift indicates that more closely related species with unique combinations of traits were replaced by more distantly related species with similar trait combinations. This reinforces the idea that phylogenetic diversity is not always a proxy for functional diversity, and phylogenetic conservatism does not hold (Mazel et al. 2018). Our findings from the analysis of Pagel's λ statistic suggest the traits of non-native fish species are generally not phylogenetically conserved. Although fish phylogenetic β-diversity has increased, the concurrent functional homogenization suggests that newly introduced species are not providing novel ecological functions but rather occupying similar functional niches as native species and/or redundancy among the non-native species that may lead to ecosystem instability (Aguilera et al. 2020; Fonseca and Ganade 2001). Given that traditional biodiversity assessments often emphasize taxonomic diversity while neglecting functional and phylogenetic aspects (Willig et al. 2023; Winter et al. 2013), our study highlights the need for a multidimensional approach to fully understand how fish communities respond to anthropogenic disturbances (Liang et al. 2024). With mounting threats from invasive species, habitat fragmentation, and water pollution (Kang et al. 2013; Xiang et al. 2023), urgent conservation measures are needed to protect the endemic, globally significant fish population of the Yunnan–Guizhou–Chuan Plateau. This strategy involves not only safeguarding native species and their habitats but also prioritizing the early detection and management of non-native species to mitigate their detrimental effects on local ecosystems.
Using the GF models, we analyzed how different factors drive overall fish diversity patterns. Non-native fish introductions not only caused taxonomic and functional homogenization but were the most significant drivers of diversity shifts. This underscores how globalization, while potentially addressing human needs, has facilitated the spread of non-native species and profoundly reshaped biodiversity within regions (Danet et al. 2024; Hulme 2021; Meyerson and Mooney 2007; Pyšek et al. 2020). In contrast, although climate factors are statistically associated with phylogenetic diversity, our findings indicate that the introduction of non-native species has driven phylogenetic heterogenization. While the observed increase in phylogenetic diversity coincides with climate shifts, it is not climate change per se that has directly altered phylogenetic patterns. Rather, climate change may act indirectly by facilitating the establishment, spread, and ecological impact of non-native species (Robinson et al. 2020), thereby amplifying their influence on community phylogenetic structure (Rodrigues et al. 2024). This highlights the potential synergistic effects of biological invasions and climate change on biodiversity.
Global studies have shown that while species composition changes locally due to invasions, α-diversity (species richness) may remain stable or even increase in some areas (e.g., Danet et al. 2024; Haubrock et al. 2021; Pilotto et al. 2020; Pyšek et al. 2020). In our study, as non-native fish diversity increased, overall multidimensional diversity stabilized and grew. This is due to non-native fish species compensating for the loss of native species, a pattern supported by metacommunity models observed in river basins of the Nearctic and Palearctic regions (Danet et al. 2024; Mouquet and Loreau 2003; Villéger et al. 2011). However, this increase in diversity should not be viewed positively for conservation, as it reflects a profound loss of native species, replaced by non-native species, leading to a shift in biodiversity dynamics (Danet et al. 2024; Haubrock et al. 2021; Xiang et al. 2023).
To refine conservation strategies, we further analyzed the predictors of native fish diversity. Non-native fishes emerged as the most important in reducing native fish diversity across all dimensions. As non-native fish diversity increases, native diversity declines. This explains why, during the initial stages of invasion, overall diversity may rise before declining as non-natives establish themselves and displace native species. The rapid decline in native fish populations as non-natives proliferate highlights the urgent need for focused conservation strategies. Unlike previous studies, which often focused on the broader impacts of invasive species, our research highlights the critical role of non-native species in disrupting native biodiversity, thereby informing more specific, proactive conservation strategies aimed at early detection and management of invasions, potentially requiring alternative approaches to maintaining species that may face extinction/extirpation (Haubrock et al. 2021; Jeschke et al. 2014).
In conclusion, our study utilized the most recent and comprehensive fish datasets available for Chinese lakes, revealing the profound impact of non-native fish introductions on both α- and β-diversity through the gradient forest models. Although these introductions may initially increase overall species richness, they simultaneously contribute to the decline and local extinction of native species, ultimately leading to biodiversity loss at the regional scale. As a result, this research provides important insights into how non-native species are driving biodiversity shifts in China. Building on these insights, we introduce a composite diversity framework that integrates multiple dimensions, offering a powerful tool for future biodiversity research, particularly in identifying and delineating biodiversity hotspots. Our findings underscore the urgent need to integrate invasive species management into biodiversity conservation by adopting proactive strategies that not only mitigate the ecological risks of species introductions but also maintain ecosystem integrity.
Author Contributions
Zhice Liang: conceptualization, data curation, formal analysis, methodology, software, validation, visualization, writing – original draft, writing – review and editing. Rodolphe Elie Gozlan: conceptualization, validation, writing – review and editing. Jiashou Liu: conceptualization, validation, writing – review and editing. Donald Jackson: conceptualization, validation, writing – review and editing. Chuanbo Guo: conceptualization, data curation, funding acquisition, project administration, validation, writing – review and editing.
Acknowledgements
This work was financially supported by the National Natural Science Foundation of China (No. 32172980), the National Key Research and Development Program of China (No. 2023YFD2400900), and the earmarked fund for China Agriculture Research System (CARS-45). Zhice Liang was funded by China Scholarship Council (No. 202304910486) to study abroad. We thank Yu Yang, Chengcheng Deng, Zihao Yuan, Jiangqianhui Qi, Jiaming Tu, Hanwen Zhang, and Senyang Wang for their help in our data collection.
Conflicts of Interest
The authors declare no conflicts of interest.
Open Research
Data Availability Statement
The data source from the National Center for Biotechnology Information (NCBI) can be accessed at https://www.ncbi.nlm.nih.gov/. The data supporting the findings of this study are openly available in Dryad at https://doi.org/10.5061/dryad.280gb5n1x.


