Plant Responses to Anomalous Heat and Drought Events in the Sonoran Desert
Funding: Funding was provided by Fundación innovaciones Alumbra.
ABSTRACT
A shift to greater aridification in dry regions of the world is ongoing and rapidly increasing in intensity, including in the biodiverse Sonoran Desert of the Southwest United States and northern Mexico. In addition to experiencing over two decades of drought, the Sonoran Desert is facing anomalous heat events that are increasing in frequency, evidenced in a record hot and dry period from 2020 to 2021. This article evaluates the impacts of the 2020–2021 region-wide heat and drought event at three scales: (1) a landscape level assessment of ecosystem stress across the entirety of the Sonoran Desert based on precipitation and temperature data from meteorological stations and a satellite-derived vegetation health index (VHI), (2) assessments of stress on iconic columnar cacti and succulent trees, and (3) mechanistic plant responses to extreme heat and drought, and secondary biotic stressors from insect attacks. 2020 was the hottest and driest year since 1980 across the Sonoran Desert region, and vegetation health, determined from VHI, was also near its lowest point. Field-based assessments of columnar cacti across the Sonoran Desert revealed high levels of acute plant stress, including cactus scorching, defined by rapid onset of discolored photosynthetic tissue that leads to permanent photosynthetic dysfunction and increased plant mortality. Tissue scorching corresponded with a three-fold increase in mortality of giant cactus species across the region relative to background levels following 2020–2021. Likewise, repeated plant health surveys show a persistent legacy of the 2020–2021 anomaly, resulting in a marked reduction in the current health and survival of the iconic giant saguaro (Carnegiea gigantea) in the northern Sonoran Desert. This multi-scale assessment of previously anomalous heat and drought events on succulent desert plants shows landscape-wide impacts that could fundamentally reshape populations of these keystone species and the communities that depend on them.
1 Introduction
Projected increases in mean annual, seasonal, and monthly temperatures in different regions across the globe due to climate change are well established with relatively strong agreement among global circulation models (Watanabe et al. 2010; Dufresne et al. 2013; Zhao et al. 2021). These projections are rapidly playing out across the globe as climate change triggers more frequent anomalous heat and drought events (Cook et al. 2022; IPCC 2023; Chen et al. 2025) with increased stress on vegetation (Zhou et al. 2024). Some of the most frequent and intense summer heat waves on the planet are occurring in the subtropical regions of North America, including the Sonoran Desert that spans large parts of the Southwestern U.S. and Northern Mexico, where temperatures are regularly exceeding 45°C (Tillman et al. 2020; Bennett et al. 2021; Cook et al. 2022; Williams et al. 2022).
Model simulations indicate that mean summer temperatures in the Sonoran Desert will increase from historic means by 1.9°C by 2050 to 5.0°C by the end of the century (Cayan et al. 2013). Although the return interval of episodic heat waves is difficult to predict, model outputs indicate that 100-year heat wave events in the Southwest U.S. and Northwest Mexico will occur about three-fold more frequently with a global temperature increase of 2.0°C in relation to historic conditions (Russo et al. 2019; Zhuang et al. 2024). The occurrence of extreme drought events that have already impacted the region for more than two decades since the beginning of the twenty-first century (Woodhouse et al. 2010; Williams et al. 2020) is also predicted to rapidly increase over the next century due to anthropogenic climate change (Seager et al. 2007). The high likelihood for increasing drought events (Overpeck and Udall 2020; Seager et al. 2023) is driven especially by decreases in cool-season precipitation and warming that enhances evaporative demand and dries soils (Gao et al. 2014; Seager et al. 2023), which in turn could alter vegetation cover and water cycling throughout the region.
The period from 2020 to 2021 was exceptionally hot and dry with a widespread lack of precipitation and extreme high temperatures recorded across the region (Seager et al. 2022). Specifically, in the greater Southwest United States, the precipitation totals over 20 months, between January 2020 and August 2021, were the lowest on record since at least 1895 when the instrumental climate record began (Mankin et al. 2021). Precipitation was also extremely low in northern Mexico, though this has not been published before this study. Extended periods of record-setting aridity have the potential to trigger widespread plant mortality surges that mirror drought-induced forest die-offs earlier this century in other regions of the globe (Allen et al. 2010). Shortly after the 2020–2021 heat and drought event, reports of abnormal coloration to columnar cacti from across the region, and especially the southern portion of the Baja California peninsula, surfaced. Visits to the region by the authors confirmed these reports and led to a broader effort to detect if community assemblages, ecosystem productivity, and biodiversity may be altered across the region in ways that have yet to be documented. Here, we take a closer look at vegetation responses across the Sonoran Desert of the U.S. and Mexico to better understand this extreme event.
As climate warms, precipitation decreases and potential evapotranspiration increases, which could result in many plant populations crossing physiological thresholds leading to their abrupt decline (Bradford et al. 2020; Munson et al. 2021). Plant life forms and functional types that are potentially most at risk are species of cacti and other succulents; critical ecosystem engineers that support numerous and highly specific pollinators, seed dispersers, and frugivores (Alcorn et al. 1961; Fleming et al. 1996; Mellink and Riojas-López 2002; Wolf and del Martínez Rio 2003). Despite having the capacity to thrive in desert regions, many succulent plants, including the iconic giant saguaro (Carnegiea gigantea) can be highly susceptible to novel heat waves and droughts (Hultine et al. 2023). Virtually all stem-succulent plant taxa have relatively shallow root systems that limit access to deep water storage during intensive droughts and have limited capacity to regulate surface temperatures during episodic heat waves (Hultine et al. 2023). Likewise, mature giant cacti can lose structural integrity during drought as tissues used for mechanical support lose turgidity as cell water decreases (Yetman et al. 2020). As a consequence, many large saguaros are known to collapse following exposure to extended drought stress (Hultine et al. 2023). There is also the previously described response of cactus epidermal browning (e.g., Evans et al. 1994), that seems to be exacerbated by extreme heat events as reported across the region, which we further explore and define in this study. Thus, giant saguaro and other succulent plant taxa may be key indicator species of ecosystem stress across the Sonoran Desert region.
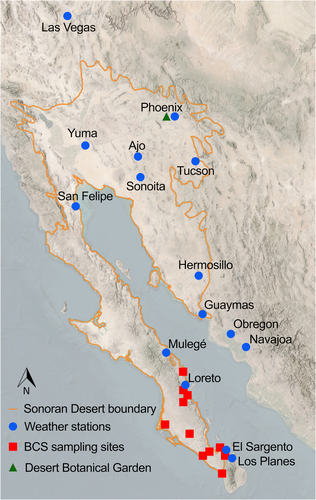
There is an urgency to better understand the severity of heat and drought events in space and time at the regional landscape level and within the context of species-specific responses. Widespread observations of severe plant stress and mortality observed across an array of species throughout the Sonoran Desert (Figure 1) indicate acute physiological stress responses. This paper looks in detail at the 2020–2021 region-wide heat and drought event at three scales to determine if coupled extreme heat and low precipitation drive mass mortality events across the Sonoran Desert: (1) a landscape level assessment across the Sonoran Desert based on precipitation and temperature data from meteorological stations and a satellite-derived vegetation health index (VHI), (2) assessments of columnar cactus and sarcocaulescent tree health to ground truth the meteorological and VHI data, and (3) evaluation of plant physiological responses including the anatomy of cactus epidermal browning and secondary impacts such as biotic stressors from insect attacks. Results from this overview of the greatest recorded heat and drought event in the region make significant headway in understanding how the Sonoran Desert may be impacted by climate change and future expected heat and drought events.
2 Methods
2.1 Precipitation and Temperature Data
Meteorological records from Mexico were obtained from 10 stations ranging from latitude 24° to the U.S. border and for five specific Sonoran Desert locations in the U.S., ranging from the Mexican border to latitude 36.1° (Figure 1). We only used data from 1980 onwards, before that date significant gaps were found in some of the stations in Mexico. A small number of missing data points in some stations were gap-filled with the data from the nearest station within the same ecological region (missing data points were < 1% of the monthly series in all stations). Between 2016 and 2018, the Mexican weather stations transitioned from manual to automated operation. Data from before the transition (i.e., from manual readings) were downloaded from CONAGUA's “Información Estadística Climatológica” (CONAGUA 2024a). Data from the transition onwards (i.e., from the automated weather stations database) were downloaded from CONAGUA's “Resúmenes Mensuales de Temperatura y Lluvias” (CONAGUA 2024b). Meteorological records from the US were obtained using the PRISM online database, using the Time Series Values for Individual Locations (PRISM Climate Group 2024).
Taking into account the predictable arid fore-summer throughout the Sonoran Desert (April–May, Shreve 1951), we calculated the yearly cumulative precipitation for each of the 15 locations between May and April in the following year, summarizing the precipitation data into “ecological years.” Thus, the cumulative precipitation data for each location was reduced to a series of 44 ecological years. To make the different locations comparable, we centered and standardized each of these vectors, first calculating the precipitation anomalies for each year (i.e., the difference between the value for each year and the overall 44-year mean for that location), and then dividing the anomalies by the standard deviation of the location. The anomaly dataset was then subjected to an analysis of variance (ANOVA) to test for consistent occurrence of negative anomalies across the 15 locations, and a Bartlett test of homogeneity of variances, to test whether certain anomalously dry years were consistently dry throughout the whole Sonoran Desert region.
Similarly, we downloaded the information on mean monthly temperatures for all 15 stations and extracted the mean temperature of the hottest month of the ecological year (which invariably fell in July or August in all stations) as a proxy indicator of heat waves. The temperature anomaly for the graphical display was calculated by taking as baseline the mean summer temperature between 1980 and 1989 (i.e., plots reflect temperature changes from the 1980s). The datasets were then subjected to an analysis of variance (ANOVA) to test for consistent occurrence of negative anomalies for rainfall or extreme heat across the 15 locations, and a Bartlett test of homogeneity of variances to test whether certain anomalously dry years were consistently dry throughout the whole Sonoran Desert region.
2.2 Vegetation Health Indices
2.2.1 Data Source
Similarly, TCI, the temperature condition index, is a proxy for thermal conditions. It is based on and calculated from the longest wavelength (Band 4, 10.3–11.3 μm) of AVHRR's radiance measurements, a measure of infrared brightness used to estimate land surface temperatures (Zeng et al. 2023). The wavelength of 10–11 μm falls within the mid-infrared region of the electromagnetic spectrum, considered part of the “thermal infrared” range, where heat radiation is most prominent (NOAA 2023b). Thus, VHI is the sum of two indices, each based on specific ranges of the electromagnetic spectrum: VCI, sensible to moisture conditions, and TCI, sensible to thermal conditions. The coefficient α determines the contribution of the two indices, and is set at 0.5 for the non-modified VHI calculations (NOAA 2023b). VHI has a range of values from 0 (extreme drought) to 100 (excellent conditions). Values below 40 indicate vegetation stress (NOAA 2023a).
A drought-modified VHI (D-VHI), developed by Zeng et al. (2023) was also used to evaluate vegetation responses to annual climate anomalies. This version of VHI varies the value of the α coefficient from a default of 0.5 to reflect local soil moisture conditions, which are well known to be key drivers of vegetation structure and health in deserts (Shreve 1951; Bento et al. 2020). The D-VHI model alters the α value for each 4 km pixel based on the local soil moisture conditions determined from a self-calibrating Palmer drought severity index (sc-PDSI) combined with a Pearson correlation analysis method as implemented by Zeng et al. (2023). The D-VHI dataset covers the time period between 1981 and 2021.
As mentioned earlier, VHI is detected by the AVHRR system through the reflectance properties of the vegetation as a whole, which in most of the Sonoran Desert is dominated by deep-rooted leguminous trees or creosote scrub in the more arid regions. Furthermore, because of their erect growth form, the vertical canopy projection of the shallow-rooted columnar cacti is very low when viewed from above (Zavala-Hurtado et al. 1998), so the satellite sensor will not detect much of the cactus' condition compared to other species with wider canopies.
2.2.2 Data Processing
A map with boundaries of the larger Sonoran Desert region was assembled in the Geographic Information System. The boundaries include Shreve's Sonoran Desert subdivisions (Shreve 1951), plus the Cape Region and the Sierra de la Giganta in the Baja California peninsula to incorporate the whole peninsula in the analysis (González-Abraham et al. 2010). We masked off all the large irrigation districts of the Sonoran Desert such as the Imperial Valley in the United States, the Mexicali Valley in the State of Baja California, Mexico, and the large plains of southern Sonora, Mexico; namely, the Yaqui and the Mayo irrigation districts. Because all these regions are artificially irrigated, the surface reflectance properties of the vegetation do not reflect climate-driven drought cycles but rather water availability in deep wells and river dams, largely uncoupled from seasonal variations in precipitation.
The resulting map frame contained 87,780 pixels covering an area of ca. 85,640 km2. Within this map frame, we downloaded the weekly VHI and D-VHI values for each pixel from 1981 through 2022 (through 2021 for D-VHI). Certain weeks were missing from the NOAA source data in the years 1981 (weeks 1–34), 1984 (50–52), 1985 (1–8), 1988 (46–52), 1994 (37–52), 1995 (1–3), and 2004 (4, 11–24, 29). In each weekly file, we calculated the mean VHI and D-VHI values for the whole Sonoran Desert, as well as its standard deviation and the monthly coefficient of variation (mean/SD).
The whole dataset was composed of 485 files with weekly data × 87,780 pixels in each weekly file × 6 data items per pixel (pixel ID, latitude, longitude, VHI value, source metadata, and O-ID). That is, the analysis dealt with 255,439,800 data records distributed in 485 different files. Because of its large size, we programmed a data-handling code in R (R Core Team 2020) to read each file one at a time and process their pooled contents as big data.
2.3 Field-Based Data
2.3.1 Baja California Sur
Population level data were collected in the spring of 2024 for four dominant columnar cacti species (Lophocereus schottii, senita; Pachycereus pringlei, cardón; Stenocereus gummosus, pitaya agria; Stenocereus thurberi, pitaya dulce, organ pipe) and one sarcocaulescent tree (Bursera microphylla, torote, elephant tree) across 18 locations in Baja California Sur divided into three regions (Loreto, Magdalena, Cape) (Figure 1). At each site, an area of ca. 0.1 ha was surveyed in which the species of focus were classified into five categories: healthy (H) and one of four levels of drought stress. Drought stress categories were: I (little impact), II (clear impact, with some new growth), III (severe impact, no new growth, unlikely to survive), and D (dead). In the case of B. microphylla, impact was evaluated by the amount of green foliage, the proportion of dead branches, and the presence of entrance holes to tunnels from wood borers, often exuding a mixture of resin and frass. In the case of cacti, damage was assessed by the amount of epidermal browning in the stem, the presence of stem constrictions close to the apex, and signs of damage by cactus borers (Moneilema spp., Cerambicidae). Using a Generalized Linear Model for frequency data (i.e., a Poisson model) we analyzed differences between species and between regions in the frequency of plants within the different damage categories.
2.3.2 Carnegiea gigantea Surveys From Central Arizona
The Desert Botanical Garden (DBG), located in Phoenix, AZ, hosts ~1000 individually accessioned saguaro cacti (C. gigantea) on its ~57 ha property in central Arizona. Although the occurrence of some plants at the DBG was from natural recruitment, the majority of plants were transplanted from nearby locations in the northern Sonoran Desert beginning in the 1950s. Plant size among the DBG's saguaro inventory ranges from a few cm to over 8 m in height, with ages ranging from < 3 years to over 100 years. Annual surveys have been conducted between 2015 and 2024—between February and March—to evaluate survivorship and condition of each saguaro plant in the inventory. During each census, all plants are assigned a code that corresponds with its assessed condition, whereby, 4 = excellent, 3 = good, 2 = fair, and 1 = poor, depending on a series of criteria, including level of herbivory, frost damage, epidermal browning, dehydration, conditions of arms (if present), stem leaning, stem rot, or other forms of wounding (see Table S1 for in-depth details of plant condition scoring). If a plant was missing or found deceased, the expected cause of death was noted. Annual mortality rates were determined as the percentage of deceased plants in relation to all plants evaluated in the inventory [i.e., deceased/(living + deceased)]. However, all plants that were noted as missing, removed for construction, or deceased due to faulty transplanting were excluded from the analysis. Plant height was also measured during the 2017, 2020, and 2023 inventories using a combination of measuring tapes, telescoping poles, and clinometers.
2.4 Anatomy of Cactus Epidermal Browning
One-inch-deep cores were extracted from the main species of columnar cacti both from green stems with healthy epidermis and from damaged stems with epidermal browning. Thin radial slices were cut from the cores. The slices were studied under the dissection microscope or stained with Toluidine Blue and observed fresh under a compound microscope.
3 Results
3.1 Precipitation and Temperature Data
The standardized precipitation anomalies differed significantly among years (F(43,616) = 6.8; p < 0.0001; Table S2). The largest negative anomaly was observed in 2020, followed by the drought of 2010 (Figure 2). The 2020 anomaly, however, was significantly drier than that of 2010 (paired sample t-value = 3.29, p = 0.003). Additionally, 2020 had a significantly lower variance than the rest of the dataset, according to Bartlett's test of homogeneity of variances (K2 = 114.19, df = 43, p < 0.0001). Jointly, these data indicate that 2020 had the strongest negative anomaly of the time series and that the drought was observed uniformly throughout the larger Sonoran Desert, as suggested by the low between-sites variance in 2020.
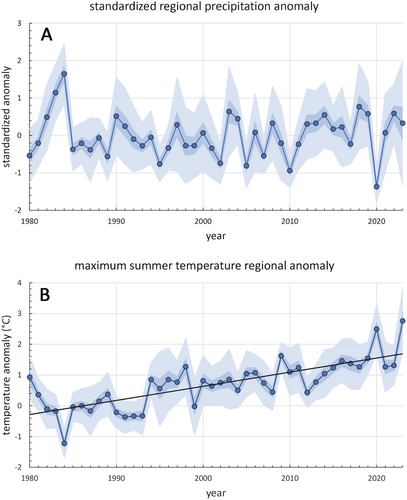
In contrast with precipitation data, which did not show a long-term trend, summer temperatures in almost all stations showed a significant and positive trend (i.e., the temperature of the hottest month of the year increased throughout the Sonoran Desert during the study period [Figure S2]). The linear model showed that maximum summer temperatures were predicted by a time trend (i.e., the year taken as a quantitative linear predictor, r2 = 0.29), followed by the fixed effect of each year (i.e., the year taken as a statistical factor, r2 = 0.20), and by the interaction effect of stations along the time series (i.e., the different rates of increase in summer temperatures among stations, r2 = 0.05; Table S2). The only exception to the overall increase in summer temperatures was San Felipe, a station located on the coast of the Gulf of California where strong tidal mixing takes place. Removing this outlier, summer temperatures between 1980 and 2020 showed a significant rate of increase (rate = 0.46°C/decade, SE = ±0.06°C, p < 0.0001; Figure 2B, Table S3), with maximum values in Los Planes, Baja California Sur (0.70°C/decade), Las Vegas, Nevada (0.70°C/decade), and Phoenix, Arizona (0.66°C/decade). Two coastal stations, Guaymas in Sonora and El Sargento in Baja California Sur, showed lower rates of thermal increase (0.24°C ± 0.11°C/decade and 0.20°C ± 0.08°C/decade, respectively; p = 0.02 in both cases), possibly because of the buffering effect of the Gulf of California waters.
As with precipitation, the year 2020 showed the maximum mean value of the temperature anomaly for the preceding four decades (Figure 2). Using the mean summer temperatures of the 1980s as a baseline, the summer of year 2020 was, on average, 2.5°C warmer. Extreme heat waves were common that year throughout the Sonoran Desert, especially on the mainland. In the summer of 2020, Mexican climatological stations recorded 48°C in Sonoyta (Sonoita per the CONAGUA station name), 46.5°C in Hermosillo and Ciudad Obregón, and 45°C in Navojoa. Similarly, extremely high temperatures were also recorded in the U.S. throughout that summer, with a maximum of 47.4°C in Phoenix, 47.3°C in Yuma, 45.9°C in Ajo, and 45.7°C in Las Vegas (Table S4).
3.2 Vegetation Health Indices
The VHI and D-VHI yielded similar results and clearly identified multiple wet and dry periods throughout the 40-year time series (Figure 3). The 2020 drought was identified as one of six of the driest years (1989, 1996, 2022, 2011, 2017, and 2020) in the region. Notably, 2020 was not identified as the driest of these drought years in either VHI or D-VHI analyses. However, when the VHI and D-VHI values were regressed against annual precipitation and maximum summer temperature, the model provided a significant fit to the data (r2 = 0.67 for VHI and r2 = 0.84 for D-VHI; p < 0.0001 in both cases; see Table S5). The most important driver of this relationship was the effect of precipitation (r2 = 0.56 for VHI and r2 = 0.70 for D-VHI; p < 0.0001 for both). However, the fitted values with precipitation only did not show the downward trend that is noticeable in the VHI and D-VHI data. Adding the effect of summer temperatures to the model (r2 = 0.11, p = 0.045 for VHI and r2 = 0.14, p = 0.029 for D-VHI; Table S5) gave the fitted values of the decreasing long-term trend that is visible in the vegetation health data.
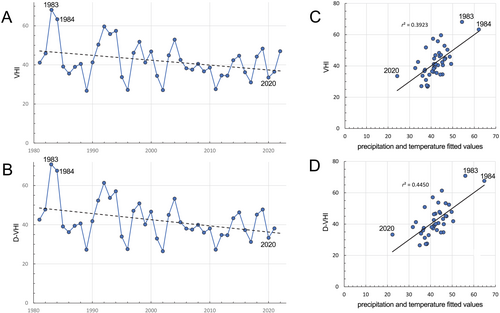
This 40-year time series provides a context for the two-decade drought event that has been in place over the Southwest U.S. and Northwest Mexico since the year 2000 (Video S1, 1981–2022 animation of weekly VHI values), and visualizes the marked contrast between wet years (such as 1983) and dry years (Figure 4). A general negative trend in average VHI values is detectable in both VHI and D-VHI (Figure 3). The mean VHI decreased from 48 to 37 VHI units, at an average rate of −2.5 VHI units per decade (similar values for D-VHI). The trend was significant (t-test for slope = 2.11, df 40, p = 0.04), indicating a tendency towards decreasing vegetation health throughout the Sonoran Desert during the last four decades. As shown in the preceding paragraph, this downward trend is statistically associated with increasing extreme summer temperatures.

Within the 2020–2021 drought and heat event, the majority of the Sonoran Desert suffered dry (VHI < 40) to severely and extremely dry (VHI < 20) vegetation response, especially following summer 2020 (Figure S3). In the summer of 2020, there was a much lower VHI increase relative to other years due to a historically weak monsoon (Mankin et al. 2021). Other summers in this time period did have a VHI increase in both value and mean variation (Figures S3 and S4), indicating a scattered and localized geographic distribution of summer rain events.
3.3 Field-Based Data
3.3.1 Baja California Sur
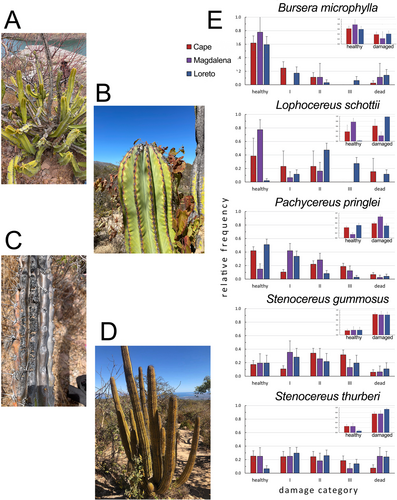
The field-based assessment of plant stress of four dominant columnar cacti and B. microphylla across three regions in Baja California Sur showed significant differences in the levels of damage across species and across regions (Figure 5). The GLM model showed that the most important effect of the drought-induced damage was observed among species (partial r2 = 0.32, X2 deviance 281.9, df = 20, p < 0.00001), with a lower but significant variation in damage across regions (partial r2 = 0.08, X2 deviance 71.7, df = 10, p < 0.00001), and an important interaction term for the interaction between species and regions (partial r2 = 0.31, X2 deviance 269.4, df = 40, p < 0.00001). Stress damage was most marked in the two Stenocereus species across BCS. Lophocereus schottii and P. pringlei showed some variation across regions. Lophocereus schottii had less stress in the Pacific coast Magdalena region, but high stress in Gulf of California Loreto and Cape regions. Pachycereus pringlei showed slightly less stress in Loreto and the Cape region, though high stress in Magdalena. Bursera microphylla showed low levels of drought stress across the region, though secondary insect infestations may have been difficult to detect and may have been missed at the time of sampling.
Mortality rates were calculated for each population of these five species (Table 1). Mean mortality was 9.9% for all species in all regions. We performed a simple life-table analysis, based on the height structure of P. pringlei populations adjacent to La Paz and Loreto BCS described in Medel-Narvaez et al. (2006), and using the mean height-to-age relationship for P. pringlei described in Delgado-Fernández et al. (2016), which showed that on average plants of 5 m in height are ca. 60 years old and that ca. 2% of the older adult plants reach ages of 100 years. With these data, and assuming that age-specific mortality in adult plants is constant, we numerically tried different values of mortality to test what mortality rate would yield a survivorship curve with ca. 1%–2% of any given cohort reaching 100 years, and a much lower probability (ca. 0.1%) of plants in any cohort reaching 150 years or more. This result demonstrated that in long-lived plants, with a lifespan of over a century, maximum sustainable mortality should be lower than 2% and that mortalities above the 2% threshold would dramatically change the population structure from that observed in the wild.
| Species | Region | Healthy | Damaged_I | Damaged_II | Damaged_III | Dead | Total | % Mortality (D) |
|---|---|---|---|---|---|---|---|---|
| Bursera microphylla | Cape | 50 | 20 | 9 | 0 | 2 | 81 | 2.47 |
| Bursera microphylla | Loreto | 38 | 11 | 2 | 4 | 9 | 64 | 14.06 |
| Bursera microphylla | Magdalena | 7 | 0 | 1 | 0 | 1 | 9 | 11.11 |
| Lophocereus schottii | Cape | 5 | 3 | 3 | 0 | 2 | 13 | 15.38 |
| Lophocereus schottii | Loreto | 2 | 11 | 45 | 26 | 11 | 95 | 11.58 |
| Lophocereus schottii | Magdalena | 24 | 2 | 5 | 0 | 0 | 31 | 0.00 |
| Pachycereus pringlei | Cape | 112 | 28 | 59 | 50 | 18 | 267 | 6.74 |
| Pachycereus pringlei | Loreto | 74 | 49 | 12 | 4 | 6 | 145 | 4.14 |
| Pachycereus pringlei | Magdalena | 12 | 34 | 23 | 10 | 2 | 81 | 2.47 |
| Stenocereus gummosus | Cape | 29 | 18 | 57 | 53 | 10 | 167 | 5.99 |
| Stenocereus gummosus | Loreto | 9 | 13 | 10 | 9 | 5 | 46 | 10.87 |
| Stenocereus gummosus | Magdalena | 6 | 11 | 8 | 4 | 2 | 31 | 6.45 |
| Stenocereus thurberi | Cape | 30 | 29 | 29 | 22 | 9 | 119 | 7.56 |
| Stenocereus thurberi | Loreto | 7 | 32 | 28 | 15 | 26 | 108 | 24.07 |
| Stenocereus thurberi | Magdalena | 11 | 11 | 8 | 3 | 11 | 44 | 25.00 |
3.3.2 Carnegiea gigantea Surveys From Central Arizona
After the onset of the 2020 heat and drought event, the condition of C. gigantea at the DBG declined significantly. A log-linear model showed a highly significant interaction between the year and the plants' condition (X2 = 2637.5, df = 27, p < 0.0001). The proportion of plants in the “poor” condition category increased from 4% in the years preceding the 2020 drought to 38% at the end of the event in 2021, at the expense of plants in the “good” condition, which moved from 34% to 50% in the years before the drought to 11% of the population in 2021 (Figure 6A, Table S6). In addition, we were able to separate out the change in condition of irrigated and non-irrigated saguaros in the data set. This analysis showed a stability in the condition of irrigated saguaros and a steep decline in non-irrigated plants (Figure S5, Table S6). Specifically, the condition rating of non-irrigated C. gigantea plants declined 45% between 2015 and 2021 (t-value = 25.94, p < 0.0001, Figure S5), while in irrigated plants the condition rating only fell 7% between 2015 and 2021 (t-value = 3.75, p = 0.0002, Figure S5). These stark contrasts between irrigated and non-irrigated plants indicate that the effect of the 2020 drought, although amplified by heat, was especially driven by limited water resources.
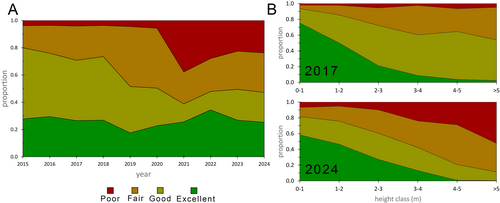
The proportion of the tallest plants, above 5 m in height, also showed a marked decrease in condition post-2020. A log-linear model showed a highly significant interaction term between the year and plant condition (X2 = 279.7, df = 6, p < 0.0001) and between plant height and condition (X2 = 2242.9, df = 15, p < 0.0001), plus a significant three-way interaction between year, plant height, and condition (X2 = 52.5, df = 30, p = 0.0067), indicating that the drought affected the larger plants much more than juveniles. In 2017, only 5% of large, branched adults taller than 5 m were observed in the “poor” condition category, and by 2024, the proportion had risen tenfold to 52% (Figure 6B). In contrast, in 2017 only 2% of plants lower than 1 m were observed in poor conditions, and by 2024 the proportion was 7%.
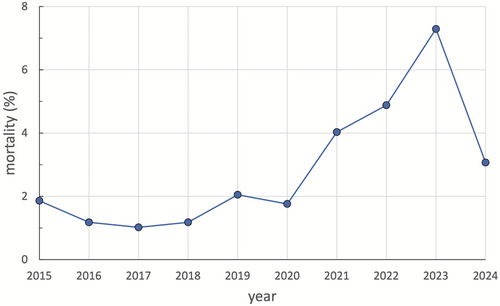
Between 2015 and 2020, the mean annual rate of mortality ranged between 1% and 2% (Figure 7, Table S7). However, beginning in 2021, the number of deceased plants increased significantly from 4% in 2021 to a high of 7% in 2023 before falling to just over 3% in 2024. Growth rates also declined after the 2020 regional drought. Between 2017 and 2020, the mean rate in height increase was 10.07 cm/year. (SE 0.55, n = 1007 plants; Table S8), while in the 2020–2024 period, mean height increase was 4.33 cm/year. (SE 0.57, n = 885 plants; Table S8), a highly significant decrease in the plants' ability to grow (t-value = 7.22, p < 0.0001).
3.4 Anatomy of Cactus Epidermal Browning
The cortex of columnar cacti is formed by a succession of well-defined layers (Figure 8). The exterior cover, the epidermis, is formed by a layer of cells with stomata that are protected externally by a thick, waxy cuticle. Below, a multiple-layered series of translucent cells, the hypodermis, is found, followed by the chlorenchyma (photosynthetic tissue), which is formed by a series of radially elongated cells rich in chlorophyll. Below the chlorenchyma, the cactus stem is occupied by a matrix of undifferentiated tissue, the stem's parenchyma, that plays an important role in the storage of photosynthates and water for the cactus's CAM metabolism.
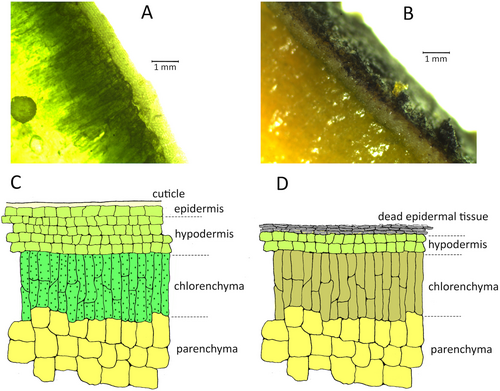
After the 2020 drought, we observed dead sectors of the epidermis in all the studied cacti species, forming dark patches in the stem composed of dead epidermal and upper hypodermal cells, ranging in color between metallic gray and dark brown. In damaged patches, the chlorenchyma below had lost its green color and looked etiolated, indicating the loss of photosynthetic capacity.
4 Discussion
To better understand the impact of increasingly common, anomalous heat and drought events on arid land vegetation, we assessed the extreme 2020–2021 event at three scales across the Sonoran Desert: (1) landscape level, (2) population level, (3) plant level. Each scale of analysis confirmed the severity and region-wide extent of the 2020–2021 heat and drought event. These results indicate long-lived succulent plant species are suffering extreme stress that is causing increased mortality that has the potential to restructure communities throughout the Sonoran Desert.
The meteorological analysis of precipitation data from weather stations across the Sonoran Desert confirms the previously reported severity of the 2020–2021 drought event in the greater Southwest (Mankin et al. 2021) and extends those impacts into Mexico (Figure 2). Our 44-year data set shows both the extreme lack of precipitation and extreme heat in 2020 compared to other years, as well as the uniformity of the drought and heat event across all weather stations that span the entire Sonoran Desert region. In three stations, 2020 showed the highest summer temperatures of the recorded series, and in six more, the second highest. Averaging for the whole Sonoran Desert, the summer temperatures of year 2020 were significantly higher than any preceding year (p < 0.005 in all cases, according to paired t-tests). After 2020, extreme summer temperatures have continued: Summer 2023 was 2.8°C higher than the 1980s baseline and higher than, but not significantly different from, the 2020 event (paired-sample t-value = 0.77, df = 26, p = 0.23). In summary, year 2020 was the driest on record and, with the summer of 2023, it harbored the hottest summer yet recorded for all the studied stations in the Sonoran Desert.
Published analyses suggest that random variations in the atmosphere account for the lack of summer 2020 monsoon rain (Mankin et al. 2021; Seager et al. 2022), which is consistent with results that indicate complex and still unidentified factors that have modulated the North American Monsoon over the last millennia (Harris et al. 2025). This period was followed by a strong La Niña in the winter of 2021, an oceanographic anomaly known to cause low precipitation in the greater Southwest (Caso et al. 2007). The extreme high temperatures over this period seem to have been magnified by human-caused warming through an amplification of vapor pressure deficit and potential evapotranspiration, which deepened and spread the drought across the region (Mankin et al. 2021; Hoell et al. 2022; Osman et al. 2022; Zhuang et al. 2024).
While the precipitation-station data does not clearly reflect a drying trend in the last two decades (Figure S1), the summer temperature data shows a clear increasing trend in all stations with the exception of coastal San Felipe in the Upper Gulf of California (Figure S2). Notably, the VHI and D-VHI analyses also capture a significant but negative trend in the time series (Figure 3). The multiple regression model showed that this trend corresponds with increasing summer extreme temperatures, a critical component of the well-documented severe drought across the greater Southwest (Woodhouse et al. 2010; Williams et al. 2020), in a series of multiple heat and drought events on the vegetation in recent decades. Interestingly, the VHI analysis seems to hit a lower threshold around 20 VHI units and does not distinguish between severe drought years (Figure 3); that is, below a certain level of water stress, the satellite images cannot detect differences in the drought-stricken desert vegetation. This may limit the ability of satellite-derived vegetation indices in identifying extreme droughts in arid regions.
The legacy effect of episodic climatic events is a hallmark of desert ecology. This is seen, for example, in freeze events that impact C. gigantea in the northern portion of its range (Pierson and Turner 1998), hurricane events that topple mature columnar cacti and boojum trees (Fouquieria columnaris) in Baja California (Bullock et al. 2005), and the establishment of cohorts of diverse plant species after extraordinary precipitation pulses (Brown et al. 2024). One of these regional precipitation pulses occurred in the wet El Niño year of 1983, followed by the exceptionally wet summer of 1984, clearly seen in the precipitation and VHI data (Figures 2-4). The botanical response to this period is known to be one of the most profound of any El Niño period over the last century (Dillon and Rundel 1990). The likely legacy of this El Niño event appears to have spurred the establishment of large cohorts of C. gigantea in western Arizona, where saguaro recruitment is rare and episodic, the establishment of riparian gallery forests, and other plant communities throughout the region.
Increasingly frequent heat and drought events will likely have legacy impacts that erode previous population gains and structure communities through the loss of individuals and likely species across the landscape (Müller and Bahn 2022). The stress response of plants to these drought events marked by extreme temperatures can also have a time lag (Felton et al. 2021), especially for long-lived species such as columnar cacti, in which the impact of an extreme drought may not be noticeable until several years after the triggering event, similar to lagged forest mortality surges following episodic drought (Peltier et al. 2016; Kannenberg et al. 2019, 2020). In addition, the layering of impacts from subsequent drought events may compound stress responses. For example, single-trunked columnar cacti like C. gigantea may be at risk once they reach tipping points (Hultine et al. 2023).
It is also possible that desert plants, while impacted by these drought events, have the capacity for re-growth and to rebound with the return of favorable conditions (Reynolds et al. 2004). Many shrub species with deep roots, annuals, and forbs with robust seed banks, or even multi-stemmed cacti might be able to weather these heat and drought events better than single-stemmed giant columnar cacti that do not have the capacity to resprout following disturbance.
In response to the 2020–2021 heat and drought event, widespread observations of epidermal decay (yellowing in S. thurberi, greying in S. gummosus, and browning in C. gigantea and P. pringlei) were observed across the Sonoran Desert. This was especially true in the southern extent of the Baja California peninsula (Figure 5). Unlike leaf-bearing plants, which periodically replace their photosynthetic tissue by shedding leaves and producing new ones, cacti maintain the same epidermal tissue in their stems throughout their entire life cycle. Despite the fact that the erect columnar growth form is well adapted to avoid extreme thermal loadings when the sun is overhead around midday (Zavala-Hurtado et al. 1998) it has been well documented that columnar cacti under radiation stress often develop a discoloration of the photosynthetic chlorenchyma, which has been termed epidermal browning (Evans et al. 1994; Evans and Fehling 1994).
In C. gigantea, epidermal browning is thought to be caused by high surface temperatures, occurring more commonly on the south sides of saguaros and positively correlated with the height and age of an individual (DeBonis 2017; Turner and Funicelli 2004). It begins with discoloration around the areoles, especially at the base of the plant, then spreads to the spaces between the cactus' ribs, and then continuously over parts of the plant surface, eventually becoming dark, rough, and with a bark of scar tissue (Turner and Funicelli 2004). Mortality has been shown to be higher among individual saguaros with greater degrees of epidermal browning, though it is not clear if there is a causal relationship (Evans et al. 2013).
We introduce the term “cactus scorching,” a form of epidermal browning distinguished as the rapid onset of discolored photosynthetic cactus tissue during periods of extreme heat and drought that leads to permanent photosynthetic dysfunction. Epidermal decay in cacti leads to the loss of photosynthetic capacity, reducing carbohydrate storage and metabolic function (Figure 8; Hüve et al. 2011). CAM plants, such as stem succulents, do not transpire during the day and thus have limited ability to cool themselves in extreme temperatures (Nobel 2003). Air temperatures of 45°C to 50°C can correspond to surface temperatures of 55°C to 60°C, which is the upper thermal limit for a functional photosynthetic metabolism (Smith et al. 1984; Nobel et al. 1986). It is known that at these high temperatures, UV protection is degraded and the photosynthetic system decouples through the melting of the lipids in chloroplasts when high temperatures exceed thermal protection provided by the upregulation of the xanthophyll cycle, heat shock proteins, or sugar solute synthesis, causing permanent tissue scorching (Havauex and Tardy 1996; Andersen et al. 2011; Coast et al. 2024; Zhu et al. 2024).
The observed levels of columnar cactus mortality following the 2020–2021 event in C. gigantea at the Desert Botanical Garden (ca. 7%) and in columnar cacti in Baja California Sur (Table 1) far exceed the background mortality rate reported for columnar cacti. Long-term studies on C. gigantea at Tumamoc Hill in Tucson, Arizona have shown mortality rates of < 1% to 2% (Pierson and Turner 1998). Likewise, C. gigantea mortality data of the Desert Botanical Garden presented here and our calculations of the needed mortality rate to support the demographic structure of P. pringlei reported in Medel-Narvaez et al. (2006) both support a background annual columnar cacti mortality rate of ca. 2%. Also of note, despite the high daily temperatures in 2020, well-watered plants at the Desert Botanical Garden performed relatively well, indicating that the effects of high temperatures across the region were likely greatly amplified by the effects of drought.
Increased mortality of columnar cacti due to drought events, especially of older individuals, compounds additional population pressures these iconic desert species are facing (Pillet et al. 2022; Hultine et al. 2023; Félix-Burruel et al. 2025). Expanding invasive grass populations and subsequent novel fire regimes in the Sonoran Desert (Wilder et al. 2021, 2024), an increase in micro-bursts and blowdown events that topple healthy adults, continued habitat loss, and drought impacts are cumulatively reshaping and diminishing columnar cacti populations.
Secondary impacts of heat and drought stress can also be expected through opportunistic insect damage due to a reduced capacity for plant defenses (Gely et al. 2020). Our observations from Loreto south to the La Paz region in Baja California Sur suggest these biotic effects are compounding the primary heat and drought-derived plant stress. Herbivory by insects at different life stages was commonly seen in much greater quantity after 2020–2021 in long-lived plants of columnar cacti and sarcocaulescent trees (Figures 9 and 10). In S. gummosus necrotic protuberances and ‘rib bites’ were seen to be caused by the larval and adult stages of the cactus long-horned beetle Moneilema sp. (Cerambycidae, Figure 9A,B) as seen in other cactus species (Torres-Castillo et al. 2015). Necrosis and tissue rotting were observed to be caused by adult Stratiomyidae soldier flies (Diptera order, Figure 9F), as commonly seen with cacti decay (Martínez-Falcón et al. 2023).
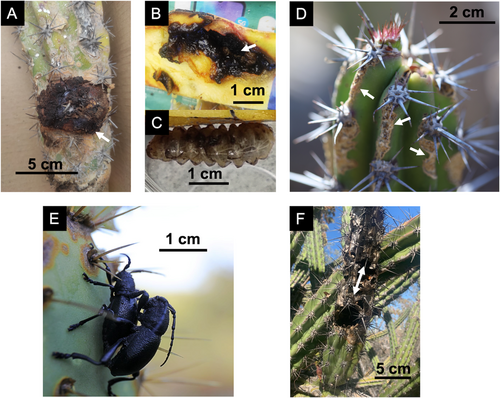
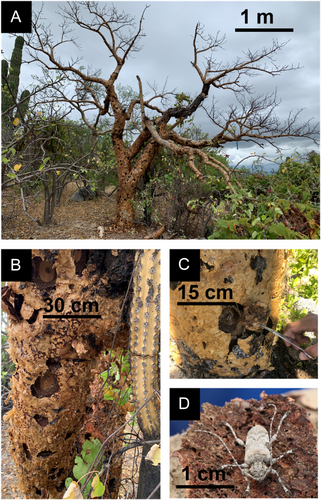
Many adult B. microphylla were seen riddled with “exit holes.” Reared larvae from infected branches of this species confirmed the presence of bark and wood-boring insects, including long-horned beetles, Lagocheirus sp. (Cerambycidae). These bark and wood-feeding species are known to participate in the decaying process of tropical dry forest trees (Muñoz-López et al. 2016). Lagocheirus sp. lay their eggs directly on wood or cracks in the Bursera bark. After a few days, the larva hatches and initially feeds in the area near the surface. As the larva matures, it mines deeper into sapwood and later into the wood, creating galleries while pushing out fibers of the scraped wood, plugging its entrance hole. Depending upon environmental conditions, it will remain as larvae or pupate to eventually exit the tree as adults.
Prolonged severe droughts reduce photosynthesis by inciting plant stomata to close and avoid water loss, consequently reducing the carbon-based defense compounds (Gely et al. 2020). It is notable to see such a degree of insect damage in Bursera, a softwood genus characterized for producing a wide range of volatile compounds such as terpenes and phenolic acids (carbon-based defense compounds) that effectively repel herbivores by inhibiting their digestive enzymes (Becerra et al. 2009; Becerra and Yetman 2024).
5 Conclusion
Extreme heat and drought events, and their synergistic effects, are increasingly impacting the entirety of the Sonoran Desert, as they are in other arid lands across the world. The legacy of these events is just beginning to emerge and many questions remain (Hoover and Smith 2025). Will iconic columnar cacti forests of the Sonoran Desert soon be scarce or even a thing of the past? Additional coordinated data, studies, and insights will help us better understand if the synergies of heat and drought events strung between and across years are linear or lead to exponential declines. Long-term studies of specific populations are also needed to help identify the capacity for individual plants to recover and where threshold and tipping points exist in different species. As the number and impact of heat and drought events mount, so does our effort to understand the state of ecological change to adequately communicate and prepare for the cascading disruptions.
Author Contributions
Benjamin T. Wilder: conceptualization, data curation, formal analysis, funding acquisition, investigation, methodology, project administration, resources, validation, visualization, writing – original draft, writing – review and editing. Kevin R. Hultine: data curation, formal analysis, investigation, methodology, writing – review and editing. Wetherbee Bryan Dorshow: formal analysis, methodology, visualization, writing – review and editing. Sula E. Vanderplank: data curation, formal analysis, investigation, methodology, writing – review and editing. Blanca R. López: data curation, investigation, visualization, writing – review and editing. Alfonso Medel-Narváez: data curation, investigation, writing – review and editing. Monica Marvan: investigation. Kristen Kindl: investigation. Aryn Musgrave: investigation. Shane Macfarlan: data curation, investigation, writing – review and editing. Exequiel Ezcurra: conceptualization, data curation, formal analysis, investigation, methodology, software, validation, visualization, writing – review and editing.
Acknowledgements
We learned of the mortality event of the desert vegetation from Christy Walton, who saw an abrupt change in the landscape. Her keen observation has created new alliances, scientific observations, and important changes in this landscape and far beyond. We would also like to thank Delia Marina Acuña Acosta, Peter Breslin, Alberto Búrquez, Michael Crimmins, Zackry Guido, César Hinojo Hinojo, Richard Laughran, and Anne McEnany for insightful conversations and contributions to this research. Wei Guo with NOAA IMSG, NESDIS/STAR provided access to the full VHI data set. Funding was provided by Fundación innovaciones Alumbra.
Conflicts of Interest
The authors declare no conflicts of interest.
Open Research
Data Availability Statement
The data that support the findings of this study are openly available in Dryad at: https://doi.org/10.5061/dryad.k6djh9wjn and as supplemental files in this GCB paper. Data from Mexican weather stations from manual readings is available at https://smn.conagua.gob.mx/es/climatologia/informacion-climatologica/informacion-estadistica-climatologica and from automated readings at https://smn.conagua.gob.mx/es/climatologia/temperaturas-y-lluvias/resumenes-mensuales-de-temperaturas-y-lluvias. Meteorological records from the US were obtained using the PRISM online database, using the Time Series Values for Individual Locations, https://www.prism.oregonstate.edu/explorer/. VHI data was downloaded from NOAA-NESDIS STAR Center at https://www.star.nesdis.noaa.gov/smcd/emb/vci/VH/vh_ftp.php and for D-VHI from https://doi.org/10.6084/m9.figshare.19811854.v5.


