Tundra Plant Canopies Gradually Close Over Three Decades While Cryptogams Persist
Funding: The establishment of the research sites was funded by the Department of Energy (DOE) as part of the R4D (Response, Resistance, Resilience to and Recovery from Disturbance in Arctic Ecosystems) program (grant DE-FG02-84ER60242.A006) as well as the Arctic LTER (Long Term Ecological Research) network (grant BSR-8705816). The project was also funded by National Science Foundation (NSF) grants OPP-9400083, OPP-9907127, OPP-0632277, OPP-0856710, OPP-1432982, OPP-1504381, OPP-1836898, and OPP-1836839.
ABSTRACT
Global climate change phenomena are amplified in Arctic regions, driving rapid changes in the biota. Here, we examine changes in plant community structure over more than 30 years at two sites in arctic Alaska, USA, Imnavait Creek and Toolik Lake, to understand long-term trends in tundra response to changing climate. Vegetation cover was sampled every 4–7 years on permanent 1 m2 plots spanning a 1 km2 grid using a point-frame. The vascular plant canopies progressively closed at both locations. Canopy cover, defined here as an encounter of a vascular plant above the ground surface, increased from 63% to 91% at Imnavait Creek and from 63% to 89% at Toolik Lake. Both sites showed steady increases in maximum canopy height, increasing by approximately 50% (8 cm). While cover and height increased to some extent for all vascular plant growth forms, deciduous shrubs and graminoids changed the most. For example, at Imnavait Creek the cover of graminoids more than tripled (particularly in wet meadow plots), increasing by 237%. At Toolik Lake the cover of deciduous shrubs more than doubled (particularly in moist acidic plots), increasing by 145%. Despite the steady closing of the plant canopy, cryptogams (lichens and mosses) persisted; in fact, the cover of lichens increased. These results call into question the dominant dogma that cryptogams will decline with increases in vascular plant abundance and demonstrate the resilience of these understory plants. In addition to overall cover, the diversity of vascular plants increased at one site (Imnavait Creek). In contrast to much of the Arctic, summer air temperatures in the Toolik Lake region have not significantly increased over the 30+ year sampling period; however, winter temperatures increased substantially. Changes in vegetation community structure at Imnavait Creek and Toolik Lake are likely the result of winter warming.
1 Introduction
Global climate change phenomena are amplified in the polar regions, with arctic temperatures rising nearly four times the rate of the global average (Rantanen et al. 2022; Thoman et al. 2023). Changing climate conditions have resulted in a longer growing season for vegetation and an overall “greening” of the Arctic, especially in Alaska (Jia et al. 2003; Walker et al. 2009; Arndt et al. 2019) and the North American tundra (Bhatt et al. 2010, 2021; Walker et al. 2012; Myers-Smith et al. 2020; Frost et al. 2023). Greening trends have largely been attributed to rapid pan-Arctic shrub expansion (i.e., shrubification). Rapid warming has led to increases in permafrost thaw (Thoman et al. 2023), which supports shrubification by allowing deeper root growth as well as increased nutrient availability (Myers-Smith et al. 2011; Mekonnen et al. 2021). Other local processes, including biotic interactions and disturbances, also contribute to changes in vegetation community structure (Tape et al. 2006; Myers-Smith et al. 2011; Loranty and Goetz 2012; Andreu-Hayles et al. 2020).
Arctic tundra vegetation has adapted to survive harsh, cold growing conditions and is therefore the subject of intensive research because of observed and predicted change due to climate warming (Callaghan and Jonasson 1995; Post et al. 2019; Henry et al. 2022). Studies of Arctic vegetation response to climate change include monitoring ambient conditions (Chapin III et al. 1995; Arft et al. 1999; Epstein et al. 2004; Walker et al. 2006; Villarreal et al. 2012), examination of plant-functional-type variation along Arctic climate gradients (Walker et al. 2012, 2019; Epstein et al. 2020), and experimental manipulations such as changes in temperature using greenhouses or open-top chambers (Chapin III et al. 1995; Wahren et al. 2005; Elmendorf et al. 2012; Hollister et al. 2015; Bjorkman et al. 2020) and nutrients (Chapin III et al. 1995; Hobbie et al. 2005; Gough et al. 2016; Iturrate-Garcia et al. 2020). Plant responses to experimental warming studies often mirror those found in nutrient addition studies, including increasing shrub (especially deciduous shrub) height and abundance (Chapin III et al. 1995; Hobbie et al. 2005; Wahren et al. 2005; Sistla et al. 2013; Hollister et al. 2015; Gough et al. 2016; Iturrate-Garcia et al. 2020), decreasing bryophyte and lichen abundance (Chapin III et al. 1995; Wahren et al. 2005; Hollister et al. 2015), and overall decreases in species richness (Chapin III et al. 1995; Hollister et al. 2015). Increases in canopy height throughout the Arctic have also been consistently documented in warming studies (Wahren et al. 2005; Elmendorf et al. 2012; Hollister et al. 2015). However, different community types show individualistic responses to environmental manipulations, with moist communities generally being more responsive than dry or inundated communities (Elmendorf et al. 2012; Jorgenson et al. 2015).
Vegetation change in long-term monitoring studies under ambient conditions can be complex and often does not directly mirror results found in experimental manipulation studies (Callaghan et al. 2011; Bjorkman et al. 2020; Myers-Smith et al. 2020). Bjorkman et al. (2020) conducted a synthesis comparing cover change trends in warming studies with long-term monitoring studies. They found warming studies generally showed a clear directional increase or decrease in cover for various functional groups, while monitoring studies showed mixed results. However, both warming studies and monitoring studies have found increases in canopy height (Elmendorf et al. 2012; Gould and Mercado-Díaz 2014; Bjorkman et al. 2018; Myers-Smith et al. 2019; Harris et al. 2022).
Trends in species diversity have been mixed within both experimental warming studies and long-term monitoring studies. Often, species diversity is relatively stable (Elmendorf et al. 2012; Myers-Smith et al. 2019; Harris et al. 2022). In some cases, experimental warming decreases species diversity (Chapin III et al. 1995; Hollister et al. 2015). In a global synthesis of species diversity change over the arctic tundra, García Criado et al. (2023) found species diversity was not changing over time. They did, however, detect declines in vascular species richness in response to shrubification. Shrubification has also been linked to declines in the abundance of cryptogams (Cornelissen et al. 2001; Pajunen et al. 2011; Chagnon and Boudreau 2019).
Long-term repeated monitoring (> 30 years) of vegetation change has occurred at very few locations (Villarreal et al. 2012; Jorgenson et al. 2015; Pedersen et al. 2022). Here, we highlight significant changes in vegetation structure that occurred over a more than 30-year period at two Alaskan low-Arctic tundra sites. Our two study areas span a total of two square kilometers and encompass a variety of plant communities representative of the broader region. Vegetation in the plots ranges from lichen-dominated dry heath to graminoid-dominated wet meadow. Our main goals were to determine (1) whether temporal changes in growth form cover and canopy height at our two study sites showed patterns typical of tundra greening (increases in canopy height and shrub abundance and declines in cryptogams) and (2) to document whether species diversity was declining over our sampling period. This study provides a detailed picture of decadal vegetation change in the Alaskan low-Arctic tundra.
2 Methods
2.1 Study Area
Two 1 km2 grids were established at Imnavait Creek (68°36′56′′ N, 149°18′21′′ W) in 1989 and at Toolik Lake (68°37′18′′ N, 149°36′25′′ W) in 1990. Both grids are located on the North Slope of Alaska in the foothills of the Brooks Mountain Range (Figure 1a). The two sites were originally part of the R4D (Response, Resistance, Resilience to and Recovery from Disturbance in Arctic Ecosystems) program of the Department of Energy with the intent of examining vegetation response to climate change and other forms of disturbance (Reynolds and Tenhunen 1996). Plots measuring 1 m2 and spaced 100 m apart were established in a rectangular grid pattern for both the Imnavait Creek (Figure 1b) and Toolik Lake sites (Figure 1c). The grids of plots used portions of 1 km × 1 km grids at Imnavait Creek and Toolik Lake where the vegetation was mapped at 1:500 and 1:6000 scales (Imnavait Creek: figure 4.5 and 4.6 in Walker and Walker 1996; Toolik Lake: Walker et al. 2009, 2014). Both 1 km2 grids are now part of the Circumpolar Active Layer Monitoring (CALM) program (Hinkel and Nelson 2003; Nyland et al. 2021). Plots completely submerged in water with no emergent vegetation were eliminated, leaving a total of 71 plots in the Imnavait Creek grid and 85 plots in the Toolik Lake grid (File S1).
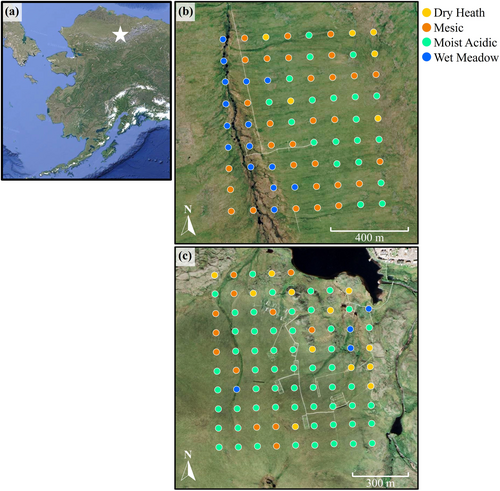
While in relatively close proximity to each other, the two sites have different glacial histories. The Imnavait Creek site is located on the Sagavanirktok (middle Pleistocene) glacial drift and is surrounded by gently rolling hills that experience less than 100 m of elevation change (Hamilton 1986; Walker et al. 1994, 2014). The Toolik Lake site is younger than Imnavait Creek and belongs to the Itkillik I glacial surface (late Pleistocene) (Hamilton 1986; Walker et al. 1994). The Imnavait Creek site is more homogenous than Toolik Lake and is located at the headwaters of a small tributary of the Kuparuk River (Walker et al. 1989, 1994). The landscape around the Toolik Lake site is heterogenous, dotted with small glacial lakes and mounds of sand and gravel deposits mixed in with areas of denser vegetation (Walker et al. 1989, 1994). Elevations between the two sites range from 670 to 980 m (Walker et al. 1994). The Imnavait Creek site is at a slightly higher elevation than Toolik Lake, resulting in marginally cooler summer temperatures.
2.2 Abiotic Data
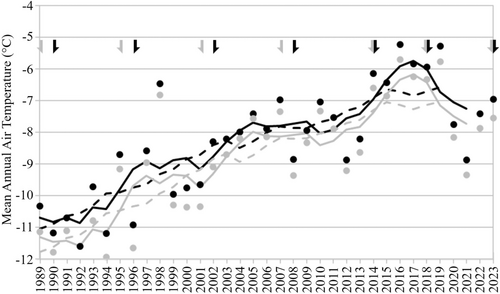
All climate data for Imnavait Creek and Toolik Lake were sourced using the daymetr package (Hufkens et al. 2018). Coordinates from the center of the two 1 km2 sampled grids were used to extract the nearest Daymet grid cell (1 km x 1 km). Daily means were calculated as the average of the daily minimum and maximum air temperatures. In general, the temperature variability is similar at both sites. The mean annual temperature at Imnavait Creek (from 1989 to 2023) was −8.8°C, the mean July temperature was 9.8°C, and the mean January temperature was −24.5°C. The mean annual temperature at Toolik Lake (from 1989 to 2023) at 1 m was −8.3°C, the mean July (peak growing season) temperature was 10.5°C, and the mean January temperature was −24.3°C. About 40% of the total annual precipitation falls during the winter (Cherry et al. 2014).
2.3 Vegetation Sampling
Vegetation cover estimates were obtained using the point-frame method outlined in the International Tundra Experiment (ITEX) manual (Molau and Mølgaard 1996). Vegetation sampling began in 1989 for Imnavait Creek and 1990 for Toolik Lake and was repeated every four to seven years (Gould et al. 2025). Measurements were collected by leveling a 100 × 100 cm frame with 100 crosshairs spaced 10 cm apart over each 1 m2 plot. The frame consisted of two parallel grids made of fishing line spaced 2 cm apart that, when aligned with four permanent research markers established at the first sampling, allowed for relatively accurate re-positioning of the frame each year. A ruler was then used to measure the height (cm) of the top (upper canopy) vegetative structure relative to the ground at each point. Structures covering the surface were recorded as having zero height. In some cases, nothing was present in the canopy layer and so bottom hits only were recorded. Recording only the top and bottom structures as opposed to all structures has been shown to be effective at capturing change in cover in tundra ecosystems (May and Hollister 2012). Top and bottom contacts were generally recorded to species for vascular plants or genus for cryptogams; the contact was also recorded as living or dead. Due to uncertainties of field identification, Draba, Dryas, and Pedicularis were not identified to species, a few graminoid taxa were merged, and very rarely an unidentified plant was recorded (less than 0.2% of records). All species names are in accordance with the World Flora Online Plant List (https://wfoplantlist.org/).
Generally, plot cover was calculated by summing all the encounters of a taxa and dividing by 100. However, points occupied by research markers during any census were removed from the analysis. This was done to remove the influence of changing numbers of markers (i.e., markers that were removed or lost and not replaced in subsequent samplings). For example, if there were three research markers in a plot and vascular plants occupied the remaining 97 encounters, then the cover of the vascular plant would be 100% (97/[100–3]). Given we only sampled the top and bottom encounters, the maximum cover possible was 200%.
2.4 Statistical Analyses
We used generalized least squares (GLS) models with an AR1 autocorrelation structure to account for temporal autocorrelation to test for temperature trends over time. Separate models were performed for each season (winter = October 1–April 30, spring = May 1–June 15, summer = June 16–August 15, and fall = August 16–September 30) and site. Seasons were defined in accordance with Hobbie et al. (2017).
A Hopkins Test was performed on the combined Imnavait Creek and Toolik Lake vegetation data sets to determine whether or not the species composition of plots was clustered or uniformly distributed. Next, Ward's cluster analysis, using the function ‘agnes’ within the package ‘cluster’ in R (Maechler et al. 2023) and the Bray-Curtis distance metric with a square-root transformation (Zelený 2022), was used to group plots with similar species composition into specific community types. Species cover from the first sampling (1989/1990) only was used to determine community type assignments. Community types were then applied to the remaining samplings for further analyses.
Mean values for the Imnavait Creek and Toolik Lake sites were calculated by taking the average plot value. Mean values for community types were calculated from the combined Imnavait Creek and Toolik Lake datasets. In the cases where sampling was done in adjacent years across the two sites, the sampling year was assigned as the mid-point of sampling years (e.g., 1995/1996 were combined to a single 1995.5 survey).
To assess change in cover over time, linear models using generalized least squares (GLS) and accounting for AR1 autocorrelation were performed for the average plot cover of each taxa against sampling year as a continuous variable using the package nlme (version 3.1–164). GLS models were performed for each site and community type separately.
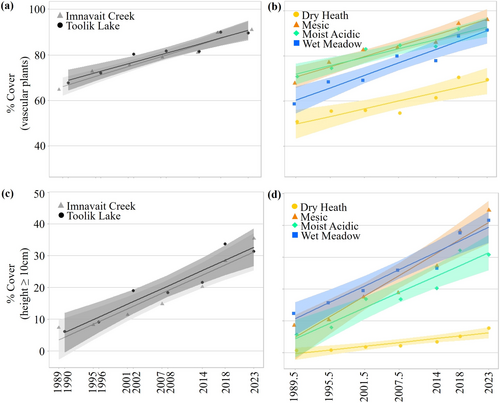
Canopy closure was assessed in multiple ways. For the first metric, canopy cover (with research markers removed) at both sites was calculated by plot by summing the number of vascular plants encountered in the top contact (to reach a maximum of 100). This analysis allowed us to track the reduction of non-vegetated ground as vascular plants increased in abundance. For the second metric, only vascular plants that were encountered at 10 cm or above were included in canopy cover calculations. This metric allowed us to document the expansion of more traditional canopy plant species (i.e., erect shrubs and tall graminoids) only.
To test whether competition between vascular plants and cryptogams triggered cryptogam declines, as has been posited in the literature (Cornelissen et al. 2001; Pajunen et al. 2011; Chagnon and Boudreau 2019), we explored the relationship between vascular plant cover in the canopy layer (top hits) and the cover of bryophytes and lichens (bottom hits) using group mean centering (van de Pol and Wright 2009). For this analysis, we conducted a mixed model with fixed effects of mean vascular cover (per plot, over all sampling periods) and the temporally demeaned (by plot) vascular cover of each plot in order to separately test the spatial and temporal relationships between vascular canopy closure and cryptogam responses. Plot random intercepts and slopes were included in all models. We used the lmerTest package (version 3.1.1) to test the significance of all fixed effects, using Satterthwaite denominator degrees of freedom. Residuals from this model failed the normality assumption of linear models; however, mixed models have been shown to be robust to departures from this assumption (Schielzeth et al. 2020). To ensure the robustness of our results, we also conducted a permutation test, where we randomized the response variable (bryophyte or lichen cover 1000 times) compared the slopes of the slope estimates from the randomized model to that observed in the observed data, which confirmed statistical significance of the same models. The marginal effects of spatial and temporal variation in vascular canopy cover were visualized using the ggeffects package (version 1.7.0).
Mean canopy height as well as mean growth form heights were calculated by sites by taking plot-level maximum recorded heights for each and averaging over all plots. Because bryophytes and lichens were only present in the bottom layer (and therefore had heights of 0 cm), they were excluded from the height analyses. Changes in mean canopy height and mean growth form heights were assessed using GLS models accounting for AR1 autocorrelation against sampling year as a continuous predictor variable.
Species composition data for all samplings and all plots was used to create an NMDS ordination to further visualize relationships between sites and community types using the Bray–Curtis dissimilarity metric and the vegan package (version 2.6–8). Species richness, Shannon's Diversity Index, Simpson's Index, canopy height, growth form heights, and the two canopy closure metrics were included as vectors using envfit to visualize the relationship between these variables and species cover. All statistical analyses were carried out in R version 4.4.1 (R Core Team 2023).
3 Results
Mean annual air temperature significantly changed over our sampling period at both sites (Figure 2). This trend was driven by winter warming, with average annual winter temperatures increasing by 0.13°C ± 0.02°C per year over our sampling period (Figure S1). Mean summer, spring, and fall air temperatures did not significantly change over our sampling period.
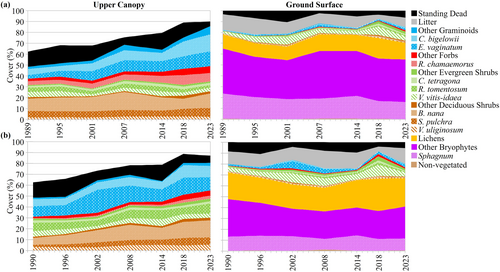
The distribution of cover among growth forms was similar at our two study sites (Figure 3). Deciduous shrubs and graminoids occupied the largest proportion of the upper canopy, while bryophytes, followed by lichens, occupied the largest proportion of the ground surface. Cover change trends between our two sites were similar across our sampling period, with large increases in vascular plants (Tables 1, S1, and S2). Total vascular cover increased by 91% at Imnavait Creek and 66% at Toolik Lake. The cover of deciduous shrubs increased at Toolik Lake only (132.3%); (Tables 1, S1, and S2). Forbs occupied the smallest proportion of the landscape (< 10%), but nearly tripled in cover at both sites (149.9% and 149.9% for Imnavait Creek and Toolik Lake respectively). Graminoid cover more than tripled at the Imnavait Creek site (236.6%), which was driven by large increases in Carex bigelowii and Eriophorum vaginatum (Table S1). Bryophytes did not experience any significant changes in cover at either site. Lichen cover increased at Imnavait Creek (21.0%).
| Site | Sampling year | Total vascular | Deciduous shrubs | Evergreen shrubs | Forbs | Graminoids | Bryophytes | Lichens |
|---|---|---|---|---|---|---|---|---|
| Imnavait Creek (n=71) | ↑ 91.1% | — | — | ↑ 149.9% | ↑ 236.6% | — | ↑21.0% | |
| 1989 | 52.4 (1.3) | 21.3 (1.5) | 13.1 (1.0) | 6.3 (0.6) | 11.7 (0.9) | 64.6 (2.3) | 13.2 (1.9) | |
| 1995 | 59.7 (1.7) | 22.1 (1.6) | 17.4 (1.2) | 6.7 (0.7) | 13.5 (1.2) | 57.4 (2.0) | 12.5 (1.8) | |
| 2001 | 65.9 (1.8) | 22.8 (1.7) | 15.7 (1.1) | 7.7 (0.8) | 19.7 (1.4) | 54.4 (2.1) | 12.5 (1.7) | |
| 2007 | 78.5 (1.8) | 27.1 (1.8) | 15.7 (1.1) | 8.3 (0.8) | 27.3 (2.1) | 62.4 (2.2) | 15.4 (1.9) | |
| 2014 | 70.7 (2.3) | 22.0 (1.5) | 16.9 (1.3) | 10.5 (1.3) | 21.3 (1.5) | 62.6 (2.1) | 14.7 (1.7) | |
| 2018 | 92.6 (2.4) | 23.8 (1.5) | 22.5 (1.6) | 16.2 (1.5) | 30.1 (1.6) | 55.7 (2.3) | 19.1 (2.0) | |
| 2023 | 100.1 (2.3) | 27.7 (1.8) | 17.2 (1.3) | 15.7 (1.6) | 39.5 (2.8) | 55.1 (2.1) | 15.3 (1.8) | |
| Toolik Lake (n=85) | ↑ 66.4% | ↑ 132.3% | — | ↑ 298.6% | — | — | — | |
| 1990 | 56.3 (1.3) | 13.6 (0.9) | 21.7 (1.1) | 2.2 (0.3) | 18.7 (1.1) | 47.3 (2.2) | 24.6 (2.1) | |
| 1996 | 59.3 (1.3) | 16.7 (1.0) | 19.7 (1.0) | 4.0 (0.5) | 18.9 (1.1) | 43.8 (2.0) | 23.2 (2.0) | |
| 2002 | 86.9 (2.4) | 22.1 (1.4) | 22.6 (1.1) | 4.9 (0.6) | 37.2 (2.7) | 38.8 (2.1) | 22.3 (2.0) | |
| 2008 | 87.5 (2.6) | 27.3 (1.6) | 26.7 (1.3) | 3.6 (0.5) | 29.9 (1.9) | 35.1 (1.9) | 21.7 (1.8) | |
| 2014 | 74.3 (2.0) | 23.2 (1.4) | 26.1 (1.3) | 5.0 (0.6) | 20.1 (1.4) | 39.6 (2.1) | 25.3 (2.2) | |
| 2018 | 105.5 (2.7) | 31.4 (1.9) | 33.0 (1.6) | 9.4 (1.2) | 31.7 (2.1) | 36.4 (2.0) | 29.9 (2.3) | |
| 2023 | 93.6 (1.9) | 31.7 (1.9) | 24.8 (1.4) | 8.7 (1.0) | 28.5 (1.7) | 40.5 (1.9) | 26.1 (2.2) |
- Note: Values are the mean over all plots with the standard error in parentheses. Both upper canopy and ground surface hits were included, resulting in a maximum of 200% cover. Arrows and percentages indicate the direction and magnitude of change for the growth forms that had significant changes over time (see Table S2 for GLS model results). Dashes indicate a non-significant change. The colored texts in Table 1 correspond with the matching growth forms in Figure 3. The bold values a significant trend over time.
Ward's cluster analysis identified four community types with differing hydrologic regimes and dominant vegetation species from the resulting dendrogram (dry heath, mesic, moist acidic, and wet meadow; Figure S2). These include: (1) dry heath, characterized by low-stature prostrate and dwarf shrub tundras, including shallow Cassiope snowbeds; (2) moist acidic, dominated by graminoid-rich tussock tundra; (3) mesic, a mix of mostly deciduous shrub tundras, including shrubby tussock tundra with a higher proportion of shrubs than graminoids, dwarf shrub birch tundra, and low willow shrubland; and (4) wet meadow, which includes both poor fens with slightly acidic organic soils (dominated by sedges and abundant Sphagnum mosses) and open Salix pulchra shrublands with wet meadow vegetation in the understory. Moist non-acidic plots, which are uncommon (~7%), are dominated by non-tussock sedges and are split between moist acidic and mesic communities. Vegetation cover distributions and percent change over time showed greater differences among these community types than between sites (Figures S3 and S4). When vegetation changes were analyzed by community type (combining both sites), graminoids had the largest percent increases in wet meadow plots while deciduous shrubs had the largest increases in moist acidic plots (Tables 2 and S3). Total vascular cover also increased the most in wet meadow plots. While lichens did not significantly increase in cover across our entire sampling area, they did increase in some community types (dry and mesic). Bryophytes decreased in cover in mesic plots only.
| Community types | Sampling year | Total vascular | Deciduous shrubs | Evergreen shrubs | Forbs | Graminoids | Bryophytes | Lichens |
|---|---|---|---|---|---|---|---|---|
 Dry heath (n = 18) Dry heath (n = 18) |
↑ 57.0% | — | ↑ 49.1% | ↑ 197.1% | — | — | ↑ 17.2% | |
| 1989/1990 | 45.6 (3.2) | 15.8 (2.9) | 20.5 (2.8) | 3.3 (2.8) | 5.9 (1.5) | 18.3 (3.0) | 52.6 (4.0) | |
| 1995/1996 | 49.0 (3.4) | 17.8 (3.6) | 23.3 (3.0) | 4.2 (3.0) | 3.6 (0.9) | 16.8 (2.1) | 49.8 (2.9) | |
| 2001/2002 | 57.4 (4.7) | 20.7 (4.5) | 26.2 (3.1) | 5.2 (3.1) | 5.3 (1.2) | 13.8 (1.9) | 48.0 (3.3) | |
| 2007/2008 | 55.4 (5.2) | 23.1 (4.6) | 22.2 (2.7) | 3.5 (2.7) | 6.5 (1.5) | 18.1 (2.7) | 46.3 (2.8) | |
| 2014 | 60.0 (5.0) | 22.1 (4.0) | 28.0 (3.5) | 6.0 (3.5) | 3.9 (1.0) | 19.4 (3.4) | 53.8 (3.4) | |
| 2018 | 68.8 (5.2) | 19.3 (3.0) | 30.3 (4.3) | 8.6 (4.3) | 10.7 (2.4) | 19.9 (3.8) | 59.5 (3.4) | |
| 2023 | 71.5 (5.5) | 21.4 (3.1) | 30.6 (4.3) | 9.8 (4.3) | 9.7 (2.6) | 18.8 (2.9) | 55.8 (4.0) | |
 Mesic (n = 42) Mesic (n = 42) |
↑ 92.5% | ↑ 61.0% | — | ↑ 197.1% | ↑ 181.8% | ↓ 23.1% | ↑ 36.8% | |
| 1989/1990 | 57.3 (1.6) | 22.3 (1.5) | 15.9 (1.4) | 5.7 (1.4) | 13.5 (1.4) | 72.6 (1.6) | 6.8 (1.1) | |
| 1995/1996 | 64.1 (1.5) | 24.6 (1.6) | 18.0 (1.3) | 7.4 (1.3) | 14.0 (1.1) | 63.7 (1.5) | 5.7 (1.0) | |
| 2001/2002 | 79.8 (2.8) | 28.8 (1.6) | 18.5 (1.4) | 8.4 (1.4) | 24.1 (2.2) | 58.3 (1.9) | 5.7 (0.7) | |
| 2007/2008 | 86.1 (1.9) | 31.7 (1.8) | 19.5 (1.5) | 7.3 (1.5) | 27.6 (2.3) | 64.5 (2.0) | 8.6 (1.1) | |
| 2014 | 77.9 (2.4) | 28.2 (1.8) | 19.5 (1.7) | 9.2 (1.7) | 21.0 (1.7) | 64.6 (2.2) | 8.3 (1.0) | |
| 2018 | 106.0 (2.8) | 30.5 (2.3) | 28.2 (2.2) | 18.1 (2.2) | 29.3 (1.9) | 56.8 (2.6) | 11.5 (1.2) | |
| 2023 | 110.4 (2.1) | 35.9 (2.6) | 19.6 (1.7) | 17.0 (1.7) | 37.9 (3.3) | 55.7 (1.8) | 9.1 (1.1) | |
 Moist acidic (n = 77) Moist acidic (n = 77) |
↑ 68.6% | ↑ 122.8% | — | ↑ 210.0% | — | — | — | |
| 1989/1990 | 56.6 (1.1) | 12.4 (0.9) | 21.5 (0.9) | 2.3 (0.9) | 20.4 (0.9) | 49.3 (1.6) | 23.1 (1.6) | |
| 1995/1996 | 60.5 (1.3) | 14.9 (0.9) | 20.8 (0.9) | 3.2 (0.9) | 21.6 (1.1) | 45.3 (1.5) | 22.1 (1.5) | |
| 2001/2002 | 84.7 (2.4) | 17.8 (1.0) | 21.6 (1.0) | 4.1 (1.0) | 41.3 (2.4) | 40.4 (1.6) | 21.6 (1.5) | |
| 2007/2008 | 90.1 (2.3) | 24.6 (1.5) | 26.6 (1.2) | 3.5 (1.2) | 35.4 (1.7) | 38.6 (1.7) | 22.2 (1.5) | |
| 2014 | 74.2 (2.2) | 19.7 (1.2) | 25.6 (1.2) | 4.2 (1.2) | 24.7 (1.3) | 42.6 (1.7) | 24.1 (1.5) | |
| 2018 | 105.9 (2.5) | 28.3 (1.6) | 32.5 (1.4) | 7.5 (1.4) | 37.7 (1.9) | 37.6 (1.4) | 29.7 (1.6) | |
| 2023 | 95.5 (1.6) | 27.7 (1.7) | 23.3 (1.1) | 7.0 (1.1) | 37.6 (1.9) | 42.3 (1.4) | 24.6 (1.5) | |
 Wet meadow (n = 19) Wet meadow (n = 19) |
↑ 96.1% | — | ↑ 88.6% | ↑ 169.4% | ↑ 216.3% | — | — | |
| 1989/1990 | 47.9 (3.1) | 25.7 (3.6) | 4.4 (1.0) | 8.4 (1.0) | 9.4 (1.8) | 75.5 (2.7) | 1.0 (0.3) | |
| 1995/1996 | 55.1 (4.0) | 25.7 (4.0) | 6.7 (1.6) | 9.8 (1.6) | 12.9 (2.3) | 70.0 (1.9) | 1.2 (0.4) | |
| 2001/2002 | 61.2 (3.8) | 28.8 (4.7) | 6.7 (1.6) | 10.9 (1.6) | 14.8 (2.8) | 70.7 (2.6) | 0.8 (0.3) | |
| 2007/2008 | 76.9 (2.6) | 31.9 (4.8) | 6.3 (1.4) | 13.5 (1.4) | 25.1 (4.7) | 73.4 (3.5) | 1.3 (0.4) | |
| 2014 | 67.2 (4.1) | 23.0 (3.7) | 6.2 (1.5) | 18.6 (1.5) | 19.4 (3.6) | 76.2 (2.6) | 1.4 (0.5) | |
| 2018 | 89.1 (3.4) | 29.3 (5.2) | 9.4 (2.2) | 24.2 (2.2) | 26.4 (3.5) | 73.8 (3.2) | 2.7 (1.1) | |
| 2023 | 94.0 (2.7) | 33.4 (4.9) | 8.4 (2.3) | 22.6 (2.3) | 29.7 (5.0) | 73.7 (3.6) | 1.2 (0.4) | |
- Note: Values are the mean over all plots with the standard error in parentheses. Both upper canopy and ground surface hits were included, resulting in a maximum of 200%. Arrows and percentages indicate the direction and magnitude of change for the growth forms that had significant changes over time (see Table S3 for GLS model results). Dashes indicate a non-significant change. The colored texts in Table 2 correspond with the matching growth forms in Figure 3. The bold values a significant trend over time.
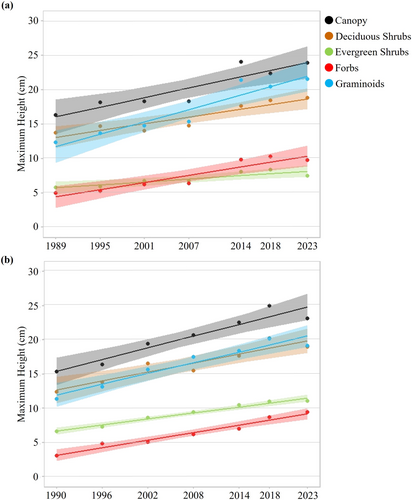
The largest and most consistent changes observed over time were changes in the canopy. We define the canopy here as any encounter of a living or dead vascular plant above the ground surface. At the first sampling a living plant only occurred in the upper canopy at less than 50% of the points whereas from 2018 onwards a living plant occurred in the upper canopy at more than 80% of the points (Figure 3). The cover of the canopy (live and standing dead) increased from less than 70% during the first sampling to nearly 90% by 2018 (Figure 4a). We also examined the cover of canopy encounters at or above 10 cm height and also found an increase from less than 10% during the first sampling to over 28% after 2018 (Figure 4c). These changes were consistent across sites and community types; however, they were less pronounced in dry heath communities (Figure 4). The profile of height across the plots changed over time from mostly heights of zero to a more gradual distribution of varying heights up to nearly 30 cm, these changes are driven primarily by an increase in the cover of tall plants (Figure S5). The height of the tallest plant in a plot also increased at both of our study sites, increasing by 48% (7.8 cm) at Imnavait Creek and 56% (8.3 cm) at Toolik Lake over our sampling period (Figure 5). The maximum height for all major vascular growth forms also increased over time at both sites.
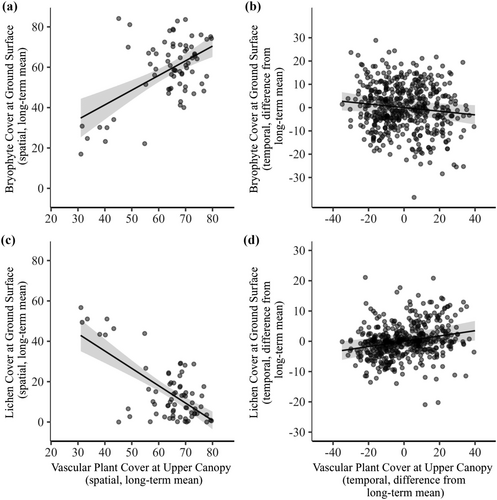
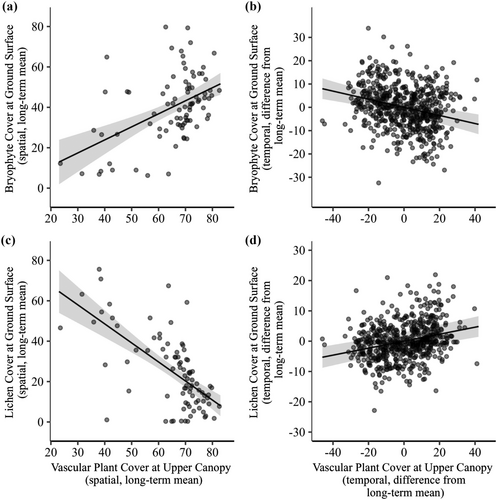
Plots with high vascular canopy cover tended to have high cover of bryophytes and low lichen cover (Figures 6a,c, 7a,c). Conversely, increases in canopy cover over time were accompanied by a decrease in bryophyte cover (Figures 6b, 7b) and an increase in lichen cover (Figure 6d,d) within individual plots.
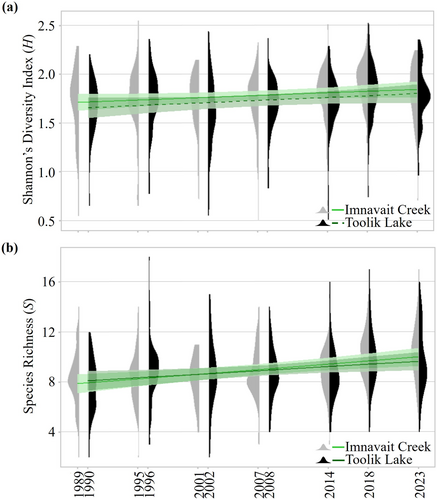
Both of our two study sites showed significant increases in vascular plant species richness per plot over time (Figure 8, Table S4). Richness changes largely occurred due to colonization by species already at the site in the initial sampling, rather than new species colonizing the site, with increases in the number of species in a plot regardless of whether the site as a whole was gaining or losing species (Table S4). Trends in Shannon's Diversity Index were similar to species richness in that both sites had higher values in later years, but the trend over time was only significant at Imnavait Creek. Neither Simpson's Index nor Pielou's Evenness showed significant change over time at either study site (Figure S6). When analyzed by community type, wet meadow plots had significant changes in multiple diversity indices, but the remaining communities showed little to no change (Figure S7). Species richness was the only diversity index with a significant change over time for more than one community type.
4 Discussion
4.1 Trends in Canopy Cover
We observed consistent increases in canopy closure across three decades regardless of community type or how the canopy was defined (Figures 3, 4, and S5). The region experienced significant warming over the study period consistent with that experienced by the vast majority of the Arctic (Rantanen et al. 2022; Thoman et al. 2023). However, warming in our study region is primarily occurring in the winter months (Figure S1). Chmura et al. (2023) reported similar warming trends for Toolik Lake including a 10-day reduction in the annual duration that soil was frozen at 1 m depth, due to earlier soil freeze at the end of the growing season and earlier thaw in the summer, over their 25-year study period from 1994 to 2020. Hobbie et al. (2017) also reported a number of factors associated with climate warming that were occurring in the region such as warming of permafrost temperatures, increases in plant biomass, and changes in surface water chemistry indicative of thawing permafrost.
Even though our study region did not experience an increasing air warming trend during the summer, we observed substantial changes in vegetation cover similar to those found in warming studies. Other experimental studies in the region have shown responses to nutrient additions and snow manipulations often result in changes in plant cover consistent with summer air warming, such as increases in biomass and shrubs (Shaver et al. 2001; Wahren et al. 2005). In this study, shrubs increased in cover at Toolik Lake while graminoids increased in cover at Imnavait Creek (Table 1; Figure 3), and when combined, both sites had increases in cover of plants that are generally tall in stature (Figure S5b). Shrubification has been well documented in the Arctic (Myers-Smith et al. 2011; Tape et al. 2012; Mekonnen et al. 2021) and is rapidly occurring at the Toolik Lake site in particular, where deciduous shrubs more than doubled in cover in just over 30 years. While shrub abundance has been shown to increase in response to warming and snow manipulation (Wahren et al. 2005; Elmendorf et al. 2012; Sistla et al. 2013; Bjorkman et al. 2020), ambient, landscape-scale trends have not been documented for this region. There are multiple mechanisms that can facilitate shrub expansion, including growth of already established individuals, seed dispersal, and clonal expansion (Jónsdóttir et al. 1996; Douhovnikoff et al. 2010; Myers-Smith and Hik 2018). Due to the harsh arctic environment, it is generally thought that growth and clonal expansion are the dominant mechanisms of shrub expansion (Bliss 1958; Jónsdóttir et al. 1996). Our observed increases in shrub abundance are therefore likely due to the growth of already established individuals; however, future studies could investigate whether seed recruitment or clonal expansion rates are increasing as the climate continues to warm. Increases in canopy height (Wahren et al. 2005; Elmendorf et al. 2012; Hollister et al. 2015) and specifically shrub height (Wahren et al. 2005; Hudson et al. 2011; Elmendorf et al. 2012) have also been well documented. Our sites not only mirrored these trends, experiencing approximately a 50% increase in canopy height over our sampling period, but also had consistent increases in the cover of tall plants (i.e., tall graminoids and shrubs, Figure S5b).
The most unexpected result at our two sites was the trends in bryophyte and lichen cover (Table 1; Figures 3, 6, and 7). Previous studies have documented declines in cryptogam abundance and diversity both with experimental warming (Jägerbrand et al. 2006; Elmendorf et al. 2012; Lang et al. 2012; Bjorkman et al. 2020) and under ambient conditions (Fraser et al. 2014) across the Arctic. Lang et al. (2012) found that lichens and non-Sphagnum mosses in particular showed greater responses to experimental warming at Toolik Lake, significantly decreasing in species richness, Shannon Index, and abundance after 16 years of warming. Declines in lichen abundance in response to increases in vascular plant cover have also been documented elsewhere across the tundra biome (Cornelissen et al. 2001; Pajunen et al. 2011; Chagnon and Boudreau 2019). At both Imnavait Creek and Toolik Lake, however, lichens actually increased in cover over time within individual plots as vascular plants filled in the canopy (Figures 6d, 7d) despite the fact that high canopy cover was associated with low lichen cover across the landscape (Figures 6c, 7c). It is important to note, however, that lichens only increased in cover within dry heath and mesic plots. In these communities, the cover of the canopy was less than 100% and, while rapidly closing, still had significant open space. Therefore, it is possible, maybe even likely, that the cover of lichens will decline after the canopy is more than 100% occupied and significant shading occurs. At both sites, bryophytes experienced small declines in response to canopy closure (Figures 6b, 7b) but remained relatively stable over time (Tables 1 and 2).
It is possible that observed declines in cryptogam abundance with experimental warming in other studies are due to an intolerance to temperature-driven desiccation rather than competition with vascular plants. Another possible explanation is that cryptogams may actually benefit from partial shading provided by a closing canopy up to a certain threshold or respond positively to the same drivers as vascular plants, at which point competition may begin to overtake nonvascular plants. Such a threshold may have been realized in long-term warming studies, but not ambient monitoring studies. Documented increases in precipitation in the Arctic (and subsequent increases in soil moisture) are likely offsetting any drying that would otherwise occur with rapidly rising air temperatures. It could also be that the decline in cryptogams reported in some studies is an artifact of reporting values as relative cover, which would show a decline in cover relative to the total plot cover (e.g., Hollister et al. 2015; Walker et al. 2006).
Growth form cover distributions and change over time at our sites were most comparable to a similar study in Atqasuk, Alaska (Harris et al. 2022; Table 1; Figure 3). Harris et al. (2022) investigated the relationship between various climate variables and ambient vegetation change within a subset of plots in an identically structured grid to our sites. They found increases in cover for all vascular growth forms (deciduous shrubs, evergreen shrubs, graminoids, and forbs) while the nonvascular growth forms (bryophytes and lichens) remained mostly unchanged. Vegetation change trends at Atqasuk were not strongly related to air temperature in the year of sampling, although they were correlated with soil moisture (Harris et al. 2022). Our results, combined with the results of Harris et al. call into question the dominant dogma that cryptogams will decline with increases in vascular abundance and demonstrate the resilience of these understory plants (Harley et al. 1989; Murray et al. 1993).
4.2 Trends in Diversity
Our results also demonstrate the complexities of species diversity responses to climate change in the Arctic. Experimental warming studies generally report declines in species diversity at individual sites and community types (Chapin III et al. 1995; Lang et al. 2012; Hollister et al. 2015); however, monitoring studies more often document no trend in species diversity over time at larger geographic scales (Myers-Smith et al. 2019; Harris et al. 2022). Our results at Imnavait Creek and Toolik Lake were unusual in that species richness increased over time at both sites (Figure 8b) and Shannon's Diversity Index increased over time at Imnavait Creek (Figure 8a). Across sites, wet meadow plots were the only community type with substantial changes in diversity over time (Figure S7) which are likely driving observed increases in Shannon's Diversity Index at Imnavait Creek. It should be noted that our sampling technique may be underestimating diversity calculations. Rare species (particularly small forbs) that are encountered in one sampling may be overtopped by taller plants in later samplings, and therefore missed. The GLORIA network (Global Observation Research Initiative in Alpine Environments) also found increases in species diversity in alpine summits across Europe in response to climate warming, likely as a result of range expansions of local species (Steinbauer et al. 2018). It is possible that the Imnavait Creek site is experiencing a similar phenomenon in that nearby species are expanding their ranges as the climate changes.
Even though our sites were geographically close together, the dominant plant community differs between the two sites, which could explain the different vegetation trajectories. Imnavait Creek has more mesic plots than any other community type, while Toolik Lake is > 60% moist acidic tundra (Figures 1 and S2). Because there are differences in glacial histories between the two sites (and therefore ages), natural succession may be responsible for differences in plant community type distributions. Wetter communities have been shown to be more responsive to changing environmental conditions (Elmendorf et al. 2012) which mirrors our own results showing larger increases of both vascular cover and species diversity in wet meadow plots (Table 2; Figure S7). Additionally, García Criado et al. (2023) showed that species richness tends to decrease in places where shrub cover has increased, while richness tends to increase in places where forb and graminoid cover has increased. This directly supports the diversity trends we found at Imnavait Creek, where graminoid cover increased by 237% (Table 1; Figure 3). The combined results of our two study sites demonstrate the heterogeneity of community responses to climate change over time.
5 Conclusion
These findings support prior research which also showed vascular plants are experiencing substantial changes in cover across the tundra landscape (Chapin III et al. 1995; Wahren et al. 2005; Elmendorf et al. 2012; Hollister et al. 2015; Niittynen et al. 2020; Harris et al. 2022). Both Imnavait Creek and Toolik Lake experienced large increases in vascular cover over time that were likely driven by a changing winter climate. We show large increases in the cover of vascular plants, resulting in the canopy changing from relatively open (63% cover at both Imnavait Creek and Toolik Lake) to nearly closed (91% and 89% cover at Imnavait Creek and Toolik Lake respectively). The plant canopy has also grown taller. Despite the observed increase in vascular plants, the cover of lichens increased in response to a closing canopy. Therefore, cryptogam communities must be resilient to competition imposed by rapidly increasing vascular plant cover or have not yet reached a threshold where they are adversely affected by a closing canopy. Indeed, lichens responded positively to the expanding canopy and seemed to either benefit from it or respond positively to the same variables affecting the overstory. Similarly, species diversity not only persisted but increased over our sampling period. Due to the heterogeneity of the Arctic landscape and the inconsistencies in which it is experiencing climate warming, it is essential to continue to monitor how different regions and communities are changing over time (Henry et al. 2022; Hollister 2024).
Author Contributions
Katlyn R. Betway-May: conceptualization, data curation, formal analysis, visualization, writing – original draft, writing – review and editing. William A. Gould: conceptualization, data curation, funding acquisition, investigation, methodology, project administration, resources, supervision, visualization, writing – review and editing. Sarah C. Elmendorf: conceptualization, formal analysis, writing – review and editing. Jeremy L. May: conceptualization, visualization, writing – review and editing. Robert D. Hollister: conceptualization, funding acquisition, writing – review and editing. Steven F. Oberbauer: funding acquisition, writing – review and editing. Amy Breen: data curation, writing – review and editing. Benjamin J. Crain: data curation, writing – review and editing. Ana Maria Sanchez Cuervo: data curation, writing – review and editing. Marilyn D. Walker: data curation, funding acquisition, investigation, methodology, project administration, resources, supervision. Donald A. Walker: data curation, funding acquisition, investigation, methodology, project administration, resources, supervision, visualization, writing – review and editing.
Acknowledgements
The establishment of the research sites was funded by the Department of Energy (DOE) as part of the R4D (Response, Resistance, Resilience to and Recovery from Disturbance in Arctic Ecosystems) program (grant DE-FG02-84ER60242.A006) as well as the Arctic LTER (Long Term Ecological Research) network (grant BSR-8705816). The project was also funded by National Science Foundation (NSF) grants OPP-9400083, OPP-9907127, OPP-0632277, OPP-0856710, OPP-1432982, OPP-1504381, OPP-1836898, and OPP-1836839. We would like to thank all members of the International Tundra Experiment (ITEX) for continued inspiration and support of this research. We would also like to thank Joel Mercado-Díaz for providing early inspiration for the manuscript. We thank staff at the University of Alaska Institute of Arctic Biology, CH2MHill Polar Services, and Battelle Polar Operations for logistical support at Toolik Field Station. We would like to thank the many field research assistants for sampling over the last three decades. All research at the USDA Forest Service International Institute of Tropical Forestry is done in collaboration with the University of Puerto Rico. Climate datasets were provided by the Toolik Field Station Environmental Data Center (supported by NSF grants OPP-1623461 and OPP-2221133) and the Arctic LTER (supported by NSF grants DEB-1637459, DEB-1026843, DEB-9810222, DEB-9211775, and DEB-8702328).
Conflicts of Interest
The authors declare no conflicts of interest.
Open Research
Data Availability Statement
The data that support the findings of this study are openly available in the Forest Service Research Data Archive at https://doi.org/10.2737/RDS-2024-0048.Climate data were sourced using the daymetr package, which is available in Zenodo atand Github at https://github.com/bluegreen-labs/daymetr (Version 1.7.1).


