Shortened temperature-relevant period of spring leaf-out in temperate-zone trees
Abstract
Temperature during a particular period prior to spring leaf-out, the temperature-relevant period (TRP), is a strong determinant of the leaf-out date in temperate-zone trees. Climatic warming has substantially advanced leaf-out dates in temperate biomes worldwide, but its effect on the beginning and length of the TRP has not yet been explored, despite its direct relevance for phenology modeling. Using 1,551 species–site combinations of long-term (1951–2016) in situ observations on six tree species (namely, Aesculus hippocastanum, Alnus glutinosa, Betula pendula, Fagus sylvatica, Fraxinus excelsior, and Quercus robur) in central Europe, we found that the advancing leaf-out was accompanied by a shortening of the TRP. On average across all species and sites, the length of the TRP significantly decreased by 23% (p < .05), from 60 ± 4 days during 1951–1965 to 47 ± 4 days during 2002–2016. Importantly, the average start date of the TRP did not vary significantly over the study period (March 2–5, DOY = 61–64), which could be explained by sufficient chilling over the study period in the regions considered. The advanced leaf-out date with unchanged beginning of the TRP can be explained by the faster accumulation of the required heat due to climatic warming, which overcompensated for the retarding effect of shortening daylength on bud development. This study shows that climate warming has not yet affected the mean TRP starting date in the study region, implying that phenology modules in global land surface models might be reliable assuming a fixed TRP starting date at least for the temperate central Europe. Field warming experiments do, however, remain necessary to test to what extent the length of TRP will continue to shorten and whether the starting date will remain stable under future climate conditions.
1 INTRODUCTION
Climate warming has advanced the spring leaf-out phenology by ~2.5 days per decade since 1970s in temperate and boreal deciduous trees (Fu, Zhao, et al., 2015; Menzel et al., 2006; Parmesan & Yohe, 2003; Peñuelas & Filella, 2001), which can subsequently affect the structure and function of terrestrial ecosystems (Piao et al., 2017; Thackeray et al., 2016; Zohner, Mo, & Renner, 2018) and lead to substantial climatic feedbacks (Ma, Huang, Hänninen, & Berninger, 2018; Peñuelas, Rutishauser, & Filella, 2009; Richardson et al., 2013). Our mechanistic understanding of the processes controlling leaf-out date, however, remains limited (Chuine & Regniere, 2017; Richardson et al., 2013). In 1735, the French naturalist Réne Réaumur first proposed that an accumulation of warm temperature prior to spring leaf-out date during a particular temperature-relevant period (TRP) is the main determinant of leaf-out phenology (Abramovici, 2010). The length of the TRP, however, may be affected by climate change due to asymmetrical seasonal climatic warming and coregulation of leaf-out phenology by other environmental cues (Cleland, Chuine, Menzel, Mooney, & Schwartz, 2007; Flynn & Wolkovich, 2018; Fu, Piao, et al., 2019; Körner & Basler, 2010). The extent to which the length of TRP changes and the underlying controlling mechanisms have not yet been thoroughly investigated on a large scale, although its investigation may help improving plant phenology models.
Two phases are generally distinguished during winter dormancy of temperate-zone trees (Hänninen, 2016; Lang, 1987; Malyshev, Henry, Bolte, Arfin Khan, & Kreyling, 2018). After the initiation of dormancy, trees enter into the first dormancy phase, endodormancy, during which a certain amount of cold temperatures needs to accumulate, that is, the chilling requirement, to break endodormancy and allow the trees to enter into the second dormancy phase, ecodormancy (Lang, 1987). During ecodormancy, warm temperatures, that is, heat, accumulate and leaf-out is initiated once a certain amount of heat (i.e., the heat requirement) has accumulated. Previous studies have reported a negative correlation between the chilling and heating requirements, with lower chilling accumulation increasing the heating requirement (Cannell & Smith, 1986; Murray, Cannell, & Smith, 1989). A rapid warming trend during winter has been reported (IPCC, 2014), which may subsequently delay the start of ecodormancy and increase the heat requirement for leaf-out due to insufficient chilling (Fu, Piao, et al., 2015; Pletsers, Caffarra, Kelleher, & Donnelly, 2015). This may, in turn, alter the length of the TRP, as more time may be needed to accumulate the increased heat requirement, while the warmer conditions accelerate the accumulation of heat and thus shorten the TRP. How these opposite effects of climate warming impact on the start and length of the TRP still remains unclear.
In addition to the chilling effect, the heating requirement may also be affected by other environmental cues, especially photoperiod (Caffarra & Donnelly, 2011; Flynn & Wolkovich, 2018; Fu, Piao, et al., 2019; Körner & Basler, 2010; Zohner, Benito, Svenning, & Renner, 2016). For example, a long photoperiod may compensate for the chilling deficit and guarantee that tree leaf-out is not too late to miss the optimal environmental conditions for photosynthesis (Flynn & Wolkovich, 2018; Pletsers et al., 2015; Way & Montgomery, 2015). The effect of photoperiod on spring leaf-out date has been widely discussed (Chuine, Morin, & Bugmann, 2010; Körner & Basler, 2010), but the interactions of photoperiod with other physiological and environmental cues in determining leaf-out phenology are still largely unknown (Caffarra, Donnelly, & Chuine, 2011; but see Fu, Zhang, et al., 2019). This lack of knowledge may result from limitations in our approaches for measuring the effect of photoperiod on spring leaf-out date (Chuine et al., 2016). The effect of photoperiod may gradually increase in the future because the advance of spring phenology due to climate warming force the buds to develop at shorter photoperiod, which could subsequently decrease the temperature control on leaf-out date phenology (Fu, Zhao, et al., 2015). How the interactive effects among these physiological and environmental cues affect endodormancy release and thereby the start date of the TRP, and how they impact the heat requirement and thereby the duration of the TRP, to our knowledge, has not yet been investigated over large spatial and temporal scales.
We therefore studied the changes of the start and length of the TRP for leaf-out date in adult trees of six species in Europe during 1951–2016 using 1,551 species–site combinations of in situ leaf-out date observations. The most TRP was determined using a partial correlation analysis to remove the confounding effects of precipitation and radiation that were defined as the sum of precipitation and radiation during the TRP. The temporal changes of TRP were determined using a 15 year moving window method, and the length in TRP of the beginning and the last window was compared.
2 MATERIALS AND METHODS
2.1 Datasets
Six dominant temperate tree species in Europe were used: Aesculus hippocastanum (AH, European horse chestnut), Alnus glutinosa (AG, European alder), Betula pendula (BP, European silver birch), Fagus sylvatica (FS, European beech), Fraxinus excelsior (FE, European ash), and Quercus robur (QR, oak). In situ phenological observations of leaf-out dates of the six species were obtained from the open-access database of the Pan European Phenology network (http://www.pep725.eu/; Templ et al., 2018). We excluded potential biases caused by outliers by removing the data outside the range of two standard deviations of the mean leaf-out date and selecting the sites with records longer than 30 years for 1951–2016 and 7 years for the two 15 year periods, that is, 1951–1965 and 2002–2016 which are the first and last window in the moving window analysis. A total of 1,551 site–species combinations (406 sites and six tree species) were selected, mainly focused in Germany and Austria (Figure S1). The daily climatic data, including mean air temperature (°C), precipitation (mm), and solar radiation (W/m2), for each site were derived from a gridded climatic dataset of daily maximum and minimum temperatures at a spatial resolution of 0.25° (approximately 25 km; Fu, Zhao, et al., 2015).
2.2 Analysis
The TRP was defined as the period (ranging between 15 and 120 days, with 15 day steps) before the mean leaf-out date at each site for each species, with the highest absolute partial correlation coefficient between leaf-out date and mean air temperature (RTRP). The effects of precipitation and solar radiation on leaf-out were excluded in this method. The frequency distributions of mean leaf-out date, the length of the TRP and RTRP between 1951–1965 and 2002–2016 for each and all species across all sites were determined and shown as histograms, and the mean and 1 SD were calculated. A paired-sample t test was used to examine the differences in mean leaf-out date, TRP, and RTRP for 1951–1965 and 2002–2016 for each species. We calculated the temporal change of TRP and RTRP for the six species and for all species across all sites using a 15 year moving window from 1951 to 2016, and for each window, a minimum of 7 year date of leaf-out was required. Ordinary least squares (OLS) and reduced major axis (RMA) regressions were applied to determine the temporal changes of the TRP and RTRP (Figure S2). The OLS and RMA methods produced similar results, and we only reported the results based on the OLS in the text for clarity sake.
 (1)
(1)- Linear function. GDD accumulated when the mean daily temperature was above a temperature threshold of 5°C:
 (2)
(2)- Piecewise function. GDD was a linear function of daily temperature when the temperature was between 5 and 15°C and had fixed units when mean daily temperature was >15°C:
 (3)
(3)- Sigmoidal function. GDD during TRP, that is, from LTRP to LO, was calculated using a sigmoidal model:
 (4)
(4)3 RESULTS
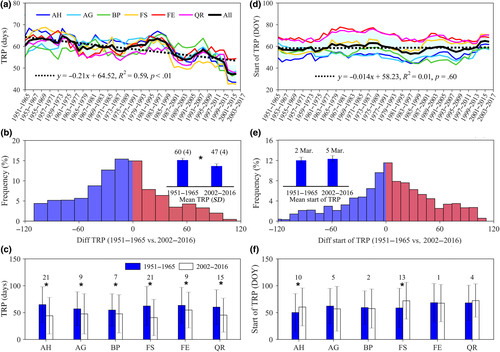
We found that the duration of the TRP for leaf-out date significantly shortened by 2.1 days per decade (R2 = 0.59, p < .01; Figure 1a), on average over the entire period 1951–2016 and across all six study species. Comparing the first to the last time window, the length of TRP was significantly reduced by 13 days (t = −12.307, df = 1,550, p < .001) from 1951–1965 (60 ± 4 days) to 2002–2016 (47 ± 4 days), on average across the six species (Figure 1b) and this reduction was observed in all species (Figure 1c).

The start date of the TRP, in contrast, did not vary significantly (R2 = 0.01, p = .60; Figure 1d) over the study period when averaged over all species. However, A. hippocastanum (AH) and F. sylvatica (FS) did exhibit small but statistically significant delays in the start of the TRP (Figure 1e,f). Averaged across all species, the start date of the TRP occurred around March 2–5 (corresponding to the day of the year: DOY = 61–64; Figure 1e). We also estimated the changes of leaf-out date over the study period, and found that the timing of leaf-out date advanced significantly for each species over the past six decades. Across all species, the mean leaf-out dates advanced by 10 ± 3 days, from May 1 (DOY: 121) for 1951–1965 to April 21 (DOY: 111) for 2002–2016 (Figure S4), suggesting that the reduced TRP was mainly related to the advanced leaf-out dates and not to delayed TRP start dates.
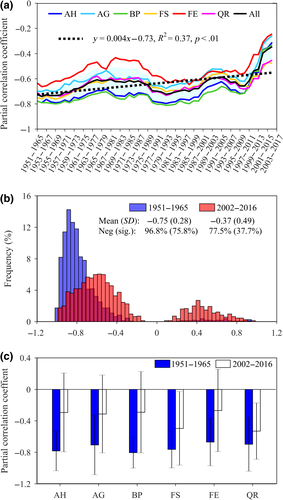
We also analyzed how the partial correlation coefficient between temperature during the TRP and the leaf-out date varied during the study period (RTRP), and found that the RTRP significantly decreased (p < .01) for all species from 1951 to 2016 (Figure 2a). To further test the robustness of this result, a 10 year moving window was used and produced similar results (Figure S5). Specifically, the RTRP significantly decreased (t = 25.931, df = 1,550, p < .001) from 1951–1965 (0.75 ± 0.28, 96.8% negative correlations, from which 75.8% were significant) to 2002–2016 (0.37 ± 0.49, 77.5% negative correlations, from which only 37.7% were significant) across the six species (Figure 2b), and for each species (Figure 2c). Note that >22% of the RTRP for 2002–2016 were positive with the corresponding length of the TRP varying between 15 and 120 days (Figure S6). The positive correlations may be artificial and related to the gradual increase in photoperiod effect for leaf-out under warming conditions (Fu, Piao, et al., 2019), and thus, warming would not necessarily result in an earlier leaf-out.

4 DISCUSSION
Consistent with previous studies (Fu, Piao, et al., 2015; Fu, Zhao, et al., 2015; Menzel et al., 2006), we found that the timing of leaf-out was significantly advanced, but interestingly, the temperature control of leaf-out date variation has significantly weakened, with a lower temperature correlation coefficient and a shorter temperature relevant period for 1951–2016. We propose three mutually nonexclusive hypotheses to account for these phenomena: (a) trees may be adapting to the increasing variation in spring temperature by reducing their temperature control and TRP; (b) the rapid increase in spring temperature fulfills the heat requirement faster and sequentially shortens the TRP; and (c) the effect of photoperiod on leaf-out development may gradually increase with the advance of leaf-out dates (i.e., that leaf-out date occurs at progressively shorter photoperiods), accompanying the reduced temperature control over leaf-out date variation during the TRP.
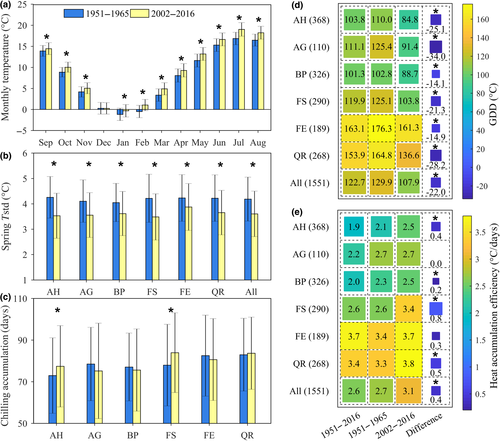
A recent study has found that the control of spring temperature on leaf-out reduced with larger interannual temperature variation (Wang et al., 2014), which also could be related to the reducing TRP length (Gauzere et al., 2017). We therefore calculated the mean monthly temperatures and their variation (defined as 1 SD). Between 1951–1965 and 2002–2016, the monthly temperatures in our study area increased significantly (p < .05) in all months between September and May, except for December (Figure 3a). However, the variation in monthly temperatures decreased for all species (Figure 3b), suggesting that in our study neither the shorter TRP nor the weaker temperature control of leaf-out date could be explained by an increasing variability of spring temperatures.

Our second hypothesis concerned the warming-induced acceleration of the physiological processes underlying leaf-out phenology. The warming winter and earlier spring (Figure 3a) were expected to affect the chilling accumulation and thus delay the start of the TRP. We therefore calculated the accumulated chilling as the number of days when mean daily temperature was between 0 and 8°C from September 1 of the previous year to the TRP start date (see Section 2) and found that on average across all species, it did not vary significantly between 1951–1965 and 2002–2016 (Figure 3c). This insignificant change in chilling accumulation in the study area may therefore explain the consistent TRP start date over time. However, at species level, two species did exhibit statistically significantly increased chilling accumulation: FS and AH, exactly the two species for which also the start date of the TRP was delayed. We can only speculate about why these two species apparently exhibited increased chilling requirement and a later start of the TRP. One explanation may be that these two species are experiencing greater control by photoperiod. In this case, the delayed start of the TRP would induce an artificial overestimation of the accumulated chilling (which we summed until the start of the TRP, while in reality, the chilling requirement may have been fulfilled already earlier). We therefore do not put too much weight on the apparent increase in chilling accumulation in these two species.
The heating requirement was calculated as daily thermal units (see Section 2). Surprisingly, the heating requirement for leaf-out was neither constant, nor higher, but was significantly lower for each of the six species (Figure 3d), even though chilling accumulation did not change and photoperiod reduced during the study period. We tested the robustness of this result by applying various methods for estimating daily heat accumulation, which all produced similar results, for example, using a linear (Figure 3d), a piecewise (Figure S3a), or a sigmoid (Figure S3b) function of daily temperature. The apparent lower heat accumulation may be related to the fact that air pollution has strongly declined in Europe, resulting in more clear sky days since the 1980s (Sanchez-Lorenzo et al., 2015). More clear sky days can increase both air and meristem temperature, but the potential increment of meristem temperature is much greater than that of air temperature when measured in a standard way under a Stevenson solar radiation shield (Savvides, Ieperen, Dieleman, & Marcelis, 2013). Therefore, more clear sky conditions may fulfil the meristem temperature-based heat requirement for leaf-out, while the air temperature-based heat requirement would apparently decrease. This idea is corroborated by the observation that the efficiency of heat accumulation (heat unit accumulation per day during the TRP) has significantly increased by 14.8%, despite the shortening photoperiod. Heat accumulation increased from 2.7 heat units per day during the period 1951–1965 to 3.1 unit during the period 2002–2016 (Figure 3e), suggesting that either other environmental cues are codetermining the date of leaf-out, likely by increasing the heat accumulation efficiency, or that air temperatures are not ideal to calculate heat accumulation for spring phenology.
Recent studies have reported complex interactive effects between temperature and photoperiod on leaf-out phenology (Flynn & Wolkovich, 2018; Richardson et al., 2018), and that short photoperiods may be used by trees as a signal to retard bud development in order to protect the trees from late frost damage (Fu, Piao, et al., 2019), although this protective mechanism does not suffice to sufficiently delay leaf-out date (Liu et al., 2018). In support of a stronger control of other environmental factors, in our study, the partial correlation coefficient between leaf-out date and temperature significantly declined (Figure 2). In parallel, the partial correlation coefficient between leaf-out date and radiation sum during the TRP significantly increased over the period 1951–2016 (Figure S7), although this correlation coefficient remained smaller than those of the temperature–leaf-out date relation. If the control by photoperiod over leaf-out phenology had strengthened, we would expect a reduced temperature-induced variation of leaf-out dates. We thus quantified the temperature-related change of leaf-out date in 1951–1965 and 2002–2016 and indeed found a significantly declined temperature-induced leaf-out variation for each of the six species (Figure 4). These results suggest that short photoperiod buffered the timing of leaf-out date and gradually played a more important role as the climate warmed. However, direct evidence for the effect of photoperiod on leaf-out date variation could not be provided by the present study, and remains to be experimentally demonstrated for mature trees. Furthermore, reports of the interactions of photoperiod with chilling and heating are still inconsistent among studies (Flynn & Wolkovich, 2018; Körner & Basler, 2010; Laube et al., 2014; Richardson et al., 2018; Zohner et al., 2016; but see Fu, Zhang, et al., 2019), so that further manipulative experimental studies are needed to gain insights in the increasing role of photoperiod in the control of leaf-out phenology.

5 CONCLUSION AND IMPLICATIONS
Changes in spring phenology play an important role in the terrestrial carbon and water cycles (Peñuelas et al., 2009). We found a decrease in the spring temperature control on leaf-out timing concomitantly with a shortening TRP, which suggests that other controls over the leaf-out process, such as photoperiod, gradually increased in importance over the past six decades. There are limitations in the study. Firstly, the studied sites were distributed in temperate regions, mainly including two countries Germany and Austria. In these regions, it is likely that chilling is still sufficient and do not limit the GDD requirement, as suggested by a TRP start that did not change with climate warming. Nevertheless, chilling might become insufficient toward warmer climates in the south of Europe, potentially increasing the amount of GDD required for leaf-out. Phenological observations at other temperate regions are therefore necessary to better understand the impact of climate warming on the phenology of temperate trees over their whole distribution area. Besides the present study focused on six temperate tree species and how the temporal changes of TRP differ in different plant species, such as in grasslands and boreal trees, are still unclear. The second limitation is that our study used the trees from a phenology network, and the differences in phenological response between phenology network and natural forest are also unclear and need further investigation.
Our results also suggest that future ecological consequences associated with advanced spring phenology, such as increased carbon update (Keenan et al., 2014) and evapotranspiration (ET, defined as a sum of plant transpiration, soil evaporation, and canopy interception; Kim et al., 2018), might be overestimated if current temperature responses were linearly extrapolated. Our analysis also revealed that the start of the TRP has remained constant in the recent decades, suggesting that the chilling conditions are still sufficient under current climate in the study area. This implies that phenology modules in global land surface models might be reliable assuming a fixed TRP starting date at least for the temperate central Europe where chilling temperatures are still sufficient. Nevertheless, further climate warming could result in much warmer winters, leading to insufficient chilling conditions that could then delay the start of the TRP, especially in the warmer regions of species distribution ranges. This introduces uncertainty in predictions of how temperate-zone deciduous tree species will respond to further global warming. Field warming experiments are therefore urgently needed to test the validity of our results under future conditions and to gain more mechanistic insight in the underlying mechanisms controlling leaf-out phenology.
ACKNOWLEDGEMENTS
This study was supported by the General program of National Natural Science Foundation of China (No. 31770516), the National Key Research and Development Program of China (2017YFA06036001), and the 111 Project (B18006) and Fundamental Research Funds for the Central Universities (2018EYT05). Ivan A. Janssens and Josep Peñuelas acknowledge support from the European Research Council through Synergy grant ERC-2013-SyG-610028 “IMBALANCE-P.” Ivan A Janssens and Shilong Piao acknowledge financial support from the Belgian Science Policy (BELSPO ECOPROPHET project, contract SR/00/334). Ivan A. Janssens acknowledges support from the Research Council of the University of Antwerp (Methusalem). Constantin M. Zohner acknowledges support from the ETH Zurich Postdoctoral Fellowship Program and the Crowther Lab. The authors gratefully acknowledge all members of the PEP725 project for providing the phenological data.
AUTHOR CONTRIBUTIONS
Y.H.F. and X.J.G. contributed equally to this work. Y.H.F. designed the research and drafted the paper; X.J.G. performed the analysis and all authors contributed to the interpretation of the results and to the text.


