Understanding and predicting frost-induced tropical tree mortality patterns
Abstract
Extreme climatic and weather events are increasing in frequency and intensity across the world causing episodes of widespread tree mortality in many forested ecosystems. However, we have a limited understanding about which local factors influence tree mortality patterns, restricting our ability to predict tree mortality, especially within topographically complex tropical landscapes with a matrix of mature and secondary forests. We investigated the effects of two major local factors, topography and forest successional type, on climate-induced tropical tree mortality patterns using an observational and modeling approach. The northernmost Neotropical dry forest endured an unprecedented episode of frost-induced tree mortality after the historic February 2011 cold wave hit northwestern Mexico. In a moderately hilly landscape covering mature and secondary tropical dry forests, we surveyed 454 sites for the presence or absence of frost-induced tree mortality. In addition, across forty-eight 1 ha plots equally split into the two forest types, we examined 6,981 woody plants to estimate a frost-disturbance severity metric using the density of frost-killed trees. Elevation is the main factor modulating frost effects regardless of forest type. Higher occurrence probabilities of frost-induced tree mortality at lowland forests can be explained by the strong influence of elevation on temperature distribution since heavier cold air masses move downhill during advective frosts. Holding elevation constant, the probability of frost-induced tree mortality in mature forests was twice that of secondary forests but severity showed the opposite pattern, suggesting a cautious use of occurrence probabilities of tree mortality to infer severity of climate-driven disturbances. Extreme frost events, in addition to altering forest successional pathways and ecosystem services, likely maintain and could ultimately shift latitudinal and altitudinal range margins of Neotropical dry forests.
1 INTRODUCTION
The accelerated increase in global average temperature in the last decades has been recently linked to rapid changes in weather and climate patterns, including the rise of extreme events (Herring et al., 2018; IPCC, 2014). Extreme climatic/weather events (ECEs) are defined here as extreme climate-related disturbances that lead to extreme biological responses (i.e., forest die-off), which implies atypical ecosystem changes compared to those of historical records. For instance, severe heat waves and prolonged droughts have been reported as key drivers of widespread tree mortality episodes throughout the world (Allen, Breshears, & McDowell, 2015; Frank et al., 2015; Reichstein et al., 2013). Extensive tree mortality can trigger abrupt changes in forest composition, structure, and functioning since large amounts of biomass are hastily converted to necromass, altering forest carbon stocks (Anderegg et al., 2016; Frank et al., 2015; Lindroth et al., 2009) and successional pathways (Kreyling, Jentsch, & Beierkuhnlein, 2011). However, the effects of ECEs on forests can be modulated by topographic conditions, for example, by redistributing soil moisture during droughts (Hawthorne & Miniat, 2016), changing wind speed and direction during hurricanes (Lugo, 2008), or guiding the movement of air masses during cold waves (Snyder & de Melo-Abreu, 2005). The strong influence of topography on the effects of ECEs is not usually analyzed in detail, which limits our capacity to develop robust models to understand and predict forest tree mortality patterns at local and landscape scales.
Several studies on ECE-induced tree mortality have demonstrated the physiological processes (hydraulic failure and carbon starvation) underlying tree resistance to extreme drought and warmer temperatures (e.g., Adams et al., 2009; Choat et al., 2018; Martin-StPaul, Delzon, & Cochard, 2017; McDowell et al., 2018). Other studies have analyzed global patterns of extensive tree mortality in boreal and temperate regions (e.g., Anderegg, Kane, & Anderegg, 2013; van Mantgem et al., 2009; Peng et al., 2011). The effects of ECEs on tropical and subtropical forests have been less studied despite prolonged droughts affecting the Amazon Basin and much of Australia, and severe cold waves hitting China (Brando & Durigan, 2005; Hou et al., 2018; Nicholls, 2004). Certainly, global warming has directed more scientific attention to the disturbance effects of extreme droughts, heat waves, and floods (Schiermeier, 2018), while other types of ECEs such as severe frosts have received less recognition. Although globally fewer cold temperature extremes are projected for the coming decades, occasional cold winter extremes will continue to occur over some regions (IPCC, 2014). These rare extreme cold events can have a long-lasting effect on tropical forests dynamics because subzero temperatures are not usually expected at tropical latitudes. Recent studies suggest that recurrent frosts can reinforce boundaries between tropical savannas and forests in Brazil (Hoffmann et al., 2019) or between savannas and shrublands in South Africa (Muller, O'Connor, & Henschel, 2016). Extreme freezing events could be thus important for maintaining or reducing tropical and subtropical ecosystems sharp borders and range limits by inducing tree mortality in species with low frost resistance (e.g., Whitecross, Archibald, & Witkowski, 2012). Our limited knowledge about the effects of frost disturbance on tropical forests restricts our ability to accurately identify frost-prone areas, particularly at the landscape scale where forest management planning usually takes place.
A severe advective frost (i.e., related to a cold wave) will most likely induce plant damage and extensive tree mortality at lower elevations. This occurs because the normal pattern of decreasing temperature with elevation temporary reverses, and consequently, lower elevations become colder as the heavier cold air masses sink (Bannister, 2007; Muller et al., 2016; Snyder & de Melo-Abreu, 2005). For example, a severe frost in February 2011 linked to a historic cold wave that affected most of North America (NOAA, 2011a, 2011b), penetrated into subtropical northwestern Mexico, and triggered extensive damage to lowland agricultural valleys (Val Noris, 2013). The economic losses caused by this frost event prompted the Mexican federal government to declare a regional state of emergency (Secretaría de Gobernación, 2011). The same extreme weather event led to widespread tree mortality in the tropical dry forest (TDF) that reaches its northernmost distribution in northwestern Mexico. Although there are anecdotal mentions of rare severe winter storms, there are neither recent records of lasting freezing temperatures nor previous studies in this region documenting past episodes of forest die-off in mature or secondary TDFs. Before the February 2011 severe frost, tree mortality was low in this TDF ecosystem, with only 2% of dead individuals in mature and 5% in secondary forests (Álvarez-Yépiz, Martínez-Yrízar, Búrquez, & Lindquist, 2008). The higher background mortality in secondary forests is likely explained by the dominance of pioneer short-lived tree species (Álvarez-Yépiz et al., 2008; Bhaskar et al., 2018). Therefore, in addition to topography, forest type could partially explain patterns of frost-induced tree mortality, principally in highly dynamic tropical landscapes with a matrix of mature and secondary forest fragments.
In this paper, we investigate the effects of two key local factors, topography and forest type, on frost-induced tree mortality patterns using an observational and modeling approach. We fitted logistic models with presence/absence data to obtain the probabilities of occurrence of frost-induced tree mortality at the landscape level. Because of the key role of elevation on temperature redistribution during a frost event, we expect the probability of frost-induced tree mortality to be higher at lower elevations regardless of forest type, but everything else being equal (similar topographic conditions), secondary forests, with higher background mortality than mature forests, should be more prone to the effects of severe frosts. Additionally, we explore the relationship between the probabilities of occurrence of frost-induced tree mortality and frost-disturbance severity, measured as density of dead individuals, to examine if such probabilities can also be used to predict damage severity. We anticipate that our results will be useful for identifying frost-prone areas and increasing our understanding of ecosystem range limits, especially under ongoing land-use changes and novel future climates.
2 MATERIALS AND METHODS
2.1 Study area
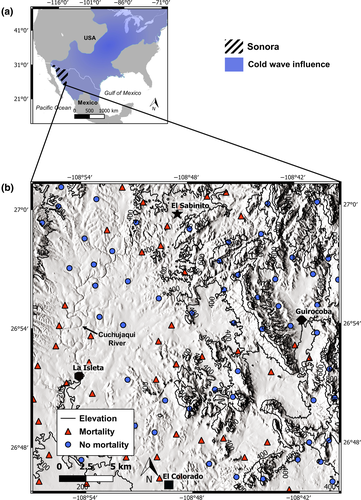
The study area of 83,230 ha (c. 29 × 29 km) is located between 27°00' to 26°48'N and 109°54' to 108°42'W in the Alamos municipality, Sonora, in northwestern Mexico (Figure 1a). Climate is classified as semiarid and warm (García, 2004) with a mean annual temperature of 23.1°C and a mean annual precipitation of 729 mm falling mainly between July and October (Minas Nuevas meteorological station, 480 m elevation, 7 km from the study area). This area is characterized by a hilly landscape with a general trend of increasing elevation from SW to NE. About 75% of the area lies below 450 m elevation and the rest mostly between 450 and 1,000 m with some hilltops occupying the highest elevations (Figure 1b). Geology is dominated by Tertiary rhyolite at higher elevations, and Neogene kneaded sandstone, Cretaceous granodiorite, and alluvial Quaternary soils in the lowlands (INEGI, 2003). The main vegetation type is TDF distributed mainly between 200 and 900 m elevation, oak woodlands are prevalent at higher elevations and thornscrub at lower and drier areas (Álvarez-Yépiz et al., 2017). The landscape is a matrix of mature and successional forests ≈30–40 years old, with agricultural and pasture lands occurring mostly on the lowlands (Álvarez-Yépiz et al., 2008).
2.2 Major steps for modeling frost-induced tree mortality
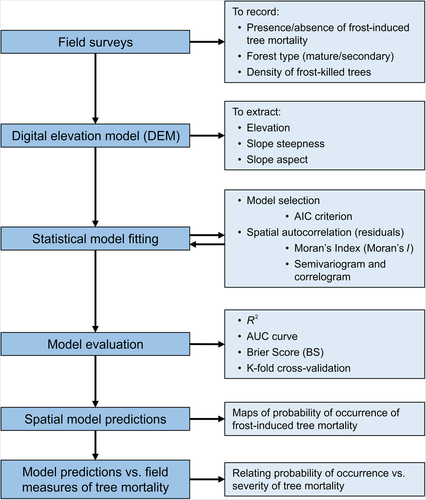
To model the effect of topography and forest type on the probability of occurrence of frost-induced tree mortality, we followed the steps outlined in Figure 2 and explained below.
2.3 Field surveys and data collection
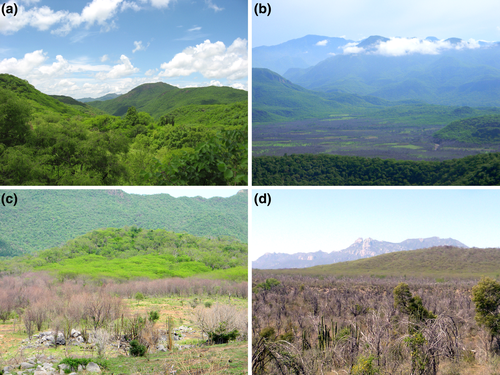
During field surveys performed between October 2014 and April 2016, the presence/absence of tree mortality (D) induced by the February 2011 frost was registered on a total of 454 TDF sites covering the main elevational zones and forest types in our study area (221 in mature and 233 in secondary forests of ≈30–40 years old). Geolocation of all sites was recorded using a handheld GPS receiver with an average accuracy of 4 m. At each site, the presence or absence of frost-killed trees was recorded using the percentage of dead trees above background tree mortality (>2% and >5% for mature and secondary forests, respectively, Álvarez-Yépiz et al., 2008). Background tree mortality can be identified by very scarce and randomly distributed dead trees (Álvarez-Yépiz et al., 2008), whereas frost-induced tree mortality is very patchy and generally much higher than background mortality (see Figure 3a–c). Other useful criteria for identifying sites with the presence of frost-induced tree mortality were apical resprouting of frost-damaged crowns (Figure 3d) and interviews with landowners.
Topographic variables for each site were derived from a digital elevation model (DEM). A DEM at a spatial resolution of 15 m was downloaded from the National Institute of Statistics and Geography at a scale of 1:50,000 (INEGI, 2013). We obtained elevation (El, m), slope steepness (SS, degrees), and aspect for each site using this DEM. Because aspect is a circular variable, we linearized it by creating two variables, “northness (Nn)” and “eastness (En)” as follows: Nn = cos(aspect); En = sin(aspect). Northness values near 1 indicate an aspect toward or close to north, values near −1 to south, and values near 0 to either east or west. Eastness is interpreted similarly, that is, values near 1 and −1 are east- and west-facing slopes, respectively, and values near 0 are either to north or south (Palmer, 1993). GIS analysis was performed using IDRISI Selva 17.0 and QGis 2.18.15.
2.4 Statistical model fitting and model selection
 (1)
(1)After we selected the top candidate models, we extracted each model residuals to test for spatial autocorrelation and, if any, to determine the minimum distance at which our sampling points (sites) should become spatially independent. First, we used Moran's Index (Moran's I) to test the null hypothesis of zero spatial autocorrelation on each model residuals using MoranI function in the ape package. Because we could not reject the null hypothesis of spatial independence in any of our top candidate models, we obtained the distance at which each model residuals lost spatial autocorrelation with correlogram analysis using the correlog function in the pgirmess package. Our analysis determined that spatial independence was lost at a minimum distance of 1,750 m among sampling sites—points (Figure S1). We therefore filtered our initial 454 data points and retained 101 meeting such distance requirement, which were spread out across our entire study area (Figure 1b). This subsample corresponded to 54 mature forest sites (22 presence/32 absence tree mortality) and 47 secondary forest sites (22 presence/25 absence), see Appendix S1. Using this reduced dataset, we fitted all models again and selected the top candidate models as described above. Moran's I tests confirmed the pattern of residuals’ spatial independence in each of our final top candidate models. All analyses were performed in R 3.5.2 (R Core Team, 2018).
2.5 Model evaluation
The predictive power of our final top candidate models was evaluated with (a) Area under the curve (AUC) using the performance function in the ROCR package; (b) Brier Score (BS) using the BrierScore function in the DescTools package; and (c) K-fold cross-validation with caret package. AUC tests model capacity to discriminate between sites with presence (1) and absence (0) of tree mortality, that is, proportion of 1’s and 0’s correctly identified by the model. The higher the AUC value, the better the model at predicting correctly 1’s as 1’s and 0’s as 0’s. An AUC > 0.70 is considered acceptable (Mandrekar, 2010; Zweig & Campbell, 1993). BS assesses how well a model predicts probabilities. BS output is between 0 and 1, where 0 (or near 0) indicates high model accuracy and 1 indicates the opposite (lack of accuracy). K-fold cross-validation assesses how well a model predicts new values of the target variable on different data subsets using a performance metric, in this case accuracy (proportion of true results predicted by the models). We used the most common variation of this test, the 10-fold cross-validation that splits the dataset into 10 segments or folds of equal size, one fold is held out for validation while the other K-1 folds are used to train the model and predict the target variable in our testing data. A mean accuracy value (CVA) is finally estimated for the 10 models generated for each training set. All analyses were performed in R 3.5.2 (R Core Team, 2018).
2.6 Spatial model predictions
The top four candidate models were used to obtain spatial predictions of the probability of occurrence of frost-induced tree mortality in our entire study area. Logistic model parameters are in logit values, so exp (logit) gives us the odds, which take values from 0 to ∞ and are monotonically related to probability values that are bounded between 0 and 1. Since model predicted values were in log-odds (y = log-odd(p)), an exponent function was used to convert them into probabilities (i.e., elogit/(1 + elogit)). The resulting raster layer shows the probability of occurrence of tree mortality as induced by the February 2011 frost event in our study area. Contour intervals of 200 m are shown on all maps. Operations with raster layers with a cell size of 15 × 15 m of the explanatory variables (El, FT, En) were performed in the raster calculator in QGIS 2.15.85.
2.7 Model predictions of occurrence versus severity of frost-induced tree mortality
For each plot (described below), we used ≈54 pixels to obtain average probabilities of frost-induced tree mortality using the predictions by the simplest and best model (M1). Detailed vegetation sampling was performed across 48 50 × 200 m plots in four distant subareas within our study area (Figure 1). These subareas are representative of the main elevation zones within our study area: Guirocoba (377–507 m), El Sabinito (330–443 m), El Colorado (267–430 m), and La Isleta (240–277 m; Figure 1b). Our systematic and balanced design included in each subarea an equal number of mature and secondary forest plots (six each) with different levels of frost-induced vegetation damage. On each plot, we established 10 transects of 50 × 2 m to examine the status of each woody individual and all of its stems with diameter at breast height (DBH at 1.3 m) >2.5 cm to avoid or minimize the inclusion of post-frost recruits. In all 480 transects, we recorded a total of 26,377 stems (22,193 live and 4,184 dead) corresponding to 6,981 individuals (5,745 live and 1,236 dead). We pooled our data per plot and calculated a metric of severity of woody vegetation damage as the percentage of dead individuals per plot. A severity metric using % of dead stems per plot followed the same pattern (data not shown). Finally, we excluded average background mortality (2% in mature and 5% in secondary forests, Álvarez-Yépiz et al., 2008) from our severity metric to approximate the amount of frost-killed trees on each plot. We used Pearson's r to measure the correlation between our severity values and occurrence probabilities of frost-induced tree mortality.
3 RESULTS
Four top candidate models were chosen based on our AIC model selection approach. These models retained El, FT, and En as predictors of the occurrence of frost-induced tree mortality (Table 1). Model complexity increases from M1 to M4, which is slightly penalized by AIC and related metrics (Table 1). All four models have a good capacity to discriminate between sites with the presence or absence of tree mortality (see AUC curves in Figure S2). Only El was statistically and highly significant in all four models (p < .001, Table 1). For predictive purposes, the simplest model (M1 with only El as predictor) is preferred since additional predictors do not greatly improve model fit or predictive power (Table 1). The effect of forest type and eastness is additive to the effect of elevation since they were only retained in models with El already present (Table 1). These other top candidate models (M2–M4), as selected with the AIC approach, can be important to identify and understand potential real effects of additional variables. Therefore, we used the four top candidate models to predict the probability of occurrence of frost-induced tree mortality in our study area.
| Models | Variables | α | β 1 | β 2 | β 3 | R 2 | AICc | wi | L(gi|x) | AUC | BS | CVA |
|---|---|---|---|---|---|---|---|---|---|---|---|---|
| M1 | El | 4.661 (1.43e−05) | −.014 (8.71e−06) | .57 | 104.19 | 0.20 | 1.00 | 0.861 | 0.171 | 0.744 | ||
| M2 | El + FT | 5.364 (1.11e−05) | −.015 (4.92e−06) | −.718 (0.164) | .58 | 104.31 | 0.19 | 0.94 | 0.864 | 0.167 | 0.744 | |
| M3 | El + En | 4.811 (1.17e−05) | −.015 (6.59e−05) | −.492 (0.182) | .59 | 104.48 | 0.17 | 0.87 | 0.880 | 0.166 | 0.769 | |
| M4 | El + En + FT | 5.524 (9.20e−06) | −.016 (3.75e−06) | −.504 (0.178) | −.731 (0.161) | .60 | 104.61 | 0.16 | 0.81 | 0.882 | 0.162 | 0.795 |
Note
- The binary response variable is the presence/absence of tree mortality (D); explanatory variables are elevation (El), forest type (FT—mature and secondary forest), and eastness (En). α and β1…βj are the parameters of each of the models (logit scale). The exact p value is shown below each model parameter.
- Abbreviations: AICc, Akaike's information criteria corrected for small sample sizes; AUC, area under the curve; BS, Brier Score; CVA, mean accuracy obtained with 10-fold cross-validation; L(gi|x), likelihood of model given data; R2 = pseudo R2; wi, Akaike's weight.
All four models show a very similar effect of elevation on tree mortality. The best model (M1) predicts higher probabilities of frost-induced tree mortality at lower areas (pd > 0.5 at El < 332 m, Figure 4). Model M1 indicates that per one unit increase in El, the odds of tree mortality occurrence “increase” by a multiplicative factor of 0.986 (i.e., e(−0.014), see Table 1), which means that the odds of frost-induced tree mortality actually decrease 1.4% (i.e., (0.986–1)*100) per each meter of elevation increment. Prediction with model M2 also shows that per one unit increase in El, the odds of tree mortality occurrence “increase” by a factor of 0.985 regardless of forest type (Table 1). However, holding elevation constant, the odds of tree mortality “increase” by a multiplicative factor of 0.487 for secondary forests compared to mature forests (Table 1), which means that odds of frost-induced tree mortality are 51.3% lower for secondary compared to mature forests. For secondary forests, M2 predicts pd > 0.5 at elevations lower than 307 m (Figure 5). For mature forests, this model predicts pd > 0.5 at elevations lower than 354 m (Figure 6).
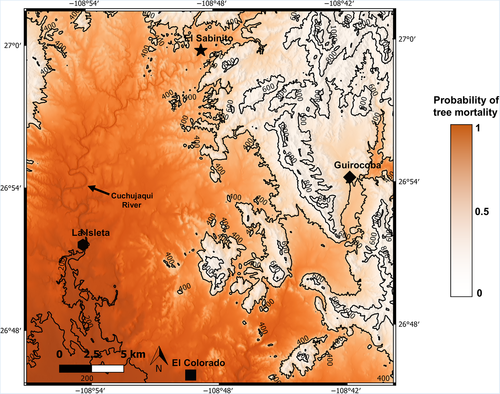
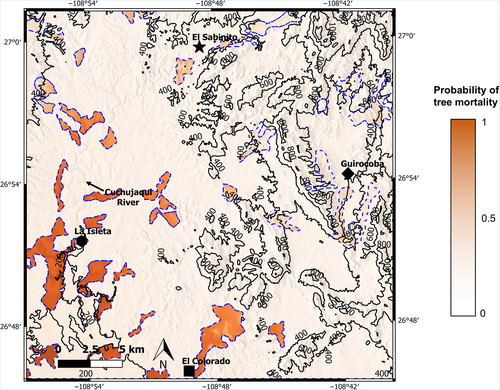
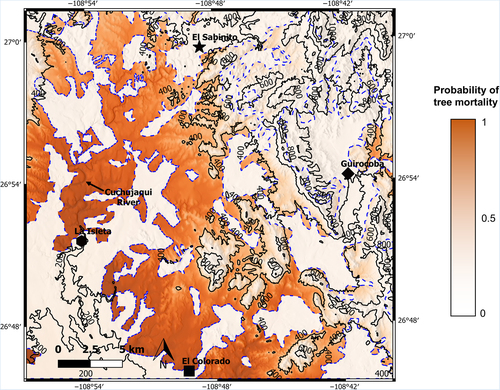
Models M3 and M4 perform very similar to previous models (Table 1). According to model M3, per one unit increase in El, the odds of occurrence of frost-induced tree mortality “increase” by a factor of 0.985, and per one unit increase in En, these odds “increase” by 0.611, which means that odds of occurrence of frost-induced tree mortality increase as elevation or eastness actually decreases. In this case, declining En means that forests oriented primarily to the west should have higher chances of experiencing tree mortality. Model M3 predicts higher pd values (pd > 0.5) below 353 m and overall spatial prediction looks very similar to M1 (Figure S3). Lastly, model M4 parameters are very similar to the other models (Table 1) and overall spatial prediction looks very similar to M2 (Figures S4 and S5). We found an elevation threshold of c. 600 m below which frost-induced tree mortality is likely to occur regardless of forest type or slope aspect (since pd > 0% at elevations <600 m and 0% at upper elevations; Figure S6). In this frost-prone zone, the probabilities of occurrence of frost-induced tree mortality are even higher at lower elevations (Figure S6).
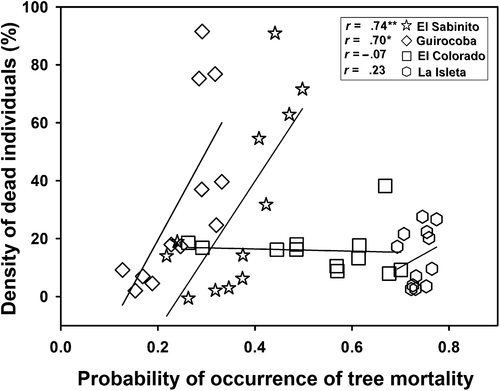
The probabilities of occurrence of frost-induced tree mortality obtained with our simplest top candidate model (M1—best model for predictive purposes) were related to our metric of severity of tree mortality obtained with field data. We found a significant positive correlation between the probabilities of frost-induced tree mortality and the density of dead individuals in the two subareas at higher elevations (i.e., El Sabinito and Guirocoba, p < .05, see Figure 7).
4 DISCUSSION
In this paper, we show how two major local factors, topography and forest type, influence climate-induced tree mortality patterns in a TDF at the landscape scale using an innovative approach combining observational and modeling techniques. Topography is recognized as a strong driver of several ecological patterns, for example, those related to forest structure and composition, floristic diversity, and soil fertility (Carpenter, 2005; Gallardo-Cruz, Pérez-García, & Meave, 2009; Jucker et al., 2018; Sinha et al., 2018). Previous studies in our study area also highlight the importance of topography, and mainly elevation, for structuring TDF vegetation and soil fertility gradients (e.g., Álvarez-Yépiz & Dovčiak, 2015; Álvarez-Yépiz et al., 2008, 2017). Additionally, elevation seems to be a key modulator of frost-induced tree mortality, helping us to predict where trees will most likely die—or where we will most likely find frost-killed trees—within the landscape. Lowland vegetation is in general more prone to freezing damage when advective frosts occur in agreement with recent studies in savannas in South Africa and Brazil (Hoffmann et al., 2019; Muller et al., 2016; Whitecross et al., 2012). This finding can be explained by the strong influence of elevation on temperature distribution at the regional and landscape level (Florinsky, Kulagina, & Meshalkina, 1994; Hummer-Miller, 1981; Matusick, Ruthrof, Brouwers, & Hardy, 2014), driving the movement of cold air masses downhill during an advective frost (Kalma, Laughlin, Caprio, & Hamer, 1992; Lindkvist & Lindqvist, 1997). Accordingly, the historic cold wave that caused the February 2011 severe frost entered our study area from the adjacent northeastern mountains and drained into the lowlands where cold air remained for at least three consecutive days, leading to the widespread frost-induced tree mortality episode. Infrequent extreme frosts could be thus important for maintaining the sharp latitudinal and altitudinal range margins of Neotropical dry forests, but more common (or rarer) events may reduce (or increase) this ecosystem's boundaries.
Holding elevation constant, our models identified two potentially interesting patterns in terms of the probability of occurrence of tree mortality: (a) forests on west-facing slopes are more likely to experience frost-induced tree mortality, and (b) mature forests are twice as likely to exhibit frost-induced tree mortality than secondary forests. The first pattern (a) could be explained by the lower soil moisture in west and southwestern slopes in the northern hemisphere (Gilliam, Hédl, Chudomelová, McCulley, & Nelson, 2014; Warren, 2008), which may lead to water-stressed plants that are more vulnerable to frost-induced damage. In addition, plants on west slopes (and on flat or concave terrains) may have been further exposed to freezing wind damage as the February 2011 cold wave moved from NE to SW (Lindkvist & Chen, 1999). The second pattern (b) is possibly related to the higher diversity of mature forests (Álvarez-Yépiz et al., 2008), which could produce a biodiversity sampling effect (Aarssen, 1997; Loreau, 1998), in this case on the probability of tree mortality because higher plant diversity increases the chances of encountering species with low frost resistance. In our study area, two widespread native legume tree species were the most affected by the extreme frost: Acacia cochliacantha Humb. and Bonpl. ex Willd. and Lysiloma divaricatum (Jacq.) J.F. Macbr. Interestingly, secondary forests are usually mono-dominated by A. cochliacantha and often times co-dominated by L. divaricatum. These species are also common in the more diverse mature forests but A. cochliacantha occurs in much lower densities (Álvarez-Yépiz et al., 2008). A detailed floristic analysis should reveal the identity of frost-resistant species that could be used for restoring degraded areas likely prone to future frost disturbances.
Severity of tree mortality after the frost, measured as percentage of dead woody individuals, was higher in secondary forests (29%) than in mature forests (14%). Clearly, these rates are much higher than pre-frost tree mortality (5% and 2% in secondary and mature forests, respectively, Álvarez-Yépiz et al., 2008). Excluding background mortality, 24% of dead individuals can be accounted for by the severe frost in secondary forests, twice than in mature forests. This severity pattern is contrary to the expected based on occurrence probabilities of frost-induced tree mortality and could be explained by the differing abundance of frost-sensitive species in mature and secondary forests. Remarkably, the 2011 frost pushed tree mortality to an average of 22% across all 48 plots where we performed detailed surveys and up to 95% in some secondary forest plots. These results suggest the extreme frost event most likely changed some forest fragments from a carbon sink to a carbon source and altered the ecological dynamics of mature and recovery trajectories of secondary forests. Because extreme disturbance events related to climate are becoming part of the disturbance regime of many different forest ecosystems (e.g., He et al., 2018; Herrero & Zamora, 2014; Saunders et al., 2014), we need to increase our understanding of the possibly different forest recovery pathways or alternative ecosystem states following these disturbances (Álvarez-Yépiz, Martínez-Yrízar, & Fredericksen, 2018). A network of permanent monitoring plots spread across an elevation gradient might be needed to examine the effects of disturbance severity on the ability of mature and secondary TDF to recover, and to enhance our understanding of the role of future climate extremes on long-term ecological patterns.
Our logistic models work well at predicting tree mortality occurrence, as suggested by our different metrics for evaluating model performance, but these models do not necessarily predict frost-disturbance severity. We found a positive relationship between the probabilities of occurrence of tree mortality and the density of frost-killed trees in two subareas sampled at upper elevations that have a concave shape (El Sabinito and Guirocoba). However, this pattern did not hold at elevations below ≈332 m, where the other two sampled subareas are mostly located and which do not have a concave shape. Terrain concavity may create a temporary cold air trap increasing disturbance severity (Lindkvist & Chen, 1999), especially in forests where frost-induced tree mortality is likely to occur (i.e., in our study area at elevations <600 m). This conclusion is supported by our severity values that decreased at lower elevation (<~332 m), increased at mid elevation (332–600 m), and were negligible at upper elevation (>600 m, as predicted by our models and confirmed by our field observations). Certainly, probability values predicted by logistic models and scalar values of density of dead individuals measure dissimilar aspects of tree mortality, that is, presence/absence versus severity. Therefore, different biophysical factors may be involved in the probability of occurrence versus severity of tree mortality. In order to better understand frost-disturbance severity patterns, and in addition to the analysis of the abundance of frost-sensitive species, future studies should analyze other predictors that account for terrain complexity such as slope shape (e.g., convex vs. concave).
The February 2011 extreme frost induced an extreme ecosystem response that can be confirmed by our severity metric and may be explained considering five key characteristics of the disturbance regime of our study area. (a) Frequency: The last reported extreme frost events date back to 1937 (−1°C; Turnage & Hinckley, 1938), 1952 (−9°C) and 1956 (−10°C). These three events lasted less than 24 hr (San Bernardo, Sonora meteorological station). Thus, before 2011, our studied forest had not experienced a similar prolonged severe frost for at least 50 years. (b) Severity: There are no previous reports of an episode of extensive tree mortality as the one observed after the February 2011 frost, and the 30–40 years old trees killed by this frost confirm that at least in that period, no other similar severe frost had occurred. (c) Timing: Dry conditions prevailed 2 years before and several years after the 2011 frost since annual precipitation between 2009 and 2014 remained consistently lower (on average 20%) than the long-term mean (729 mm). These drier than normal conditions likely combined with the effects of the extreme frost to make at least some trees more vulnerable to embolism and death. (d) Intensity: temperatures during the 2011 freezing event dropped to −6.5°C, low enough to trigger mortality of tropical trees. (e) Duration: below zero temperatures lasted for at least three consecutive days with no precedent in our study area, and these freezing temperatures lasted up to seven consecutive days in more northern mountainous areas.
In conclusion, a very atypical combination of duration, intensity, and timing of the extreme frost may have conjunctly led to the widespread tree mortality episode in our study area with topography, and secondarily forest type, modulating the effects of such extreme event across the TDF landscape. Our study increases our understanding of the different vulnerabilities of lowland (<600 m) versus upland and of mature versus secondary tropical forests to extreme events. Extreme frost events likely maintain and could ultimately shift the altitudinal and latitudinal range margins of Neotropical dry forests.
ACKNOWLEDGEMENTS
This work is part of the doctoral research of A. Bojórquez who acknowledges Posgrado en Ciencias Biológicas for academic support during his studies at Universidad Nacional Autónoma de Mexico and Consejo Nacional de Ciencia y Tecnología for a scholarship (#270082). This work was financially supported through a grant by PAPIIT-DGAPA, UNAM (#IN207315) awarded to AMY and grants by CONACYT (RETROSECE project #36971) and PROFAPI-ITSON awarded to JCAY. Enriquena Bustamante Ortega provided technical support. We thank Diego Ramos, Jenny Livier, Mirsa Bojorquez, Ricardo Felix, Ana Rosita Villegas, Adriana Quintanilla, Alejandro Grajeda, Andrés Yépiz, Felix García (NCI), and Sra. Eduwiges Yépiz for field assistance and to landowners for granting us permission to perform our fieldwork. Sierra de Alamos Río Cuchujaqui Biosphere Reserve and Nature and Culture International (NCI Mexico) staff provided facilities and logistical support. This study complies with current laws of Mexico. Two anonymous reviewers provided valuable feedback on an earlier version of this manuscript.


