Rapid climate-driven loss of breeding habitat for Arctic migratory birds
Abstract
Millions of birds migrate to and from the Arctic each year, but rapid climate change in the High North could strongly affect where species are able to breed, disrupting migratory connections globally. We modelled the climatically suitable breeding conditions of 24 Arctic specialist shorebirds and projected them to 2070 and to the mid-Holocene climatic optimum, the world's last major warming event ~6000 years ago. We show that climatically suitable breeding conditions could shift, contract and decline over the next 70 years, with 66–83% of species losing the majority of currently suitable area. This exceeds, in rate and magnitude, the impact of the mid-Holocene climatic optimum. Suitable climatic conditions are predicted to decline acutely in the most species rich region, Beringia (western Alaska and eastern Russia), and become concentrated in the Eurasian and Canadian Arctic islands. These predicted spatial shifts of breeding grounds could affect the species composition of the world's major flyways. Encouragingly, protected area coverage of current and future climatically suitable breeding conditions generally meets target levels; however, there is a lack of protected areas within the Canadian Arctic where resource exploitation is a growing threat. Given that already there are rapid declines of many populations of Arctic migratory birds, our results emphasize the urgency of mitigating climate change and protecting Arctic biodiversity.
Introduction
The impacts of climate change on migratory species can be profound and diverse, leading to shifts in the spatial distribution of suitable habitat as well as changes in migratory timing (Robinson et al., 2009). While impacts associated with migratory timing are relatively well studied (Møller et al., 2008; McKinnon et al., 2013; Kölzsch et al., 2015), the consequences of climate change for the spatial distribution of species at different stages of their migratory cycle remain poorly understood. Globally, many long distance migratory birds follow traditional routes that connect northern breeding grounds with southern nonbreeding areas and these have been broadly grouped into eight global flyways (Hötker et al., 1998).
High northern latitudes are experiencing climate change at an intensity of over twice the global average (Collins et al., 2013), meaning species that migrate to the far north may be especially affected by climate change at their breeding grounds. Most species are expected to respond by shifting distributions, often towards poles or to higher elevations (Parmesan, 2006); however, this means shifts in northern breeding distributions could soon be constrained by the Arctic coastline. Northward shifts are likely to be driven by a number of factors including the ‘shrubification’ of tundra and northward expansion of predators and competitors (Post et al., 2009; Myers-Smith et al., 2011; Pearson et al., 2013). Distributions could also shift north-east or north-west due to the uneven arrangement of landmasses about the pole, which could prolong the migratory distance needed to reach suitable breeding habitat or decouple species from their current migratory routes.
Arctic breeding shorebirds undertake some of the longest known migratory journeys in the animal kingdom, with many travelling more than 20 000 km per year to escape the northern winter (Gill et al., 2009; Battley et al., 2012). Most populations follow well-defined migratory routes, making shorebirds an excellent group to investigate how climate change might impact breeding grounds, and the conservation actions that could be implemented to address these impacts (Piersma & Lindström, 2004; Piersma, 2007). Although there is substantial variation in migratory routes both within and among species, ‘flyways’ provide convenient conservation management units upon which policy frameworks have been built. For example, a number of significant international agreements are organized around flyways, such as the East Asian–Australasian Flyway Partnership (http://www.eaaflyway.net) and African Eurasian Migratory Bird Agreement (http://www.unep-aewa.org).
The present configuration of migratory routes taken by Arctic breeding shorebirds likely emerged only during the current interglacial cycle (Piersma, 2011) and warmer climates in the past, for example during the mid-Holocene climatic optimum (~6000 bp), have been associated with genetic bottlenecks in some Arctic breeding shorebirds (Wennerberg et al., 2002; Conklin et al., 2015). For example, genetic analysis suggests a very recent divergence among subspecies of red knot Calidris canutus, possibly due to bottlenecks at this time (Buehler & Baker, 2005; Buehler et al., 2006). Warming during the mid-Holocene occurred over many centuries and was spatially uneven (Renssen et al., 2009), in contrast, climate change occurring in the near future is expected to be more rapid and more uniform across the Arctic (IPCC, 2013).
These factors suggest that current climate change could induce more severe shifts and constrictions of shorebird breeding distributions in the Arctic than the mid-Holocene climatic optimum. For some populations, remaining suitable breeding habitat may shift towards an area in closer proximity to a different migratory flyway than the one they currently occupy. If this occurs, shorebirds can respond in two ways. First, they might remain in their original route but prolong their migratory journey to reach new habitat, incurring additional energetic costs and mortality risk. Second, they could switch to a new route in closer proximity to suitable breeding habitat. Either response seems likely to result in population declines in negatively affected flyways, meaning climate change may affect the structure of shorebird assemblages globally.
Shorebirds are among the most numerous and species rich taxa of Arctic waterbirds, but some flyway populations, especially those using the East Asian–Australasian Flyway, are declining (Clemens et al., 2016; Piersma et al., 2016), so understanding and mitigating threats is crucial for their long-term persistence. If the breeding distribution of species are to contract and shift, it is critical that habitat is protected from emerging threats in Arctic regions, as the increasing accessibility of the High North will open up new potential for resource extraction, prompt development of new sea routes and cause rising geopolitical tensions (Kullerud, 2011).
Here, we use ecological niche models (Pacifici et al., 2015) to estimate how anthropogenic climate change will impact the distribution of climatically suitable breeding conditions for 24 high Arctic breeding shorebirds. We compare this to models of the distribution of climatically suitable breeding conditions at the mid-Holocene climatic optimum, as having estimates of the severity of past warming helps to frame estimates of future warming. We consider how the species composition of the world's flyways might change, by analysing how the proportion of suitable breeding conditions distributed within each flyway will change for each species. Partitioning our results into flyways allows for management and conservation of breeding grounds in a way that makes sense regionally and aids managers in understanding how climate change might impact population numbers within routes. Finally, we assess how well existing protected areas represent current and predicted future climatically suitable breeding conditions.
Materials and methods
Occurrence records
Study species comprised migratory Arctic breeding shorebirds belonging to the families Scolopacidae and Charadriidae, chosen as those where (i) the majority of the breeding distribution is above the Arctic treeline, as defined by the National Snow and Ice Data Centre (https://nsidc.org/cryosphere/Arctic-meteorology/Arctic.html), (ii) breeding habitat is primarily restricted to Arctic tundra, as opposed to alpine tundra, and (iii) the species is a migrant that completely leaves its breeding grounds for part of the year. This yielded 24 species (Table 1); breeding information for selections was derived from Cramp & Simmons (1983), Sibley & Monroe (1990), Piersma & Wiersma (1996) and Piersma et al. (1996). These species comprise two of the three families, eight of 12 genera and 41% of shorebird species that have at least some of their breeding distribution in the Arctic or subarctic (CAFF, 2013). Occurrence records were collected from four sources: the Global Biodiversity Information Facility (GBIF), The International Breeding Conditions Survey on Arctic Birds (www.Arcticbirds.net), The Atlas of Breeding Waders in the Russian Arctic (Lappo et al., 2012), and, for occurrences in Greenland, the personal records of D. Boertmann. Any records where definite breeding activity was confirmed (e.g. nest occupancy, recently hatched young) were used, and for those where breeding status was unknown, we considered records gathered between 15 May and 30 June from 1950 to 2000 as acceptable for inclusion, providing they fell within published maps of the breeding distribution of each species (Cramp & Simmons, 1983; Sibley & Monroe, 1990; Piersma & Wiersma, 1996; Piersma et al., 1996). This range of years was chosen to match the years of the current climatic data used (see below). For most species, this resulted in a large number of locations, except for species with very narrow distributions (number of occurrence points for each species listed in Table S1); all species had good spatial coverage throughout their respective breeding ranges (Fig. S1).
| Mid-Holocene climatic optimum | 2070 RCP 4.5 | 2070 RCP 8.5 | |
|---|---|---|---|
| Black-bellied plover Pluvialis squatarola | 0.78 | 0.18 | 0.13 |
| American golden plover Pluvialis dominica | 0.84 | 0.63 | 0.36 |
| Pacific golden plover Pluvialis fulva | 0.85 | 0.04 | 0.01 |
| Bristle-thighed curlew Numenius tahitiensis | 0.90 | 1.22 | 0.58 |
| Hudsonian godwit Limosa haemastica | 1.10 | 4.61 | 5.80 |
| Ruddy turnstone Arenaria interpres | 0.62 | 0.17 | 0.19 |
| Red knot Calidris canutus | 0.87 | 0.12 | 0.05 |
| Sharp-tailed sandpiper Calidris acuminata | 1.22 | 0.44 | 0.21 |
| Stilt sandpiper Calidris himantopus | 0.87 | 0.02 | 0.00 |
| Curlew sandpiper Calidris ferruginea | 0.69 | 0.02 | 0.00 |
| Spoon-billed sandpiper Calidris pygmea | 0.66 | 0.46 | 0.31 |
| Red-necked stint Calidris ruficollis | 0.56 | 0.10 | 0.06 |
| Sanderling Calidris alba | 0.65 | 0.14 | 0.06 |
| Rock sandpiper Calidris ptilocnemis | 0.77 | 0.33 | 0.25 |
| Purple sandpiper Calidris maritima | 0.58 | 0.61 | 0.47 |
| Baird's sandpiper Calidris bairdii | 1.18 | 0.64 | 0.64 |
| Little stint Calidris minuta | 0.66 | 0.14 | 0.08 |
| White-rumped sandpiper Calidris fuscicollis | 0.82 | 0.12 | 0.05 |
| Buff-breasted sandpiper Calidris subruficollis | 1.06 | 0.52 | 0.48 |
| Pectoral sandpiper Calidris melanotos | 0.96 | 0.50 | 0.34 |
| Semipalmated sandpiper Calidris pusilla | 0.85 | 0.94 | 0.48 |
| Western sandpiper Calidris mauri | 1.01 | 1.90 | 1.83 |
| Long-billed dowitcher Limnodromus scolopaceus | 1.05 | 0.36 | 0.29 |
| Red phalarope Phalaropus fulicarius | 0.96 | 0.09 | 0.04 |
Environmental data
We projected future climatic conditions for all land north of 50°N. Climatic data were obtained from WorldClim (www.worldclim.org), and all nineteen bioclimatic variables available were used. This study did not aim to understand which variables were driving distributions, and so reducing the number of variables was not necessary; sensitivity analysis that used only the five most important and least correlated variables for each species found little impact on the results (Fig. S2). Models were constructed using current conditions (1950–2000) and projected to the mid-Holocene climatic optimum (~6000 ybp), and to the future (given by WorldClim for the range 2060–2080, hereafter referred to as 2070) at two emissions scenarios, Representative Concentration Pathway (RCP) 4.5, an optimistic scenario where emissions peak around 2040, and RCP 8.5, a pessimistic scenario where emissions continue to rise through the 21st century. Six Global Climate Models (GCMs) were used for past and future projections, and these were chosen to encompass the full range of variation in models in the multimodel ensemble CMIP5 that was released 2010–2014 (Taylor et al., 2012). According to the IPCC (Flato et al., 2013), models in the Arctic show most variability in projection of the temperature of the coldest quarter. Of all available models on WorldClim, we chose the one that predicted the coolest temperatures for this variable, an intermediate and the highest temperatures for this variable. In this way, the chosen models reflect a broad range of the predictions encapsulated in the CMIP5 models. This gave BCC-CSM1.1, CCSM4 and HadGEM2-ES for the mid-Holocene and ACCESS1.0, GFDL-CM3 and MIROC-ESM for both RCPs in the 2070 time period (Table S2). Data were interpolated to a spatial grain size of 10 × 10 km to reflect the approximate resolution of most of the distributional records and a scale at which climate, rather than microhabitat factors, is more likely to be limiting (Mackey & Lindenmayer, 2001).
In addition to the bioclimatic variables, we included the standard deviation of elevation as a predictor variable in the models because most shorebirds prefer to breed on vegetated flat tundra (Meltofte et al., 2007), and variation in topographic heterogeneity, even for a given set of climatic conditions, is likely to have a significant influence on distribution (Brown et al., 2007). Elevational variation was obtained by taking the finest scale elevation grid available from WorldClim, which is subdivided at 30 arc seconds, and calculating the standard deviation of these pixels within the 10 × 10 km grid cells. Distance to coastline was also included as a variable in our models, as many species prefer to breed in coastal areas (Lappo et al., 2012). Data for distance to coastline were taken from NASA's Ocean Biology Processing Group (http://oceancolor.gsfc.nasa.gov/cms/DOCS/DistFromCoast) and interpolated to give a mean value for each grid cell. To account for the possibility of species shifting to different elevations or distances from coast, we ran the models without these variables to determine their impact on model output. Although there were some minor differences in detail, the general pattern was essentially identical to the main model (Fig. S2). The Greenland icecap was masked out of all model outputs, both current and future, as it physically cannot recede substantially within the next 100 years, even under rapid warming (Robinson et al., 2012).
Ecological niche models
Models of the relationship between each species’ occurrences and climatic conditions were built using the niche modelling software maxent (Phillips & Dudík, 2008). This software has been shown to perform well, even with low sample sizes, and is designed to operate without data on true absences (Elith et al., 2006; Phillips & Dudík, 2008; Costa et al., 2010; Royle et al., 2012; Yackulic et al., 2013). We used targeted background sampling (Phillips et al., 2009) to account for sampling bias, drawing background points from all sampled locations in our database. Thus, the background and occurrence points have a similar pattern of sampling bias, minimizing its effect on the results.
We adjusted the regularization parameter within maxent to control how tightly the model fitted the given occurrence points and optimally tune the models (Anderson & Gonzalez, 2011; Radosavljevic & Anderson, 2014). To choose the best regularization parameter for each species, fivefold cross-validated models were run for 12 values of the regularization parameter at increasing intervals between 0.5 and 5 so as to select the one with the highest mean AUC (a measure of model performance) and lowest mean standard deviation. The performance of all models was evaluated using null model significance testing as described by Raes & ter Steege (2007), which estimates the probability that each model performed better than 100 null models. All models were found to significantly outperform the null expectation at P < 0.0001. Furthermore, model output of current distributions aligned remarkably well with expert range maps.
Future projections were constrained using a maximum dispersal distance of 3000 km, in line with observed distribution changes in Arctic breeding shorebirds in Russia over a 70-year period (Lappo, 2000). These buffers prevented the model predicting small amounts of climatically suitable breeding conditions on the other side of the planet from existing breeding areas, say predicting a jump from central Russia to Central Canada. It seems highly unlikely that such areas would be colonized within a few decades, especially without suitable habitat existing between the two regions. Results were rather insensitive to this constraint, and while ~70% of species were affected to some extent, the projections for only six species were constrained to less than half the study area. These species have very small ranges, migrating only in one route, suggesting high site fidelity. Model outputs were binary; that is, each grid cell was considered either ‘suitable’ or ‘unsuitable’ for a species, using the logistic threshold in maxent that balanced sensitivity and specificity. This threshold yielded a better fit between model and data than other thresholds. Results from the three GCMs in each scenario were combined into a ‘consensus output’, in which a grid cell was considered suitable if the results from two of three GCMs agreed.
Flyways
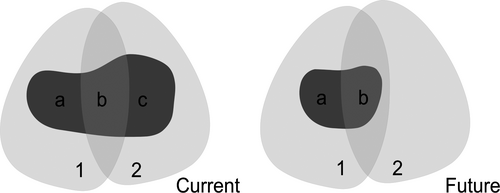
We calculated the proportion of total climatically suitable breeding conditions (CSBC) for each species in the breeding regions of the world's eight major flyways in both current and future scenarios. The definition and spatial extent of each of the eight flyways was taken from MacKinnon et al. (2012), all of which terminate in the Arctic and are used by a variety of shorebirds. Some flyways overlap on the Arctic breeding grounds, and we determined which flyways are currently known to be used by each species using the 5th edition of the Waterbird Population Estimates (WPE5, http://wpe.wetlands.org). We used a parsimonious approach to guide the allocation of current and future CSBC to flyways, such that any CSBC occurring in flyways that are currently known to be used by a species was allocated to those flyways first (Fig. 1).
Protected areas
Boundaries of all protected areas in the Arctic region were downloaded from www.protectedplanet.net (downloaded July, 2014). Of these, UNESCO Biosphere reserves were excluded, as they can include areas that have no formal protection (Coetzer et al., 2014). Protected areas vary markedly in the actual level of on-ground protection, with some areas currently subject to direct disturbance from oil, gas or mineral exploration and development, and other areas likely to be impacted by future development; thus, the degree of protection indicated here may be optimistic. To ascertain whether the protected area system adequately covered a species range, target proportions of protection were defined according to Rodrigues et al. (2004); that is that species with a geographic range size below 1000 km2 required 100% protection, those with a range size above 250 000 km2 required 10% protection, and species with intermediate geographic range size were logarithmically interpolated between these two thresholds.
Results
Our models predict that climatically suitable breeding conditions (CSBC) for Arctic shorebirds will decline dramatically by 2070, with three to five of 24 species losing more than 95% of their current CSBC and 16–20 losing at least 50% depending on the emissions scenario (RCP; Fig. 2). For some species, the consequences of imminent climate change appear dire: in both RCPs, little to no CSBC remained for stilt sandpiper Calidris himantopus, curlew sandpiper C. ferruginea and Pacific golden plover Pluvialis fulva (Table 1). Only two species gained CSBC in both future scenarios (Table 1): western sandpiper Calidris mauri and Hudsonian godwit Limosa haemastica.
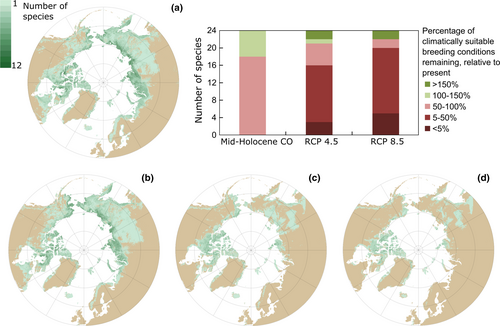
In contrast, conditions projected at the mid-Holocene were much less severe, with 18 species having less CSBC relative to current conditions, but none by more than 50% (Fig. 2). Three species had substantially more CSBC (i.e. >20%): sharp-tailed sandpiper Calidris acuminata, Baird's sandpiper C. bairdii and Hudsonian godwit, generally in expansions to the east or west.
Not only did future CSBC decline for most species, but shifts in the distribution of CSBC were also detected. Shifts were consistent between species, with CSBC almost always being lost in the Russian mainland and Beringia, which extends from Alaska to the Russian Far East. In contrast, CSBC in the northern Canadian Arctic islands, and to a lesser extent European and Russian islands, either increased, or decreased less severely than in Beringia (Fig. 2). This is a major change in the distribution of suitable breeding conditions for migratory shorebirds, in which CSBC decline in the Beringian/Russian flyways and increase in the Canadian/European flyways (Fig. 2). Most alarming is that shorebird species richness is currently highest in the Beringia region, yet this area is predicted to become unsuitable for many species by 2070 (Fig. 3; Henningsson & Alerstam, 2005; CAFF, 2013).
Relative to changes projected forward to 2070, differences in CSBC at the mid-Holocene were minor, and for many species, the smaller amounts of CSBC existed within current ranges, rather than in areas outside. No marked changes occurred in either Beringia or the Russian mainland.
Implications for flyways
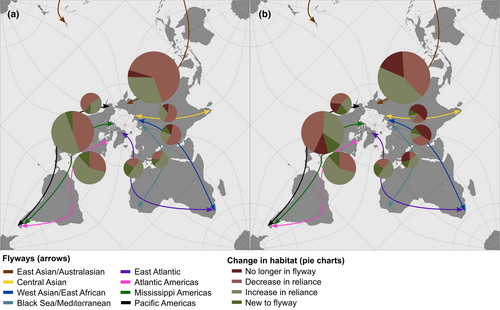
These changes in the distribution and extent of CSBC are likely to have implications for the population abundance and species composition of the world's eight flyways (Fig. 3). In flyways with breeding regions in Beringia and mainland Russia (Pacific American, East Asian–Australasian, Central Asian and West Asian/East African), 55–78% of species have a lower proportion of their overall CSBC falling within these flyways by 2070. Almost all species have some CSBC remaining at RCP 4.5, but at RCP 8.5 17–55% have essentially none left (dark red in Fig. 3). In contrast, the proportion of total CSBC in the flyways surrounding the Atlantic Ocean (Atlantic Americas, East Atlantic and Black Sea/Mediterranean) increased for most species in future scenarios, and all gained CSBC for new species (dark green colours in Fig. 3).
Protected areas
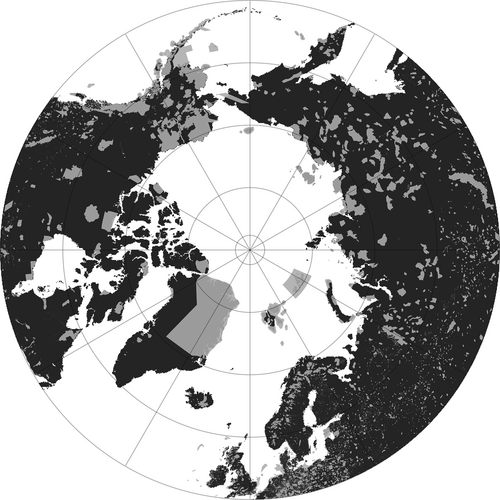
Encouragingly, many protected areas currently exist in the region (Fig. 4), such that the majority of study species meet standard protection targets (Table 2). However, there is an alarming lack of protected areas in the Canadian Arctic islands. Eight to nine species were underrepresented in each future scenario (Tables 2 and S5), either because CSBC was reduced wholesale to the Canadian Arctic islands or fragments of the Russian high Arctic. Given the stark reductions in CSBC shown here, it seems urgent that remaining habitat is protected, particularly in the predicted refugia.
| Current | RCP 4.5 | RCP 8.5 | |
|---|---|---|---|
| Percentage of CSBC protected | 21% (5–41%) | 27% (3–71%) | 36% (8–100%) |
| Number of species failing to meet protection target | 4 | 8 | 9 |
Discussion
Our results indicate that climate change could severely impact Arctic breeding migratory shorebirds, with contractions and shifts in the location of climatically suitable breeding conditions. Beringia was an important refuge during past glacial and interglacial periods due to its climatic stability (Miller et al., 2010) and currently carries the highest levels of endemism and richness but, along with the Russian mainland, is left with little to no climatically suitable breeding conditions in both future warming scenarios. The remaining suitable area for most species shifts and contracts, becoming almost exclusively limited to northerly islands, the vast majority in the Canadian Arctic.
Warmer conditions during the mid-Holocene climatic optimum are linked to population bottlenecks for some Arctic breeding shorebirds (Wennerberg et al., 2002; Buehler & Baker, 2005; Buehler et al., 2006; Conklin et al., 2015); yet our analysis shows that the difference between present conditions and those during the mid-Holocene is much smaller than that expected over the coming decades (Fig. 2). Species are likely to vary in how adaptable they are to the climatic changes (Saalfeld & Lanctot, 2015), and for less adaptable species in regions of more intense change, the probability of persisting in current locations seems low. Some shorebirds are opportunistic, hinting at an ability to shift as changing conditions dictate (Lappo, 1996; Saalfeld & Lanctot, 2015), while others show high breeding site fidelity and seem unlikely to adjust. For the former, it seems likely that populations will begin to shift to maintain optimum conditions in breeding locations.
These shifts could have major impacts on the global migratory routes taken by populations to reach nonbreeding areas. Shifting species will be faced with two main options. They could remain in current migratory routes, but fly extra distance to reach suitable breeding habitat, a scenario presumably associated with greater energetic cost and mortality risk (Bell, 2005; Lok et al., 2015), especially given that pressure on stopover habitats is reducing the ability for species to gain adequate fuel for the journey (Piersma et al., 2016). Alternatively, species could switch migratory route to one closer to suitable habitat. This is not unprecedented; recently, a population of ruffs Philomachus pugnax abruptly shifted their migratory route from western Europe to western Asia, apparently in response to habitat loss in staging areas (Rakhimberdiev et al., 2011; Verkuil et al., 2012a). It is possible that some populations could show abrupt switches such as these in response to climate change, especially those that rely on coasts and therefore cannot incrementally shift routes through continental regions, and that have conspecifics in adjacent routes.
For species with high site fidelity, populations in areas of unsuitable habitat may remain and decline in situ rather than shift, reducing population sizes due to decreased quality of habitat. Reduced survival due to changes in Arctic habitat are already being observed, with red knots Calidris canutus experiencing body shrinkage due to malnutrition in years with early snow melt (van Gils et al., 2016). Regardless of whether populations are able to shift breeding grounds and extend migratory distance, switch migratory routes, or decline in situ, it appears likely that there will be marked reductions in shorebird abundances worldwide due to breeding habitat contraction. Undoubtedly, such changes will have consequences for the flyways in which populations migrate. Our results suggest these losses will be much greater in flyways emanating from Beringia and Eastern Russia, while in the Atlantic flyways climatically suitable conditions for species not presently within those flyways will begin to occur (Fig. 3). All changes were much less severe under a mitigation emissions scenario (RCP 4.5), rather than one in which emissions continue to rise through this century (RCP 8.5), underlining the importance of reductions in greenhouse gas emissions.
Over time, shorebird species have persisted through many glacial cycles, and therefore our results do not necessarily suggest that the worst affected species will be driven to extinction from climate change alone, but rather from the compounding effects of human threats along their entire migratory routes; habitat loss and disturbance have already caused severe declines in some cases (van Gils et al., 2006; Kirby et al., 2008; Verkuil et al., 2012b; Murray et al., 2014). Our study adds to a growing body of research indicating the importance of protecting migratory stop over sites for species (Iwamura et al., 2013, 2014; Nicol et al., 2015; Piersma et al., 2016). If individuals fly further to reach suitable breeding habitat, they must acquire enough energy to make the journey, so protection of stopover sites is vital. This is especially pertinent to the East Asian–Australasian flyway, which has high endemism, is projected in our models to have some of the most severe losses of suitable climatic habitat and is currently experiencing severe population declines for a number of species due to habitat loss in the Yellow Sea (Murray et al., 2014; Piersma et al., 2016).
Conserving Arctic biodiversity in the face of climate change will require decisive action to address the many threats arising in the High North (Kullerud, 2011) and now, more than ever, protected areas are needed to conserve key sites for Arctic biodiversity (CAFF, 2013). The number of our study species that are adequately protected currently and in the future is encouraging; however, the lack of protected areas in the Canadian Arctic is cause for concern. Our models suggest that the Canadian Arctic will be a cool refugium for many shorebird species, meaning it is likely to also be important for other high Arctic species; if protected areas are not implemented, species will be left vulnerable to threat.
Our approach yields estimates of the distribution of suitable climates for Arctic breeding shorebirds. Although climate is known to be a key factor influencing species’ distributions (Huntley & Webb, 1989; Davis & Shaw, 2001; Lister & Stuart, 2008), including those of shorebirds (Austin & Rehfisch, 2005; Maclean et al., 2008), it is not the sole determinant of a species’ distribution. It does, however, act as a proxy for a range of nonclimatic factors that are likely to contribute to northward range contractions. Tundra is becoming increasingly shrubby at lower latitudes (Myers-Smith et al., 2011, 2015; Pearson et al., 2013), reducing suitability for breeding birds (Boelman et al., 2015). Advancement of predators, such as red foxes Vulpes vulpes, into Arctic ecosystems (Killengreen et al., 2007; Post et al., 2009) and expansion of potential competitors, such as more temperate breeding shorebirds (Callaghan et al., 2004; Mustin et al., 2007), will increase predation and interspecific competitive pressure. Understanding the drivers of future distribution change in the Arctic is an important area for further research (Bennett et al., 2015).
Climate-driven impacts to Arctic ecosystems are underway. Recent studies have indicated imminent global changes to Arctic vegetation, caribou and marine fish distributions (Pearson et al., 2013; Yannic et al., 2014; Wisz et al., 2015), and regime shifts in marine benthos have already been recorded (Kortsch et al., 2012). Reduction in greenhouse gas emissions to slow and eventually arrest anthropogenic climate change is the first priority as options for managing such systematic ecological disruption are limited. Mitigation must be coupled with immediate protection of key refugia, especially those likely to experience intensifying pressure from resource exploitation and other emerging threats.
Acknowledgements
We thank Jasmine Lee, Hugh Possingham, Danielle Shanahan, Pavel Tomkovich, Marty Wauchope and three anonymous reviewers for comment and discussion, as well as Jeff Hanson, Emily Packer and Claire Runge for technical assistance. The work was funded through ARC Linkage Project LP150101059 and the ARC Centre of Excellence for Environmental Decisions. We acknowledge the World Climate Research Programme's Working Group on Coupled Modelling, which is responsible for CMIP, and we thank the climate modelling groups (Table S2) for making available their model output.


