Early signs of range disjunction of submountainous plant species: an unexplored consequence of future and contemporary climate changes
Abstract
Poleward and upward species range shifts are the most commonly anticipated and studied consequences of climate warming. However, these global responses to climate change obscure more complex distribution change patterns. We hypothesize that the spatial arrangement of mountain ranges and, consequently, climatic gradients in Europe, will result in range disjunctions. This hypothesis was investigated for submountainous forest plant species at two temporal and spatial scales: (i) under future climate change (between 1950–2000 and 2061–2080 periods) at the European scale and (ii) under contemporary climate change (between 1914–1987 and 1997–2013 periods) at the French scale. We selected 97 submountainous forest plant species occurring in France, among which distribution data across Europe are available for 25 species. By projecting future distribution changes for the 25 submountainous plant species across Europe, we demonstrated that range disjunction is a likely consequence of future climate change. To assess whether it is already taking place, we used a large forest vegetation-plot database covering the entire French territory over 100 years (1914–2013) and found an average decrease in frequency (−0.01 ± 0.004) in lowland areas for the 97 submountainous species – corresponding to a loss of 6% of their historical frequency – along with southward and upward range shifts, suggesting early signs of range disjunctions. Climate-induced range disjunctions should be considered more carefully since they could have dramatic consequences on population genetics and the ability of species to face future climate changes.
Introduction
Climate change is recognized as a major threat for biodiversity, potentially leading to species extinctions (Thomas et al., 2004) and, therefore, biodiversity loss (Thuiller et al., 2005). Climate-induced upward and poleward shifts in species distributions have been extensively reported (Parmesan & Yohe, 2003). Since the seminal paper by Grabherr et al. (1994) reporting an increase in species richness on mountain tops in Europe, evidence of mountain ecosystem responses to contemporary climate change has accumulated and a continent-wide thermophilization trend of mountain plant communities has been recently documented (Gottfried et al., 2012). Despite the large amount of reported range shifts for plant species across mountainous ecosystems worldwide, there is a lack of evidence for climate-induced range shifts in lowland areas (Lenoir & Svenning, 2015). This lack of reported results can either stem from a lag in biotic responses to climate change (Bertrand et al., 2011) or difficulties in understanding the multifaceted nature of species range shifts (e.g., Groom, 2013), or a lack of studies on the subject (Jump et al., 2009). Indeed, at a global scale, poleward and upward range shifts of species are expected and have been documented (Parmesan & Yohe, 2003), but these expectations are not necessarily true at smaller spatial scales with recent studies suggesting omnidirectional range shifts (Lenoir & Svenning, 2015). More than just leading to multidirectional range shifts (Pinsky et al., 2013; VanDerWal et al., 2013), complex interactions between changes in temperature and precipitation may have dramatic consequences on the spatial structure of species range in terms of connectivity, with range disjunctions being an expected outcome under current and future climate change.
Range disjunctions have been extensively studied in ecology (Raven, 1972), and the respective roles of species dispersal and environmental changes in these vicariant patterns have been debated for a long time (Rosen, 1978). More recently, range disjunctions as a result of habitat fragmentation due to contemporary land-use changes and its consequences on metapopulation and metacommunity dynamics has received increased attention (Young et al., 1996). The risk of population fragmentation and its potential consequences on biodiversity due to land-use changes has been extensively documented (Foley et al., 2005). However, and to our knowledge, climate-induced range disjunctions have only been predicted for fish in the Rocky Mountains (Rahel et al., 1996). This makes range disjunctions due to anthropogenic climate change particularly relevant and timely to investigate. Our aim is not just to illustrate that range disjunction is a likely outcome of future climate change in Europe. Instead, we propose to link these future predictions with the detection of early signs of range disjunctions under current climate change in France.
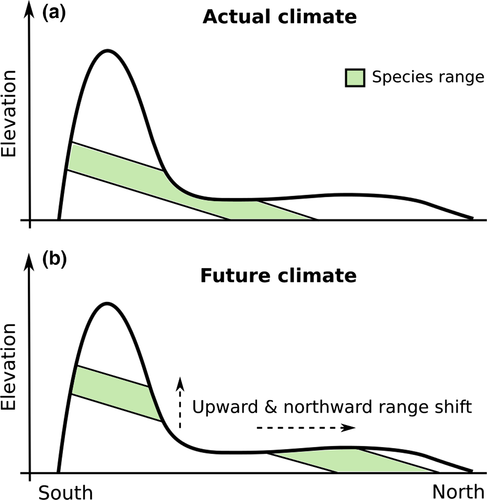
The spatial arrangement of gross topography across Europe is characterized by large mountain ranges that are globally oriented in an east-west direction (the Pyrenees, the Alps and the Carpathians) in the south, but in a north-south direction (the Scandes) in the north (Fig. 1a). These mountain ranges are notably separated by a rather contiguous biogeographic region known as ‘continental Europe’ (European Environment Agency, 2012) where the climate is warmer. This temperate region that crosses Europe from east to west can be roughly delineated by an interval of 6–10 °C in mean annual temperature and has the potential to act as a ‘climatic’ barrier that would constrain future range shifts of living biota as the climate warms (Fig. 1b). We assume that climate warming, by splitting this temperate region into two separate parts (southern and northern), can lead to range disjunctions for species whose temperature range falls into that interval and that are currently found in both temperate Europe and mountain ranges. This is typically the case of ‘submountainous species’, which may be present in mountainous areas as well as in the lowland areas of continental Europe (Fig. 2a). For instance, submountainous species with current distributions that are more or less contiguous between southern and northern Europe will probably split into northern populations restricted to northern Europe and southern populations restricted to mountain ranges in southern Europe (Fig. 2b).
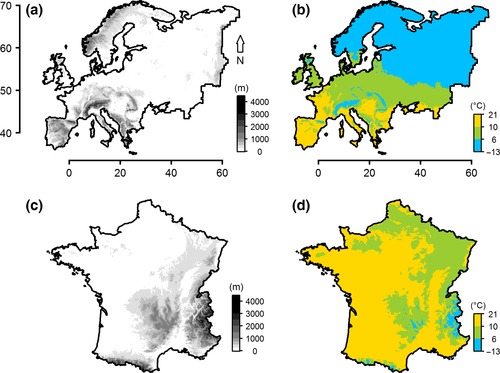
A close look at the French territory reveals that both temperate lowlands (i.e., the interval of 6–10 °C in mean annual temperature that characterizes temperate Europe; Fig. 1d) as well as mountainous regions in the south (i.e., the Pyrenees and the Alps, Fig. 1c) currently cover a substantial proportion of metropolitan France. This particular spatial arrangement of lowland areas dominating in northern France and mountainous regions chiefly located in the south of France results in locally colder areas in the south than in the north (Fig. 1d). Consequently, current and future climate warming should lead to southward and upward range shifts of submountainous species in metropolitan France, in particular. Such a spatial arrangement of lowland and mountainous areas makes France a relevant and representative study area given our study question involving the European scale.
We used a two-step analytical approach involving simulations and data from field observations. We first aimed to demonstrate that range disjunction is a likely outcome of future climate change for submountainous forest plant species at the European scale. We then used field observations to study recent changes in the distribution of these species in France and to detect early signs of range disjunctions as the climate warms.
More specifically, we tested the following hypotheses:
- Future climate change will lead to range disjunction of submountainous forest plant species in Europe and will separate southern populations restricted to mountain ranges in southern Europe from northern populations restricted to northern Europe.
- The frequency of submountainous forest plant species has decreased in lowland areas of temperate Europe but has either remained stable or has increased in mountainous areas.
- These differential changes in the frequency of submountainous forest plant species in lowland and mountainous areas in France have resulted in southward and upward shifts of their ranges.
Material and methods
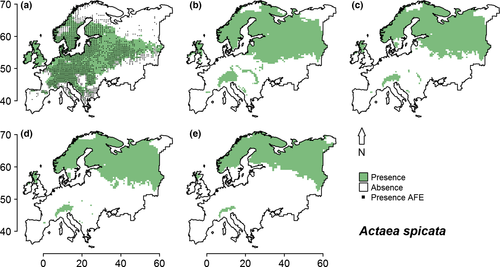
Submountainous plant species were defined here as species with an optimum (gradient value corresponding to the maximum probability of occurrence) in mean annual temperature ranging between 6 and 10 °C, and a range centroid located further north than 45°N. This ensured that these species had their optimum ecological requirement in the temperate region of Europe with their cold margins in mountain ranges and warm margins in thermophilic lowland areas (see Fig. 3a for an example). Because of that, submountainous plant species are especially prone to range disjunctions under current and future climate change. We further restricted our analyses to forest habitats because forests tend to buffer climatic fluctuations. Besides, forest habitats are less prone to human disturbances than nonforest habitats. The response of submountainous forest plant species to contemporary and future climate change was investigated at two spatial and temporal scales using species distribution models. First, future range shifts were assessed at the European scale using a simulation approach that compared species ranges during the periods 1950–2000 (baseline) and 2061–2080 (future). Second, observed and predicted trends in range shifts as well as abundance changes were compared using an empirical approach that assessed changes in species distributions across France between the periods 1914–1987 (historical) and 1997–2013 (recent). Finally, by focusing on the common set of species between the two approaches, we evaluated the likelihood of predicted future range shifts.
Floristic data at the European scale
Floristic data on the European distribution of submountainous forest plant species were extracted from the Atlas Flora Europaeae database (AFE; Kurtto et al., 2013). This atlas gives species status across Europe at a 50 × 50 km resolution (n = 4746 grid cells). Species were considered present in a grid cell when their status was recorded as ‘native occurrence’, and absent in all other cases. Native occurrence is recorded for a given grid cell of the AFE database when the species is considered to be native there, has been recorded as present before 1950, and there is no documented proof of local extinction since (Committee for Mapping the Flora of Europe, 2014). Grid cells from Iceland, Svalbard, the Canary Islands and the Balearic Islands were removed from subsequent analyses to simplify the maps produced by restricting their spatial extent. Grid cells for which no climatic data were available (n = 40) were also removed. A total of 4533 grid cells were finally retained to calibrate our models and predict future species distributions (Fig. S1).
Environmental data and future climate change at the European scale
Mean annual temperature and total amount of precipitation during the growing season (July to September) were extracted from the WorldClim database (Hijmans et al., 2005) at a resolution of 5 arc-minutes (approximately 6 km at 45°N) since this resolution made it possible to aggregate climatic values for each cell of the AFE database. Values of the period 1950–2000 were considered as the baseline (corresponding to the AFE's presence/absence data). Future climate data were extracted from the HadGEM2-ES global circulation model (Martin et al., 2011) for the period 2061–2080 under the four scenarios formalized by the IPCC: RCP 2.6; 4.5; 6.0 and 8.5 (IPCC, 2013) where RCP 2.6 corresponds to the lowest greenhouse gas concentration in the atmosphere by 2100 and RCP 4.5, 6.0 and 8.5 correspond to increasing concentrations. Soil pH was extracted from grids at a resolution of 1 km² from the SoilGrids1km database (Hengl et al., 2014). The mean pH (H2O) value at a depth of 10 cm was used to calibrate species distribution models. Environmental data were aggregated at the spatial resolution of the AFE grid.
Floristic data at the French scale
Floristic data inventoried in forests were extracted from three vegetation-plot databases: Sophy (Brisse et al., 1995), EcoPlant (Gégout et al., 2005) and the French National Forest Inventory (NFI; Robert et al., 2010), provided by the French National Geographic Institute (IGN). This database combination enabled us to compare historical and recent species distributions. Sophy is a compilation of phyto-sociological studies containing 32 461 forest plots inventoried between 1914 and 2000. EcoPlant is an ecological database with a focus on forest ecosystems and comprising 9028 plots inventoried from 1922 to 2011. Most of the vegetation plots from EcoPlant and Sophy have a surface area of 400 m² each. The NFI database contains 152 546 plots inventoried between 1991 and 2013 and uniformly distributed over the French forest network in a 1-km² grid. Floristic inventories were realized on a surface area of 700 m². All these databases together, 194 035 forest plots were surveyed between 1914 and 2013. Only plots surveyed during the growing season (April to October) and for which coordinates were available with a precision of <1 km were kept. This resulted in a subsample of 113 868 floristic plots. Data were extracted in species presence/absence and species’ names were homogenized according to the French Taxonomic Reference Base: TaxRef v6.0 (Gargominy et al., 2013). Only the continental area of France was considered in subsequent analyses (i.e. Corsica was excluded).
Data selection and the elimination of spatial bias
Plots involved in the analyses were nonpermanent. Consequently, pairs of historical and recent plots were generated to avoid biases due to differences in plot location between the two studied periods (Hijmans, 2011). Although it has been shown that changes in species richness, species composition and individual species frequency were robust to uncertainty of plot relocation (Kopecký & Macek, 2015), we assume here that spatially pairing historical and recent nonpermanent plots is an extreme case of resurveying historical plots with a large uncertainty on plot location. To limit uncertainty, pairs were created by iteratively selecting the geographically closest historical and recent plots among all possible pairing possibilities. The maximum difference in elevation and the distance between one historical plot and its closest recent one were set to 200 and 5000 m, respectively. This resulted in a selection of 11 210 pairs of plots (Fig. S2). The average distance and elevation difference between historical and recent plots were 1537 and 0 m, respectively. The median years of survey were 1977 and 2005 for the historical and recent periods, respectively.
Environmental data and observed climate change at the French scale
Like at the European scale, average values of mean annual temperature and total amount of precipitation during the growing season (July to September) for the periods 1961–1987 and 1997–2012 were extracted from grids at a resolution of 1 km². Historical climatic data were elaborated using monthly data provided by meteorological stations for the period 1961–1987. They were spatialized by using a climatic model that combined topographical and geographical variables to predict mean annual temperature and total amount of precipitation (Ninyerola et al., 2000; see Supplementary Materials in Bertrand et al. (2011) for a detailed method concerning temperature). Recent climatic data were calculated as the sum of historical values and differences between the two periods measured at meteorological stations. Differences in mean annual temperature and total amount of precipitation during the growing season were extracted and interpolated from 202 and 862 meteorological stations, respectively. Measurements extracted from meteorological stations indicated an average increase in mean annual temperature of 1.18 °C and an average increase in total amount of precipitation during the growing season of +12 mm across the French territory between the historical and recent periods (Fig. S3c, d). Bio-indicated soil pH (Coudun et al., 2006) was extracted for both historical and recent plots from a grid at a resolution of 1 km².
Modelling method
All analyses were performed in R 3.1.0 (R Core Team, 2014). We used generalized additive models (GAMs: Hastie & Tibshirani, 1986) to model species distributions at the 50 × 50 km resolution (AFE cell) and at a plot resolution at the European and French scales, respectively. Smoothing splines were limited to 3 degrees of freedom to limit overfitting issues. Distribution models used to investigate changes in species distributions at both the European and the French scale included mean annual temperature, sum of precipitations during summer (July, August and September) and soil pH. Models were retained (and species included in subsequent analyses) if the coefficients associated with each variable were highly significant (P < 10−3). Models were calibrated for each species using baseline and historical data across Europe and France, respectively. Baseline and historical as well as future and recent predictions were generated using corresponding climate values. Soil pH was considered stable over time at both the European and French scales. Optimums in mean annual temperature used to define submountainous species were derived from partial responses of species extracted from models calibrated with French historical data.
Models' quality was assessed by using a k-fold cross validation method (with k = 10). Calibration datasets (for France and Europe) were iteratively split into ten sliding random samples of 90% (calibration) and 10% (validation) of plots. In this way, each plot was used to calibrate and validate models. Models' quality was assessed by measuring the area under the curve (AUC; Swets, 1988) calculated on each validation sample generated. The 10 values of AUC calculated for each model were averaged in order to obtain a unique quality value for each species. In order to obtain spatially explicit changes in species ranges, presence probabilities computed by models were converted to presence/absence of species in each AFE grid cell by using the threshold that maximizes the sum of specificity and sensitivity (Liu et al., 2005). Model performance at the European scale was thus also assessed by calculating the true skills statistic (TSS: Allouche et al., 2006).
Species selection
To get reliable models (Coudun & Gégout, 2006) and ensure a precise assessment of species’ range shifts, only species with more than 50 occurrences at each time period (historical and recent) were selected from the French dataset. Among the 520 vascular species fulfilling this criterion, only 119 species had significant coefficients in the model, an AUC superior to 0.7 and an optimum in mean annual temperature ranging between 6 and 10 °C. Finally, 97 species had an historical centroid further north than 45°N (definition of temperate submountainous species). Among these 97 species selected and studied at the French scale, only 25 were available in the AFE database (data requested on the 24/06/2015) and thus studied at the European scale.
Simulation and assessment of range shifts
Latitudinal shifts of species were investigated at both the European and the French scales, whereas elevational shifts were only studied across France. Species’ range shifts were assessed by measuring changes in three range parameters: the range centroid, the southern/lower margin and the northern/higher margin. Range centroids were defined at both scales as the average location of species’ presences along the latitudinal/elevational gradients. Southern/lower and northern/higher range margins corresponded to the 10th and to the 90th percentiles of species’ presences along the latitudinal/elevational studied gradient, respectively. At the European scale, latitudinal shifts were based on species distribution model (SDM) predictions between the baseline and the future periods under the four RCP scenarios. At the French scale, latitudinal and elevational shifts between the historical and recent periods were based on both SDM predictions and empirical observations.
Predicted range centroids and margins were derived from predicted species occurrences, themselves generated by sampling the modelled probabilities of presence generated by each SDM according to a binomial distribution (Bertrand et al., 2012). Since the random sampling of species occurrences induced variability in the results, it was repeated 1000 times for each set of predicted probabilities of presence to generate 1000 range centroids and margins per time period. The 1000 range centroids and margins were then averaged for each time period before computing the difference in latitudinal position and in both latitudinal and elevational positions between the baseline and future periods at the European scale and between the historical and the recent periods at the French scale, respectively. Observed range centroids and margins were calculated from observed species occurrences in France during both the historical and recent periods. The observed latitudinal and elevational range shifts were then assessed by computing the differences in the observed latitudinal and elevational positions of both range centroids and margins between the historical and the recent periods.
Spatial analysis of future changes in species distributions at the European scale
Spatial patterns of future species distributions were investigated at the European scale at both the species level and at the level of the whole group of submountainous forest plant species in order to highlight general patterns of changes. Individual species ranges were mapped from model predictions for the baseline and future periods under the four RCPs. Patterns of distribution changes were analysed at the species level by describing the spatial evolution of their ranges and, especially, their split into northern and southern populations. They were also investigated at the level of the 25 studied species by calculating the number of species present in each AFE grid cell during both baseline and future periods. The analysis of changes in the number of present species between the two periods made it possible to investigate the potential spatial rearrangement of species distribution for the whole set of submountainous forest plant species studied.
Investigation of recent changes in species abundance in France
Future species range disjunctions across Europe would be indicated by a disappearance of species in lowland areas. Early signs of this trend were investigated by comparing recent changes in species frequency in lowlands and in mountainous areas in France. Mountainous areas (Fig. S2) were defined by combining climatic, geographic and topographic information (Lenoir et al., 2009). Changes in species prevalence were analysed in French lowland and mountainous areas by calculating and comparing historical and recent species frequencies (ratio of species occurrences to the number of plots). Among the 11 210 plot pairs available across metropolitan France, 4882 and 6328 plot pairs belong to lowland and mountainous areas, respectively.
Results
AUCs of models calibrated across Europe at the resolution of AFE cells ranged from 0.83 to 0.96 with an average value of 0.90 (n = 25). The TSSs of these models ranged from 0.54 to 0.84 with an average value of 0.68 (Table S1). AUCs of models calibrated across metropolitan France at plot resolution ranged from 0.70 to 0.93 (Table S2), with an average value of 0.80 (n = 97; only one species was discarded with an AUC < 0.70). For the subset of 25 species shared by both datasets, AUCs of models calibrated across metropolitan France ranged between 0.71 and 0.90, with an average value of 0.81.
Future changes in species distribution across Europe
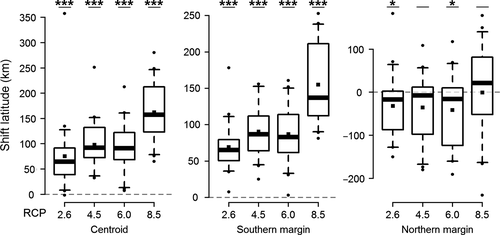
Predictions of future distribution changes across Europe for the 25 studied species showed poleward range shifts whose magnitude increased with increasing radiative forcing, according to the different RCP scenarios (Fig. 4 and Table S3). On average, species were predicted to significantly shift their range centroids by 75, 98, 92 and 162 km poleward under the RCP 2.6, 4.5, 6.0 and 8.5 scenarios, respectively (all P < 10−3; Mann-Whitney U test). Their southern margins were also predicted to shift significantly by 69, 91, 87 and 155 km poleward under the RCP 2.6, 4.5, 6.0 and 8.5 scenarios, respectively (all P < 10−3; Mann–Whitney U test). By contrast, their northern margins were predicted to shift southward by 32 km (Mann–Whitney U test; P < 0.05), 35 km (Mann–Whitney U test; P = 0.10), 41 km (Mann–Whitney U test; P < 0.05) and 1 km (Mann–Whitney U test; P = 0.75) under the RCP 2.6, 4.5, 6.0 and 8.5 scenarios, respectively.
Comparisons between the baseline and the future periods highlighted some trends, even if geographic patterns of changes differed depending on the species considered and the IPCC scenario (see Fig. 3 for an example and Fig. S4 for all other species). Under the RCP 2.6 scenario, the minimal scenario of greenhouse gas emissions, only Actaea spicata and Pinus sylvestris were predicted to have a disjunct range (with populations in southern mountain ranges distant from populations in northern Europe). Predictions generated under the RCP 4.5 and 6.0 scenarios were very similar and 11 species were predicted to have a disjunct range. Under the RCP 8.5 scenario, 12 out of the 25 studied species were predicted to have a disjunct range.
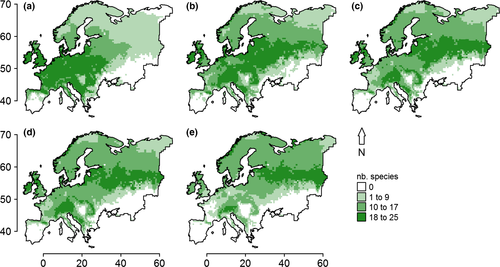
During the period 1950–2000, the maximum number of submountainous species in Europe was observed in the temperate region (Fig. 5a). Under the RCP 2.6, 4.5 and 6.0 scenarios, the number of submountainous species decreased in the south and in the west of Europe but increased in northern Europe (Fig. 5b-d). Under the RCP 8.5 scenario, most of the studied submountainous species had their ranges confined to the Alps in Southern Europe and to a latitudinal band ranging from 54 to 60°N spreading from the Baltic coast towards Siberia (Fig. 5e).
Recent changes in species frequency in France
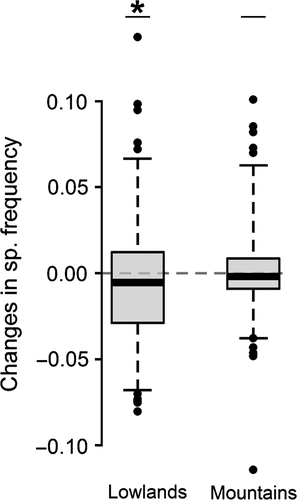
On average, the frequency of submountainous forest plant species decreased in the French lowlands between 1961–1987 and 1997–2013 (−0.01; Mann–Whitney U test; P < 0.05) but remained steady in mountainous areas (0.00; Mann–Whitney U test; P = 0.56) (Figs 6, S5 and Table S2). This decreasing trend in lowland areas differed from the stasis observed in mountainous areas (−0.01; Mann–Whitney U test; P < 10−2).
Species range shifts across France
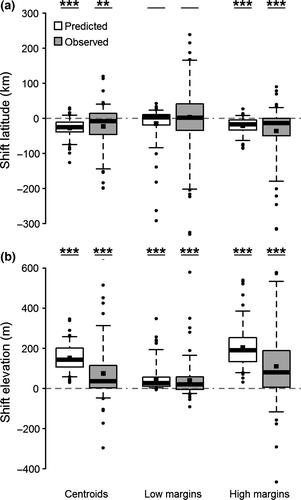
Regardless of the approach used (i.e., model predictions or field observations), submountainous forest plant species shifted their distribution southward and upward in France (Figs 7, S6 and Tables S2 and S4). Based on species distribution model (SDM) predictions, species shifted their range centroids 27 km southward (Mann–Whitney U test; P < 10−3) and 153 m upward (Mann–Whitney U test; P < 10−3) (Figs 7, S6 and Table S4). Only 10 of the 97 submountainous species studied were predicted to shift northward and none were predicted to shift downward. Based on field observations, submountainous species shifted their range centroids 23 km southward (Mann–Whitney U test; P < 10−2) and 75 m upward (Mann–Whitney U test; P < 10−3) (Figs 7, S6 and Table S2). Thirty-seven submountainous species out of the 97 studied shifted northward and 19 shifted downward. Differences between predicted and observed latitudinal range shifts were not significant (−4 km; Mann–Whitney U test; P = 0.08), whereas they were significant for elevational range shifts (−75 m; Mann–Whitney U test; P < 10−3). It is interesting to note that on average, the southern range margin of studied species did not shift significantly either from model predictions (−15 km; Mann-Whitney U test; P = 0.39) or from observations (4 km; Mann-Whitney U test; P = 0.61), but that their northern range margins shifted significantly southward irrespective of model predictions (−21 km; Mann–Whitney U test; P < 10−3) or observations (−36 km; Mann-Whitney U test; P < 10−3). Changes in species frequency in lowland and mountainous areas (Fig. S7) as well as observed and predicted latitudinal and elevational range shifts (Fig. S8) in France were similar in direction and magnitude for the subset of the 25 species studied at the European level.
Discussion
By predicting future distributions of submountainous forest plant species across Europe and assessing the recent changes in the prevalence of these species in metropolitan France, we highlighted an unexpected outcome of climate change: the potential disjunction of species ranges. Although the species studied were not at risk of extinction during the next century, this likely consequence of climate change could have dramatic consequences on genetic diversity (Young et al., 1996) and population viability (McLaughlin et al., 2002).
Predictions of range disjunctions
To our knowledge, the potential range disjunction pattern has never been highlighted in studies focusing on the impact of future or contemporary climate change on species distributions (see Rahel et al., 1996 for an exception). We argue here that not only land-use changes (Honnay et al., 2002) but climate change as well may lead to range disjunction at a broad spatial scale. These predictions of range disjunctions are based on species distribution models that assume complete equilibrium and synchronous responses to future climate change. They do not account for geographical barriers like the Baltic Sea and potential lagging effects (Bertrand et al., 2011) that can be caused by dispersal limitation (Svenning et al., 2008), biotic interactions (Wisz et al., 2013) or the spatial buffering of climate change provided by topoclimates (Dobrowski, 2011) and microclimates (Harwood et al., 2014). For instance, species that are currently absent in Fennoscandia and northeastern Europe (eight of the 25 studied) might not be able to migrate fast enough to keep pace with climate change. Dispersal limitations that may have prevented these species from colonizing Fennoscandia after the last glacial maximum (Svenning et al., 2008) should be investigated in light of subsequent warming and cooling episodes (Bond et al., 1997). Indeed, warming episodes such as the ‘Medieval Warm Period’ (Broecker, 2001) may have increased the probability for lowland areas in temperate Europe to act as a climatic barrier, in addition to the Baltic Sea, hindering the colonization of northern Europe by dispersal-limited species confined to mountainous regions in southern Europe. By predicting future shift of the northern range margin of submountainous forest plant species across Europe, we have also demonstrated that only half of the species were predicted to expand their range northward. Future climatic conditions could rather induce preferential shifts towards Eastern Europe instead of northward range shifts towards Fennoscandia, as initially expected.
While dispersal limitations may prevent range expansion at the cold margin, population dynamics and the ability of species to persist locally could limit range retraction at their warm margins (Dullinger et al., 2012), i.e., in the European lowlands for submountainous species, and thus mitigate potential range disjunctions. Processes that make species persisting under unfavourable climatic conditions (cf. local extinction lags) are here of particular relevance as the predicted trend to shift northward at the European scale is due, to a large extent, to range retractions at the southern range margin of species. This ability to persist locally can have two origins: (i) evolutionary adaptation involving species plasticity and (ii) the intrinsic abilities of species to tolerate climate change. Moreover, microclimates (Harwood et al., 2014) and topoclimates (Dobrowski, 2011) may provide climate refugia for some species, allowing them to persist locally amid unfavourable regional climate conditions, with the potential to buffer species response to environmental changes (Lenoir et al., 2013). Such climate refugia are overlooked here due to the coarseness of the spatial resolution used (AFE grid cells).
Southward shifts and early signs of range disjunction observed in France
The potential future disjunction of submountainous species ranges in Europe in response to climate change is strongly supported by the recent decrease that we observed in the frequency of submountainous forest plant species in the French lowlands. These recent changes in the frequency of submountainous species across the French lowlands are corroborated by southward and upward range shifts. The southward shift of the northern range margin (in France) of submountainous forest plant species clearly shows that submountainous species are retracting their distributions towards mountainous areas located in the south of France. This pattern is probably not specific to France and should be investigated at the European level. Whereas the upward shift of forest plant species has already been documented in the French mountains (Lenoir et al., 2008), reports of latitudinal range shifts of plant species in lowlands are scarce (Lenoir & Svenning, 2015). Although northern range margins are, at a global scale, considered as leading edges in the context of climate warming (Parmesan & Yohe, 2003), the observed southward retraction of submountainous species’ ranges in France shows that depending on species’ ecology and the spatial configuration of climatic gradients, northern margins may locally be considered as trailing edges. This pattern is in contrast with the expected poleward shift or expansion at a global scale (Parmesan & Yohe, 2003). These results support former research suggesting that climate change may not only lead to poleward and upward range shifts, but to omnidirectional range shifts as well, as theoretically shown by VanDerWal et al. (2013), especially at the regional and local scales.
Although the magnitude of the observed range shifts was lower than the one based on model predictions – confirming the lag behind climate change of changes in the composition of forest plant communities (Bertrand et al., 2011) – species distribution models were able to fairly well predict the direction of the observed shifts in latitude and in elevation. The consistency between our model predictions and field observations of range shifts across the French territory strengthens the significance of our results and increases our confidence in the reported predictions of future distribution changes for submountainous plant species at the European level. While the concordance between predicted and observed range shifts has been demonstrated for marine taxa (Pinsky et al., 2013), fish (Comte & Grenouillet, 2015) and butterflies (Eskildsen et al., 2013), this is the first report of concordance between observed and predicted range shifts for plant species. Overall, these findings support the idea that early signs of range disjunction are already visible for submountainous plant species under contemporary climate change and suggest that future populations of submountainous species will probably be isolated from each other under future climate change.
Potential consequences of range disjunctions
While the prediction of the future consequences of climate change has primarily focused on extinction risks (Thomas et al., 2004) and range contractions (Thuiller et al., 2005), the disjunction of species ranges into two main viable populations has never been reported. Even if submountainous species do not seem to be at risk of extinction, isolation in distinct populations with limited or absent gene flow may have important genetic consequences (Hewitt, 1996).
One important particularity of the potential future pattern of range disjunction predicted here is the distance between isolated populations. Contrary with reported range fragmentations due to land-use changes (Foley et al., 2005) where the distance between populations, especially in forests, may be less than the pollen and seed dispersal capacity (Kramer et al., 2008), the simulated separation of populations between the Scandes, north-eastern Europe and southern mountain ranges in Europe would result in distances far greater than species’ dispersal abilities. Despite the potential for long distance dispersal (LDD) events of seeds and pollen, such large distances could seriously hinder gene flow between northern and southern populations. This isolation of populations could thus induce genetic drift within and genetic divergence between populations (Young et al., 1996). Reduced population size could also lead to inbreeding depression by accumulation of deleterious alleles in small populations (Charlesworth & Charlesworth, 1987). Since southern and northern populations of plant species in Europe are genetically different (Hewitt, 1999), this issue is of crucial importance. The predicted retraction trend at the southern range margin of species at the European scale strengthens the risk of limited gene flow between the different populations. Southern populations likely to be located at the warm margin of a species range are known to be a source of genetic diversity (Hampe & Petit, 2005), but reduced gene flow between southern and northern populations may limit the capacity of species to adapt to climate change and lead to population extinctions (Jump & Peñuelas, 2005). This potential for genetic differentiation between northern and southern populations of the same species could be investigated for alpine species that currently have disjunct distributions across Europe. It has recently been demonstrated that the actual niche width of distant populations of the same species differs between the Alps and Fennoscandia, being higher in the Alps than in Fennoscandia and thus suggesting a greater genetic diversity in populations from the Alps (Wasof et al., 2015).
We demonstrated that recent changes in the distributions of submountainous forest plant species observed in France can be seen as the early signs of future range disjunctions across Europe. Assessed here for submountainous forest plant species across Europe, this pattern of species range disjunctions is likely to occur for other taxonomic groups and in other regions of the World. Due to the distance between populations induced by this potential outcome of future climate change, this pattern could have dramatic consequences on population viability, genetic diversity and the capacity of species to face future climate change. This risk of biodiversity loss could be mitigated by identifying and setting up conservation programs for species’ populations with high genetic diversity.
Acknowledgements
We thank A. Sennikov and the AFE Committee, the French National Forest Inventory, Sophy and EcoPlant contributors who provided floristic data as well as I. Seynave and V. Perez who managed the databases used in this article. We also thank J. J. Wiens for comments and discussion that helped to improve the manuscript and two anonymous reviewers for their valuable comments. This study was funded through a PhD grant to E. Kuhn from ADEME and the Regional Council of Lorraine. This study was supported by the French National Research Agency (ANR) as part of the ‘Investissements d'Avenir’ program (ANR-11-LABX-002-01, Lab. of Excellence ARBRE). The authors have no conflict of interest to declare.


