Effects of extreme experimental drought and rewetting on CO2 and CH4 exchange in mesocosms of 14 European peatlands with different nitrogen and sulfur deposition
Abstract
The quantitative impact of intense drought and rewetting on gas exchange in ombrotrophic bogs is still uncertain. In particular, we lack studies investigating multitudes of sites with different soil properties and nitrogen (N) and sulfur (S) deposition under consistent environmental conditions. We explored the timing and magnitude of change in CO2 (Respiration, Gross Primary Production – GPP, and Net Exchange – NE) and CH4 fluxes during an initial wet, a prolonged dry (~100 days), and a subsequent wet period (~230 days) at 12 °C in 14 Sphagnum peat mesocosms collected in hollows from bogs in the UK, Ireland, Poland, and Slovakia. The relationship of N and S deposition with GPP, respiration, and CH4 exchange was investigated. Nitrogen deposition increased CO2 fluxes and GPP more than respiration, at least up to about 15 kg N ha−1 yr−1. All mesocosms became CO2 sources during drying and most of them when the entire annual period was considered. Response of GPP to drying was faster than that of respiration and contributed more to the change in NE; the effect was persistent and few sites recovered “predry” GPP by the end of the wet phase. Respiration was higher during the dry phase, but did not keep increasing as WT kept falling and peaked within the initial 33 days of drying; the change was larger when differences in humification with depth were small. CH4 fluxes strongly peaked during early drought and water table decline. After rewetting, methanogenesis recovered faster in dense peats, but CH4 fluxes remained low for several months, especially in peats with higher inorganic reduced sulfur content, where sulfate was generated and methanogenesis remained suppressed. Based on a range of European sites, the results support the idea that N and S deposition and intense drought can substantially affect greenhouse gas exchange on the annual scale.
Introduction
Ombrotrophic peatlands (bogs) are acidic, rain-fed ecosystems largely dominated by Sphagnum mosses and represent globally relevant stores of soil carbon (Vasander & Kettunen, 2006). The sustained carbon (C) uptake is generally attributed to the low rate of organic matter (OM) decomposition in waterlogged soils. The C balance of bogs primarily depends on photosynthesis, or gross primary production (GPP), and losses from auto- and heterotrophic respiration in the form of CO2 (Alm et al., 1999; Worrall et al., 2007). Emission of CH4 and export of dissolved C generally play a smaller, yet potentially significant, role in the C budget (e.g., Roulet et al., 2007).
Seasonal drying and short-term changes in water table (WT) and soil moisture influence the production, storage, and release of CO2 and CH4. A faster release of CO2 is generally expected during dry periods as a greater proportion of the soil is exposed to oxygen, which typically leads to an increase in soil respiration in laboratory studies (Howard & Howard, 1993; Moore & Dalva, 1997). Some field studies provided evidence for enhanced CO2 release as well (Alm et al., 1999; Lund et al., 2012), but others failed to demonstrate such a response (Silvola et al., 1996; Chimner & Cooper, 2003; Lafleur et al., 2005). Another constraint on respiration is the humification and increasing recalcitrance of peat, which may limit CO2 production in deeper layers (Hogg, 1993). The lack of response in CO2 fluxes with deeper oxygen penetration during drought has been attributed to this constraint (Chimner & Cooper, 2003; Lafleur et al., 2005; Estop-Aragonés & Blodau, 2012). Drought may also substantially diminish GPP in Sphagnum-dominated peatlands; this response depends on the timing and severity of the dryness, the microtopography, and the different ability among Sphagnum species to hold water by capillarity (Schipperges & Rydin, 1998; Alm et al., 1999; Lund et al., 2012). It is well documented that seasonal dryness mostly leads to smaller C uptake, or even C release from bogs (Roulet et al., 2007). The contribution of respiration and GPP to this seasonal change, its temporal dynamics, and its importance on the annual timescale require further attention, however (Nijp et al., 2015). Drying is generally expected to lower CH4 production and fluxes to the atmosphere as methanogenic activity is restricted to anoxic conditions (Fetzer et al., 1993), despite some resistance to oxygen and desiccation that was more recently documented (Anderson et al., 2012). The decline of CH4 emissions could be expected to be more effective with further WT decline, but such an effect may be obscured by a decoupling of WT position and oxic/anoxic boundaries particularly in dense peats, during transient conditions, and when anoxic microniches dominate the CH4 flux (Knorr et al., 2008; Deppe et al., 2010; Estop-Aragonés et al., 2012). So far, relatively little attention has been given to the importance of degassing of the CH4 pool with WT drawdown and raised air-filled porosity.
Increased nitrogen (N) deposition can also alter the carbon balance of peatlands. Over the last century, some peatlands have received inputs of atmospheric N 10-fold and of atmospheric S 50-fold larger than the preindustrial levels (Lefohn et al., 1999; van Aardenne et al., 2001). The effect of N deposition on long-term C net exchange (NE) at the ecosystem level has remained uncertain because vegetation succession, time lags, and nonlinearity in responses of carbon cycling add complexity to the relationships between N deposition and NE in Sphagnum-dominated ombrotrophic bogs (Bubier et al., 2007; Wu & Blodau, 2014). In incubation experiments with Sphagnum mosses, both GPP (Granath et al., 2012) and respiration (Bragazza et al., 2006) increased with N inputs up to a threshold and decreased at even higher loads. Recent results of the Mer Bleue long-term N fertilization experiment in a continental Canadian bog suggest that net C uptake also may decline under experimental N deposition levels exceeding about 2 g N m−2 yr−1 due to loss of Sphagnum mosses and their ecosystem functions (Larmola et al., 2013).
Raised sulfur (S) deposition in peatlands may favor sulfate reduction against methanogenesis and thus potentially lower CH4 emissions, which has been demonstrated in many studies (Shannon & White, 1996; Gauci et al., 2004a; Dowrick et al., 2006), although occasionally only effects on sulfate and sulfur pool sizes were found (Vile et al., 2003). The impact of elevated sulfur levels in peats on methanogenesis becomes particularly important during and after dry periods when sulfate is generated and, upon rewetting, temporarily suppresses methanogenesis until being largely exhausted (Shannon & White, 1996; Estop-Aragonés et al., 2013). For a given period of dryness, it can be expected that larger sulfate pools are generated in sulfur-rich peatlands and that methanogenesis and CH4 emissions are suppressed for longer periods of time. Little is currently known about the magnitude of CH4 suppression after drought across a range of bogs on the annual timescale.
To rectify some of the above-mentioned knowledge gaps, we explored the magnitude and timing of changes in soil respiration, GPP, NE, and CH4 fluxes in peat bog mesocosms collected from hollows of 14 European peatlands during severe drying and rewetting. The sites covered a wide range of N and S deposition. We suspected low N deposition levels to promote and high levels to impair net C uptake. We further aimed to explore to which extent such effects are driven by changes in moss photosynthesis and peat respiration. Furthermore, we investigated the importance of peat physical properties and humification on the response of auto- and heterotrophic respiration, and of inorganic reduced sulfur content on the response of methanogenesis and CH4 efflux. We expected respiration to have little response to drought in more humified peats, and elevated sulfur deposition to raise reduced sulfur content in peat and to lower CH4 emission, especially after drought.
Material and methods
Sampling and site description
The sites selected are a subset of a larger survey investigating the effects of nitrogen pollution on ecosystem properties of peatlands (the so-called PEATBOG project). Here, we cover a range of N and S deposition as wide as possible, given our resources and logistical limitations. We sampled a mesocosm, i.e., a peat column in a PVC tube including the live mosses, and an adjacent soil core during May and June 2010 at 14 sites with different atmospheric N and S deposition (Table 1), 9 in the UK and Ireland, 4 in Poland, and 1 in Slovakia. We sampled the wettest areas at each site, consisting of waterlogged hollows and lawns dominated mostly by Sphagnum fallax. This approach minimizes confounding the impact of drying and rewetting with the influence of vegetation community adaptation to annual precipitation levels, which substantially differs between peatlands (Table 1). We targeted these sampling locations as largest drought impacts with respect to CH4 emissions (Bubier et al., 1993; Alm et al., 1999) and desiccation of Sphagnum are expected (Schipperges & Rydin, 1998; Robroek et al., 2007, 2009). Mesocosms were extracted by inserting a PVC tube (45 cm high and 18 cm diameter, rubber-stoppered ports at 10, 20, and 35 cm depth) into the soil using a knife and a rubber hammer. A pit was dug adjacent to it and the tube containing the soil was extracted with the help of a spade. The bottom was closed with a rubber-sealed cap preventing water leakage. Mesocosms were filled with pore water from the site and transported back to the laboratories in Bayreuth, Germany, where they were placed in a room at 12 ± 2 °C and under alternating dark and light cycles of 12 h using lamps (SON-K 400 HPS SVP from Professional Lighting) providing a PAR of 200 μmol m−2 s−1. Although being low compared with mid-day field conditions, Sphagnum typically reaches a substantial rate of photosynthesis at this PAR level (McNeil & Waddington, 2003).
| Site name | Latitude (N) | Longitude (W) | Mean annual temp. (°C) | Mean annual precip. (mm) | N depos. (kg ha−1 y−1) | S depos. (kg ha−1 y−1) | Dominant mesocosm vegetation | BD (g cm−3) | HI | TRIS (μmol g−1 dw) | WTa (cm) |
|---|---|---|---|---|---|---|---|---|---|---|---|
| Clara (Cl) | 53° 19′ 26″ | 7° 37′ 54″ | 9.1 | 885 | 1.95 | 4.00 | Sph. fallax | 0.031 ± 0.005 | 0.48 ± 0.06 | 13.92 ± 10.56 | −2 |
| Raheen-more (Ra) | 53° 20′ 17″ | 7° 20′ 27″ | 8.9 | 886 | 2.28 | 3.43 | Sph. papillosum, Narthecium ossifragum | 0.036 ± 0.022 | 0.48 ± 0.03 | 41.17 ± 47.20 | −1 |
| Mouds (Mo) | 53° 12′ 44″ | 6° 49′ 1″ | 9.2 | 864 | 2.62 | 3.24 | Sph. fallax | 0.033 ± 0.018 | 0.66 ± 0.15 | 20.94 ± 10.25 | −3 |
| Borth (Bo) | 52° 30′ 8″ | 4° 0′ 39″ | 9.7 | 1035 | 3.64 | 3.18 | Sph. pulcrum | 0.053 ± 0.006 | 0.81 ± 0.16 | 19.27 ± 16.01 | −4 |
| Migneint (Mi) | 52° 59′ 37″ | 3° 49′ 5″ | 7.2 | 1326 | 5.32 | 3.74 | Sph. fallax | 0.041 ± 0.007 | 0.54 ± 0.01 | 8.02 ± 5.58 | −10 |
| Glasson (Gl) | 55° 45′ 57″ | 3° 16′ 11″ | 8.7 | 924 | 5.64 | 3.42 | Sph. fallax | 0.049 ± 0.0014 | 0.75 ± 0.27 | 17.42 ± 13.98 | −4 |
| Moidach (Mh) | 54° 49′ 25″ | 6° 40′ 11″ | 6.6 | 813 | 7.64 | 5.61 | Sph. cuspidatum | 0.033 ± 0.020 | 0.41 ± 0.04 | 5.69 ± 6.73 | −2 |
| Whim (Wh) | 55° 45′ 56″ | 3° 16′ 11″ | 7.3 | 958 | 7.82 | 5.20 | Sph. fallax and papillosum | 0.079 ± 0.014 | 0.76 ± 0.10 | 40.63 ± 35.54 | −22 |
| Rzecin (Rz) | 52° 45′ 40″ | 16° 18′ 34″ | 8.3 | 553 | 8.86 | 8.85 | Sph. fallax | 0.079 ± 0.005 | 0.91 ± 0.20 | 45.85 ± 47.92 | −2 |
| Linje (Li) | 53° 11′ 13″ | 18° 18′ 35″ | 7.5 | 549 | 9.71 | 11.33 | Sph. fallax | 0.051 ± 0.005 | 0.52 ± 0.05 | 28.21 ± 34.35 | −3 |
| Whixall (Wx) | 52° 54′ 52″ | 2° 46′ 15″ | 8.7 | 747 | 10.49 | 6.64 | Sph. fallax | 0.079 ± 0.038 | 0.73 ± 0.10 | 24.04 ± 16.66 | −15 |
| Kusowo (Ku) | 53° 48′ 54″ | 16° 35′ 20″ | 7.3 | 656 | 10.90 | 10.03 | Sph. fallax and magelanicum. | 0.059 ± 0.017 | 0.58 ± 0.11 | 14.64 ± 8.79 | −5 |
| Spalény Grunik (Sp) | 49° 30′ 12″ | 19° 15′ 0″ | 5 | 1082 | 15.41 | 22.37 | Sph. fallax | 0.046 ± 0.023 | 0.80 ± 0.34 | 11.05 ± 10.22 | −5 |
| Piekielnik (Pi) | 49° 27′ 39″ | 19° 47′ 13″ | 6.3 | 927 | 24.07 | 36.90 | Sph. fallax | 0.072 ± 0.033 | 0.62 ± 0.13 | 15.01 ± 9.86 | −5 |
- a At time of sampling.
A perforated PVC tube of 1.5 cm diameter, equipped with a thin rod graduated at 1 cm resolution, was vertically inserted to monitor WT and was kept sealed with a rubber plug to prevent venting. Soil gas and water samplers were horizontally inserted similarly to previous studies (Knorr et al., 2008; Deppe et al., 2010).
We monitored the mesocosms during an initial wet phase (‘predry’), a drying phase (‘dry’), and a rewetted phase (‘postdry’). For about 40 days, deionized water was added to maintain WT between 0 and 5 cm below surface (predry); then irrigation was stopped for ~100 days (dry); finally, cores were rewetted by raising the WT to the soil surface and maintaining it between 0 and 5 cm below surface for 200–230 days (postdry). Plant biomass was quantified at the end of the experiment by cutting and drying the capitula (~2 cm) of Sphagnum and other aboveground vegetation if present. Adjacent to the location of mesocosm sampling, usually within 1 m distance, a soil core 50 cm deep was extracted using a Finnish box corer (9 cm × 9 cm). Each core was sliced into 5 cm layers using a knife, wrapped in aluminum foil, placed in a sealed plastic bag, and kept in a cool box for analyses of soil properties.
Infrared spectroscopy and inorganic sulfur content analyses

TRIS content was determined in duplicates according to a modified procedure of Fossing & Jørgensen (1989) using a distillation apparatus where 3 ml of ethanol, 5 ml of 5N HCl, and 15 ml of a 1M Cr2+ solution were mixed with ~0.5 g dry peat sample and boiled for 1 h. The released H2S was trapped in 0.15N NaOH solution and quantified photometrically with the methylene-blue method (Hofmann & Hamm, 1967).
Measurement and quantification of CO2 and CH4 fluxes and soil gas concentrations
Net exchange of CO2 was measured using a transparent perspex chamber (25 cm high and 19 cm diameter). Mesocosm respiration was measured using the same chamber covered with tin foil. Photosynthesis was calculated from NE = GPP - respiration. After gentle flushing of the chamber, five gas samples were retrieved with disposable syringes at 5-min intervals. Next, gas samples were taken from soil gas samplers using plastic syringes and injected in a SRI 8610C gas chromatograph within 2 h after collection. The flux of CO2 and CH4 was calculated from the slope of linear regression. Rates with R2 < 0.75 were discarded leading to a loss of 15% (NE), 16% (GPP), 2% (respiration), and 17% (CH4) of data. Negative CO2 fluxes indicate C uptake by the mesocosm and positive signs C release. The quantification of soil gas concentrations used Henry's law constant corrected for temperature for CO2 and CH4 (Estop-Aragonés & Blodau, 2012). Minimum production rates of CH4 in the peat were estimated from the change of dissolved concentrations over time.
The net CO2 balance was calculated from NE and GPP assuming 12 h of daytime and from respiration assuming 12 h of nighttime. Gaps in fluxes were filled using either an average between adjacent values (single gap point between two measurements), the nearest value (gap of two or more points between measurements), or using half of the mean predry value (gap at the end of the rewetted phase). To compare the effects of drought and rewetting on C flux exchange against a potential scenario with constant high WT, we calculated cumulative fluxes assuming constant predry values over time (hereafter called ‘fictitious control‘). Flux rates are unlikely to remain constant, as shown for CH4 (e.g., Gauci et al., 2004a) and CO2 (Knorr et al., 2008); the comparison to the fictitious control thus mainly has heuristic value.
Calculations and statistical analysis
We quantified the change of fluxes relative to the predry condition using the mean predry flux value as a reference. To this aim, we divided each flux during drying and postdry phases by the mean predry flux and multiplied by 100 to express percentage (%). Consequently, a value above 100% implies higher (and a value below 100% implies lower) fluxes than during the predry condition.
The relationships among variables were investigated by correlation and regression analyses. We used Spearman correlation when the relationship of variables was monotonic and there was violation of normality, and report values of significance (P values) and correlation coefficients (r). For regression analyses, we report values of significance (P values), coefficients of determination (R2) and the test statistic (F) along with degrees of freedom. The validity of the regressions was ensured by normality tests (Shapiro–Wilk statistic) and constant variance tests. These statistical analyses were performed using SPSS Statistics 20 and SigmaPlot version 12. Additionally, for regression analysis with repeated measures, we used linear mixed effects with site (≈mesocosm) added as a random factor using the lme4 package (Bates et al., 2012) in R (R Core Team, 2012) and following Winter (2013). For those regressions, we report P values attained by likelihood ratio tests comparing the full model against the model without the effect being analyzed. Visual inspection of residuals after regression analysis did not show any obvious deviations from homoscedasticity.
Results
Peat properties
Bulk density ranged from 0.01 g cm−3 to 0.13 g cm−3, increased with depth in most sites, and varied little in some others (Table S1). Compared with mean BD, the peat was less compacted at Mouds, Raheenmore, Clara, and Moidach, and more so at Rzecin, Whixall, and Whim sites. FTIR spectra showed variations in the chemical composition and structure of OM with depth (Fig. S1). At Linje, Kusowo, Migneint, Raheenmore, Clara, and Moidach bogs, HI was lower and more uniform, whereas at the other sites, HI was higher and increased with depth (Table S1). TRIS content ranged from 1.8 to 108 μmol g−1 dw, with smallest contents mostly present in the uppermost layer. Keeping in mind large variations, sites Migneint and Moidach had consistently the lowest and Rzecin and Whim the highest TRIS content (Table S1).
Peat BD correlated with HI and TRIS content; using all data (n = 56), BD positively correlated with HI (r = 0.69, P < 0.001), and TRIS (r = 41, P = 0.002), and TRIS with HI (r = 0.45, P < 0.001). Similar correlations were found when properties were averaged for entire mesocosms. Sulfur deposition (Table 1) was strongly linked to nitrogen deposition (r = 0.87, P < 0.001), but, contrary to expectation, was related very poorly to peat TRIS content (r = −0.1, P = 0.73).
Hydrologic response
Water table declined between 0.1 and 2 cm d−1 with a mean ± SD of 0.4 ± 0.4 cm d−1 and reached from −21 cm (Clara) to −45 cm (Migneint and Whim) before rewetting. A higher mean BD was associated with a deeper decline of WT in the mesocosms at the end of drying (r = −0.53, P = 0.049) and before (not shown), but linear regression poorly predicted the WT decline (WT (cm) = −20.7–238.5 * BD (g cm−3), R2 = 0.25, P = 0.069, F (1,12) = 3.99, Fig. S2). The water volume needed for rewetting was 2.4 ± 0.7 l. Mesocosms with deeper WT decline generally also required more water for rewetting, other than cores from Migneint and Whim that required low water volumes (2.0 and 1.4 l, respectively).
Response of gas C fluxes to hydrologic change
Net exchange
Mesocosms mostly lost C at an average of 70 ± 61 g C-CO2 m−2; 12 mesocosms released C up to 196 g C-CO2 m−2 (Whim), and only two sites (Migneint and Raheenmore) gained C up to 18 g C-CO2 m−2 (Fig. 1). During predry conditions, NE was, on average, −1.87 ± 0.83 g C-CO2 m−2 d−1 and it ranged from −0.61 in Whim to −3.23 g C-CO2 m−2 d−1 in Spalény Grunik. All mesocosms switched from CO2 uptake (NE < 0) during the predry phase to CO2 release during drying (Figs 1 and 2). The shift in NE took, on average, 57 ± 25 drying days and varied from 18 in Rzecin to 96 days in Migneint. It occurred when a WT of −24 ± 6 cm was reached, ranging from −18 in Whim Bog to −40 cm in Migneint. The shift was unrelated to biomass or BD (see Data S1). Net uptake of C (NE < 0) began, on average, after 43 ± 34 postdry days, ranging from 7 in Linje, Rzecin, Migneint, Raheenmore to 114 days in Clara bog. The response of NE to rewetting was thus highly variable. Only in three mesocosms (Borth, Migneint, and Mouds) NE fully recovered or surpassed predry NE and, on average, 90 ± 92% of predry NE was reached by the end of the wet phase.
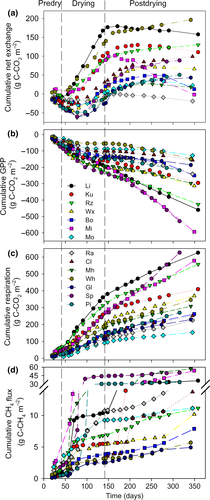
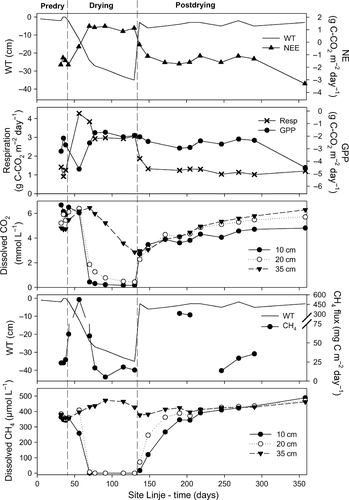
The outlined differences in the temporal response of NE appeared to be related to the very different C balance of the mesocosms by the end of the experiment (Fig. 2). Some sites, such as Rzecin and Whim, lost C early on (within a week), whereas others, such as Mouds and Raheenmore, continued taking up C until 6 weeks or 2 months into the dry period. These groups of sites drastically differed in terms of their C balance by the end of the experiment. An early shift to C loss that was later reversed by intense uptake after rewetting was an exception; the Migneint site provides an example.
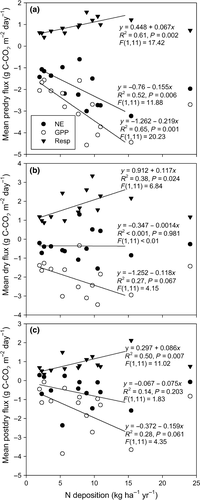
Net C uptake increased with increasing N deposition up to levels of ~15 kg ha−1 yr−1 (R2 = 0.52, Fig. 3a); at one site, Piekielnik, more N was deposited (24 kg ha−1 yr−1) and less C taken up (Fig. 3a). The relationship disappeared during drying (R2 = 0, Fig. 3b) and remained weak after rewetting (R2 = 0.14, Fig. 3c).
Gross primary production
Cumulative average GPP was −303 ± 146 g C-CO2 m−2 (Fig. 1). Before drying, GPP rates averaged −2.81 ± 1.05 g C-CO2 m−2 d−1 ranging from −1.57 in Mouds to −4.50 g C-CO2 m−2 d−1 in Rzecin and Spalény Grunik. In most mesocosms, GPP peaked at the beginning of drying when WT was still high, at −9 ± 5 cm. Further drying led to a strong decline with levels of −0.77 ± 0.98 g C-CO2 m−2 d−1 or −1.79 ± 2.28 g C-CO2 kg biomass−1 d−1 on the last day of drying. Sphagnum mosses were still active in several cores after 100 days of drought with GPP as high as −2.59 (Rzecin) and −2.36 g C-CO2 m−2 d−1 (Migneint); only sites Borth, Clara, Whim, Glasson, and Piekielnik had a GPP close to 0 (Fig. 2). After rewetting, GPP recovered to a variable extent, but only four mesocosms (Borth, Migneint, Mouds, and Raheenmore) reached predry levels near the end of the experiment. On average, 89 ± 64% of the predry fluxes were attained by the end, varying from 31 to 222%. This finding indicates a large range of possible impacts of drying and rewetting on moss GPP in hollows of bogs. Nitrogen deposition was positively related to photosynthesis with maximum GPP at ~15 kg ha−1 yr−1 (R2=0.65, Fig. 3a). The greater atmospheric deposition in the Piekielnik site appeared to have a detrimental effect on GPP. This relationship was stable but weaker during the dry (R2 = 0.27, Fig. 3b) and the postdry phases (R2 = 0.28, Fig. 3c).
Mesocosm respiration
Cumulative average respiration was 372 ± 161 g C-CO2 m−2 (Fig. 1) and thus slightly higher than GPP. Before drying, respiration fluxes averaged 0.91 ± 0.33 g C-CO2 m−2 d−1 and ranged from 0.41 in Mouds to 1.57 g C-CO2 m−2 d−1 in Rzecin. Soil respiration generally increased with drying in the first month when the water table was <20 cm deep, but it did not keep increasing as WT kept falling (Figs 2 and S3). In fact, respiration declined in 10 of the 14 mesocosms. Maximum respiration averaged 2.26 ± 0.90 g C-CO2 m−2 d−1, varying from 1.02 (Mouds) to 4.28 (Linje) g C-CO2 m−2 d−1. Rewetting led to a rapid decline of respiration, which averaged 0.98 ± 0.55 g C-CO2 m−2 d−1 and ranged from 0.36 to 2.14 g C-CO2 m−2 d−1. This corresponds to a decrease by a factor of 2.02 ± 0.53, ranging from only 1.02 (Spalény Grunik) to 3.07 (Kusowo) compared to respiration in the dry phase. Peaks of respiration flux were observed only at two sites, 5 to 7 days after rewetting. Nitrogen deposition was positively related to respiration over the range until ~15 kg ha−1 yr−1 (R2 = 0.61, Fig. 3a). This relationship weakened during the dry (R2 = 0.38, Fig. 3b) and the postdry phases (R2 = 0.50, Fig. 3c). In the mesocosm from the Piekielnik site, where atmospheric deposition was highest, respiration was lower than in mesocosms taken from sites with intermediate N deposition levels.
Temporal dynamics of NE, GPP, and respiration
We quantified the change of fluxes relative to predry conditions using the mean predry value of each mesocosm and plotted the % change over drying time or WT (Fig. 4). Slopes obtained from linear mixed effects models with drying time were generally negative, implying that continued and intensifying dryness lowered fluxes (Slopes = −1.909, −1.363, and −0.516; P values <0.0001, <0.0001, and 0.0013; for NE, GPP, and respiration, respectively – Fig. 4a). It is noteworthy that this finding indicates again that respiration, while being generally higher than predry (>100%), on average, significantly decreased with intensifying dryness, albeit with large variability. Similar trends were also found with respect to the impact of WT; declining WT, on average, led to lower NE and GPP (Slopes = 5.545, 3.430; P < 0.0001, <0.0001, respectively). The relationship was poor for respiration with a nonsignificant and closer to zero slope (Slope= 0.469, P value = 0.35 – Fig. 4b).
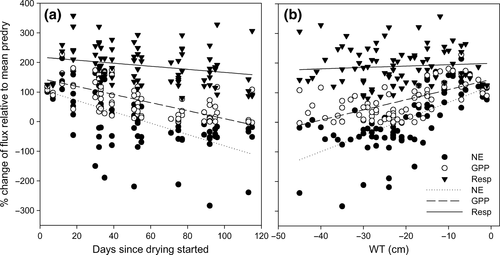
As GPP and respiration showed a nonmonotonic response to dryness, we shortened the drying time and WT range in the regression to identify the change in sign of slopes (Table S4). The slope for respiration changed from an increasing to a decreasing trend between the 32nd and 40th drying day, and the slope of GPP between the 18th and 32nd day. A substantial decrease already occurred between the 12th and 18th day of drying. Thus, GPP peaked sooner than respiration during drying. As time passed, the change in GPP was more pronounced than the change in respiration. As a result, the inflexion point for NE occurred between the 12th and 18th days, when WT ranged from −10 to −15 cm.
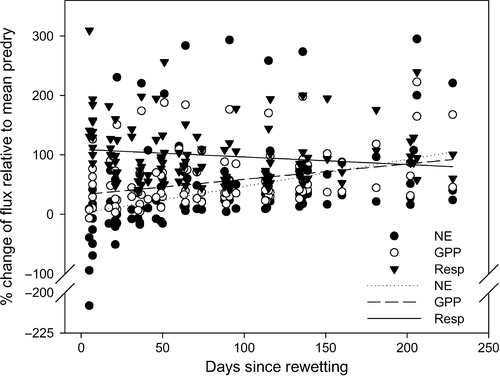
The change of CO2 fluxes after rewetting relative to predry fluxes is shown in Fig. 5. The trend line of NE attained predry values only after 200 rewetting days (P < 0.001, slope = 0.452), the GPP line did not reach predry values (P < 0.001, slope = 0.260), and respiration slightly decreased over time (P = 0.023, slope = −0.12).
Methane
Cumulative average CH4 release was 24.3 ± 18.1 g C-CH4 m−2 and ranged from 4.9 to 57.1 g C-CH4 m−2 (Fig. 1). Release of CH4 peaked with one exception in all mesocosms in the early dry period, mostly within 30 drying days when the average of WT was −12 ± 5 cm. The fluxes peaked, on average, at 520.7 ± 606.9 mg C-CH4 m−2 d−1 (from 58.4 to 1763.8), about 18 times the predry CH4 release, and were related to the CH4 pool size (exponential curve, R2 = 0.95, P < 0.0001, Fig. S4). With the increase in CH4 flux, soil concentration also decreased (Figs 2 and S3). The relevance of CH4 degassing can be appreciated in the cumulative fluxes (Fig. 1); on average, 54 ± 23% of the total emissions occurred by the end of the drought, ranging from 20 to 91%. Continued drying subsequently diminished CH4 release down to an average of 14.5 ± 11.7 mg C-CH4 m−2 d−1 just before rewetting.
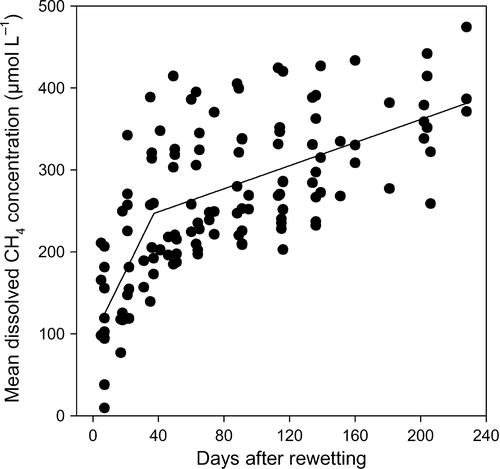
Upon rewetting, soil CH4 concentrations increased rapidly and later more slowly, indicating ongoing methanogenesis (Figs 2 and 6). On average, the release was 4.1 μmol CH4 l−1 d−1 during the initial 40 days and 0.7 μmol CH4 l−1 d−1 during the remaining period (Fig. 6). Over the whole period, it ranged from 0.40 (Moidach) to 1.50 μmol CH4 l−1 d−1 (Piekielnik). The production and accumulation of CH4 were not reflected in fluxes of the gas, which did not systematically accelerate (Figs 2and S3). Final average CH4 flux was 110.35 ± 133.15 mg C-CH4 m−2 d−1 and highly variable ranging from 13.55 to 420.26 mg C-CH4 m−2 d−1. These fluxes correspond to 372 ± 467% (14 to 1673%) of the predry mean values, again indicating a large range of possible responses of the process to the drying–rewetting disturbance.
Impact of sulfur on methanogenesis and CH4 flux
Nitrate concentrations during drying were 0.47 ± 0.62 mg l−1, representing a minor increase compared to values of 0.29 ± 0.21 mg l−1 during the predry phase. Sulfate was generally generated during drought, depending on TRIS content, and depleted after rewetting (Fig. 7). Contrary to expectation, CH4 production rates increased weakly with TRIS content (R2 = 0.24, P = 0.077, F1,12 = 3.75), albeit not when standardized per unit of soil dry weight (μmol kg dw−1 d−1; R2 < 0.01, P = 0.895, F1,12 = 0.02). This phenomenon may have been caused by the correlation of TRIS content, BD and C content per unit of peat volume: Bulk density and CH4 production rate were significantly related (R2 = 0.35, P = 0.027, F1,12 = 6.37).
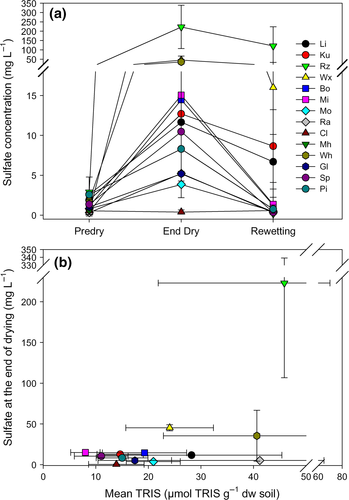
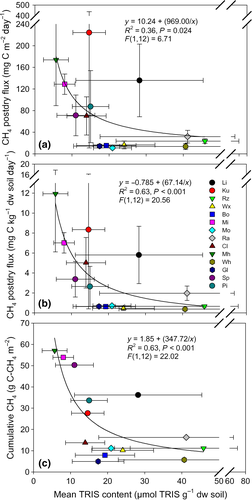
Fluxes of CH4 during the rewetted period were higher in sites with lower TRIS content (Fig. 8a and c). This relationship further strengthened when the flux was standardized per unit of soil dry weight (Fig. 8b), and over incubation time (Table S5). No such relationship existed before drying when mean CH4 flux was expressed per unit area (R2 = 0.02, P = 0.599, F1,12 = 0.29), or soil mass (R2 = 0.01, P = 0.708, F1,12 = 0.14). This finding confirms that sulfate generation from TRIS during the dry period was instrumental in lowering CH4 flux.
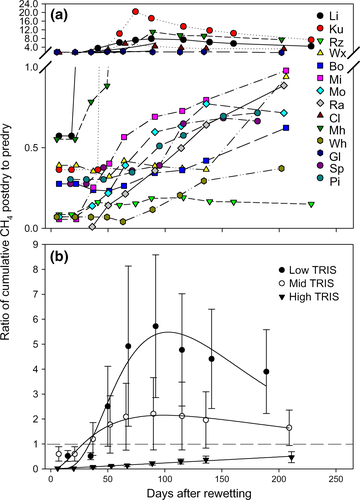
To identify the effect of TRIS content on recovery of CH4 flux after rewetting, we calculated a ratio of cumulative CH4 release relative to a potential cumulative release using predry CH4 fluxes. This ratio represents the recovery of CH4 flux with time relative to the predry condition of each mesocosm, thus accounting for the large variation in CH4 flux among sites. Nine sites did not reach (ratio < 1) and five greatly exceeded (ratio >1) predry cumulative release (Fig. 9a). When sites were grouped by mean TRIS content, a strong, negative relationship between TRIS content and the ratio of cumulative CH4 release emerged (Fig. 9b). In the group of mesocosms with high TRIS, the cumulative recovery of CH4 flux was effectively inhibited. Based on the regression of this ratio over time (Fig. 9b, Table S6), sites with high TRIS content required more than 200 days after rewetting to reach half of the cumulative CH4 release from predry conditions. When TRIS content was low or intermediate, predry CH4 levels were exceeded by a factor of 1.6 and 0.7, respectively, after 50 days already.
Relationship of CO2 and CH4 fluxes with humification
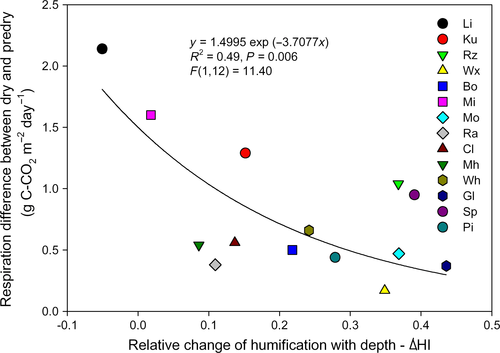
Mean mesocosm HI was unrelated to mesocosm respiration at any time, but ΔHI with depth was strongly related to the difference in respiration before and after drying (Fig. 10), regardless of whether CO2 flux was standardized to soil area or mass (Table S7). This indicates that changes in mesocosm respiration relative to predry fluxes were larger when the change in humification with depth was small. After rewetting, no significant relationships between CO2 or CH4 flux and mean and ΔHI were identified.
Discussion
Carbon dioxide exchange
A multitude of studies have addressed the impact of time-averaged water tables and drying and rewetting on CO2 fluxes in ombrotrophic bogs, either in laboratory experiments (e.g., Moore & Dalva, 1993; Blodau et al., 2004; Dinsmore et al., 2009), or by utilizing natural or experimentally induced drought at field sites (e.g., Alm et al., 1999; Lafleur et al., 2005; Muhr et al., 2011). A consensus on the magnitude of impacts on the annual scale and the temporal dynamics and mechanisms involved has yet to emerge owing to the multitude of experimental conditions and the individual nature of sites and drought events in these studies. The purpose of our study was to clarify the extent of short-term variability in site-specific responses to drought and to identify controls on this response. To this end, we exposed mesocosms from a multitude of sites with differing atmospheric N and S deposition and peat characteristics to the same treatment, while monitoring fluxes and soil concentrations in sufficient temporal resolution. Given the available resources, our purpose required a number of choices that limit extrapolation of the findings to real-world conditions, among them a lack of replication for individual sites, a lack of controls being permanently irrigated, constant light and temperature conditions with simplified day–night cycles, the selection of microhabitats that should be most sensitive to extreme drought, and a drought without intermittent rainfall, which is rare in peatlands of the temperate and boreal zones (Shannon & White, 1996; Silvola et al., 1996; Alm et al., 1999; Weiss et al., 2006). Moreover, our experiment did not include vascular plants, such as shrubs and sedges, which access deeper soil water and are less affected by intense drought than Sphagnum mosses (Bubier et al., 2003). Vascular plants moreover often dominate GPP and autotrophic respiration in ombrotrophic bogs (e.g., Moore et al., 2002). For both reasons, the effects of drought and rewetting on CO2 fluxes are probably overestimated in this experiment. Furthermore, it has to be considered that long-term change in drought intensity and frequency may lead to changes in vegetation communities, such as spreading of trees (Talbot et al., 2010), which can substantially alter C fluxes. Despite such limitations, we have some confidence that the recorded responses are not completely off the mark when compared with field conditions.
In a meta-study of CO2 exchange in 12 northern peatlands including bogs and fens, of which 7 had complete annual NEE data sets, average GPP in the latter sites was −514 ± 206 g C-CO2 m−2, ecosystem respiration (ER) 411 ± 128 g C-CO2 m−2, and NEE −103 ± 103 g C-CO2 m−2 (Lund et al., 2010). The magnitude of these fluxes is similar to the average fluxes obtained in this mesocosm study, i.e., a GPP of −303 ± 146 g C-CO2 m−2, a respiration of 372 ± 161 g C-CO2 m−2, and a NE of 70 ± 61 g C-CO2 m−2, which would have been −164 ± 110 g C-CO2 m−2, when extrapolating the predry C uptake to the entire experiment. The somewhat low values of GPP, also in comparison to the well-known Mer Bleue Bog study (−530 g C-CO2 m−2; Moore et al., 2002), can partly be attributed to the lack of hummocks and the absence of larger shrubs and sedges in the mesocosms, partly to the chosen experimental conditions, and partly to the intensity of the induced drought. Keeping the experimental limitations in mind, a number of important findings can be reported with regard to NE, GPP, and ecosystem respiration. Twelve out of fourteen mesocosms lost C, at 70 ± 61 g C-CO2 m−2 (Fig. 1), yet they would have taken up C at 164 ± 110 g C-CO2 m−2 when the predry C uptake is extrapolated. Hence, the severe drought probably shifted the C balance by >200 g C-CO2 on the annual scale, which is substantial compared with the natural variability between the sites evaluated by Lund et al. (2010). A sensitivity of the C balance to hydrologic conditions in ombrotrophic bogs has often been reported before, albeit not in this magnitude. At the dry continental Mer Bleue bog, for example, an annual net C sequestration of 40 g C-CO2 m−2 was observed over a 6-year period (Roulet et al., 2007). The sequestration varied between 70 g C-CO2 m−2 during wetter years (Lafleur et al., 2003; Moore et al., 2002) and only 9 g C-CO2 m−2 during a year with dry summer, a flux statistically not different from zero (Lafleur et al., 2003). A net C loss has been reported in a Finnish bog under such weather conditions as well (Alm et al., 1999).
The span of responses of our mesocosms to the hydrologic manipulation was striking. The net effect of drought and rewetting on cumulative NE ranged from a slight uptake of 18 g C m−2 yr−1 to a release of nearly 200 g C m−2 yr−1 (Fig. 1), although the general dynamic response was consistent across sites and characterized by declining GPP during sustained drought and, initially, by increasing respiration (Figs 1 and S3). Overall, our findings suggest that it will be difficult to constrain the quantitative impact of drought on CO2 exchange in peatlands without a much improved understanding of the interplay between soil physical conditions and moss GPP and respiration that contributed to the difference in mesocosm C balances.
From our results, some insight can also be gained about the potential effects of N deposition on CO2 fluxes from Sphagnum-dominated bog microforms because deposition correlated with CO2 fluxes, particularly during the initial wet conditions (Fig. 3). This correlation is not sufficient to assign cause-and-effect and we cannot consider shifts in plant community either, which are critical for the C balance of affected bogs (Larmola et al., 2013; Wu & Blodau, 2014). Yet, N deposition appeared to promote both GPP and respiration at least up to a level of about 15 kg N ha−1 yr−1 (Fig. 3). Because GPP increased more strongly than respiration, mesocosms with high N deposition also took up more C. These results are only partly in agreement with other findings. Elevated N deposition levels, for example, favored C release using incubations of Sphagnum topmost peat (Bragazza et al., 2006). Larmola et al. (2013) analyzed ecosystem fertilization experiments at the continental Mer Bleue bog in Canada. They reported that respiration continued to increase with deposition >20 kg N ha−1 yr−1 as well, whereas C uptake was stable in treatments fertilized with N, P, and K due to replacement of Sphagnum by shrubs. GPP only declined at highest N deposition levels of 64 kg N ha−1 yr−1 in treatments fertilized exclusively with N. There is yet no consensus about thresholds at which either GPP or respiration may be impaired. A recent analysis of another N deposition experiment in a Swedish bog indicated that about 40 kg N ha−1 yr−1 may be needed to slow Sphagnum C uptake (Granath et al., 2012). In our study, a detrimental effect of N deposition on respiration, GPP, and NE may have occurred beyond ~15 kg N ha−1 yr−1, yet the single data point from the Piekielnik site (Fig. 3) does not suffice to make a conclusive case. GPP and respiration covaried in this study, which in any case argues for a strong link between photosynthesis and ecosystem respiration and may limit the effects of N deposition on NE.
During the induced drought, subtler phenomena further emerged, such as a stronger sensitivity of GPP to drought and rewetting than of respiration. Mosses colonizing hollows have been shown to be more sensitive to drying under controlled conditions than species typically found on hummocks (Robroek et al., 2007, 2009); consequently, we observed that Sphagnum, mostly Sph. fallax, was impaired by desiccation. The moss did not quickly recover from severe drying and the response of GPP controlled NE after rewetting as well, in agreement with previous findings (McNeil & Waddington, 2003). Net exchange required, on average, 200 days to recover predry values due to the slow recovery of moss GPP (Fig. 5). This finding suggests that C uptake in hollows with abundant Sphagnum fallax is strongly severed for several months after intense drought, probably with some impact on bog net ecosystem exchange (NEE). Interestingly, the response of GPP and respiration was also nonlinear during drought. Before declining, GPP accelerated until the water table declined to about 9 cm below surface, and respiration only initially accelerated and was stable or declined afterward. On average, both processes reached a maximum during early drying and decreased as WT kept falling. The relatively similar timing of these changes lessened the impact on NE at the beginning of drying, which, on average, did not respond until drying days 12 to 18, when the GPP decline had commenced and respiration was still accelerating.
Analysis of the timing showed that GPP fell earlier and more than respiration (see S9), whose decline may seem somewhat unexpected. Water table decline and aeration have been reported to accelerate CO2 release from peat soils (Moore & Dalva, 1993; Yavitt et al., 1997; Öquist & Sundh, 1998). Increased CO2 release was also reported from previous mesocosm experiments that included the moss layer. Respiration increased, on average, by 24% in mesocosms sampled from the dry Mer Bleue Bog and a poor fen at the Experimental Lake Area (Ontario) (Blodau et al., 2004). In mesocosms extracted from Sphagnum- and Polytrichum-rich hollows of a peatland in the UK, respiration increased, on average, by 14% (Dinsmore et al., 2009). In both studies, the water table was lowered from near the moss layer to 30 cm depth; in the study by Blodau et al. (2004), irrigation of the mesocosms continued in the treatments with low water table. Our experiment suggests that, in the absence of such irrigation, a loss of autotrophic moss respiration outweighs raised heterotrophic respiration in the sampled microforms when drought intensifies. Part of the decline in CO2 flux may also be related to dryness of the topmost peat layer, which usually contributes much to heterotrophic respiration (Hogg et al., 1992; Yavitt et al., 1997; Estop-Aragonés & Blodau, 2012). Lafleur et al. (2005) reported that heterotrophic respiration declined with decreasing water content in incubation experiments in bog peats from the topmost layer. Regardless of this potential effect, the antagonism between raised heterotrophic respiration and declining moss respiration may help explain why water table change had little impact on ecosystem respiration in ‘dry’ peatlands (e.g., Lafleur et al., 2005; Knorr et al., 2008).
Aeration of deeper peat layers raised CO2 fluxes in our study when the peat quality, as represented by ΔHI, did not change much with depth (Fig. 9). At such sites, easily decomposable peat was exposed to oxygen and more C was lost over the experiment (see Linje, Kusowo, Migneint; Figs 1 and 10). We conclude that a characterization of changes in peat quality with depth may allow for predicting the response of ecosystem respiration to drought. At present, more work at field sites is needed to substantiate the identified relationships.
Methane exchange
The degassing of CH4 with drought clearly mattered for CH4 fluxes on the annual scale. The cumulative CH4 release averaged 24.3 ± 18.1 g C-CH4 m−2, nearly double the flux of extrapolated predry conditions at 13.8 ± 14.2 g C-CH4 m−2. Dry periods with lower water table may accordingly, and counterintuitively, release additional CH4 compared with constantly wet conditions; in our experiment, only three sites (Rzecin, Borth, and Whim) released less CH4 with the drought. Some reservation regarding this conclusion and the magnitude of the effect is warranted because CH4 fluxes in wet controls do not stay constant and rather increase over time, particularly when graminoid biomass increases (e.g., Gauci et al., 2004a; Knorr et al., 2008; Deppe et al., 2010). Relevant degassing with water table decline has also been reported elsewhere, however, including field studies (Bellisario et al., 1999; Hughes et al., 1999; Dowrick et al., 2006; Dinsmore et al., 2009; Brown et al., 2014). Apparently methanotrophy is slow compared with the transport of the large dissolved CH4 pools stored in peat when air-filled porosity is raised during small WT fluctuations. Our study confirms the relevance of degassing at realistic rates of water table decline across a multitude of bog hollows and thus validates earlier observations by Dinsmore et al. (2009). One may speculate that frequent shorter periods without precipitation could, through degassing, be a scenario with large CH4 release if the conditions are right, i.e., if enough time for the buildup of the soil CH4 pool is allowed between dry periods and if air-filled porosity reaches levels adequate for rapid degassing during dry periods. The interplay between developing air-filled porosity, increased transport of CH4 and oxygen, regeneration of electron acceptors, and inhibition of methanogenesis is highly complex, however, and may lead to very different effects of small soil moisture and water table fluctuations on CH4 dynamics in peat soils, as was demonstrated before (Deppe et al., 2010; Estop-Aragonés et al., 2013).
After rewetting, CH4 emissions did not recover to predry conditions for 200 days in the majority of sites, which suggests that drought substantially lowers CH4 emissions on the annual timescale if not compensated for by CH4 degassing. Bulk density and TRIS content appeared to control the recovery of methanogenesis and CH4 flux (Figs 8 and 9). Release of CH4 into the pore water was faster in more compacted peats, which is in agreement with the idea that lower air-filled porosity and higher volumetric organic matter content promote microenvironments, where the potential of methanogenic archaea for methanogenesis is sustained (Knorr et al., 2008). Higher contents of TRIS were linked to sulfate release during drought (Fig. 7) and subsequently to sulfate reduction and lower CH4 fluxes after rewetting (Figs 8 and 9). The mechanisms controlling this dynamics have been elucidated at individual sites in the past (e.g., Shannon & White, 1996; Knorr et al., 2009; Estop-Aragonés et al., 2013); the results of this study confirm for a large number of sites a partial suppression of CH4 emissions in more sulfate-rich peats after rewetting and under intermediate soil temperatures of 12 °C. Previous studies have demonstrated that sulfate addition constrains methanogenesis when peat is incubated under anoxic conditions (e.g., Dowrick et al., 2006) and that experimental sulfate deposition lowers CH4 emissions when compared with controls at individual field sites (Gauci et al., 2004b and references therein). Hence, it is somewhat surprising that EMAP/IDEM-derived S deposition levels (Pieterse et al., 2007) did not correlate with CH4 flux in this study. In spite of this finding, reduced inorganic sulfur content, regeneration of sulfate, and suppression of methanogenesis after rewetting were linked. In combination, these findings suggest that the suppression of CH4 emissions is more strongly controlled by the local fate and cycling of deposited S than by deposition levels.
Conclusion
The study confirms that CO2 and CH4 fluxes of wet bog microforms are affected by atmospheric N and S deposition. Regression analysis suggested that moderate levels of N deposition up to 15 kg N ha yr−1 elevate moss GPP and respiration and lead to higher C uptake. This was not the case for the site that received deposition of approximately 24 kg N ha yr−1. Even if such levels are not widespread any more, the discontinuity in the relationship argues for further investigating the potential for C loss at long-term N deposition in this range and beyond.
The results further illustrate that intensive drought and rewetting has the potential to strongly alter the C balance of wet microforms. The response of C sequestration to drought in bog hollows appears to critically depend on the magnitude and timing of changes in GPP and respiration. Photosynthesis was, on average, considerably more sensitive to drying than respiration and, as a consequence, the sum of auto- and heterotrophic respiration may decline during intensive drought in wet microforms as well. The response of the cumulative annual C balance of the sampled bog hollows to the drought–rewetting cycle was strikingly variable and ranged from an uptake of 18 g C m−2 to a release of 196 g C m−2. The variability seems to be related to the timing of shifts from increasing to declining C fluxes when drought intensifies. The controls on this timing are, to our knowledge, unknown; more work is needed to elucidate them, for example, by examining soil hydrology and Sphagnum photosynthesis more closely during drought and rewetting across a multitude of sites differing in soil physical properties.
Importantly, drought did not lead to low CH4 emissions on the annual timescale, due to much CH4 degassing in the initial days of drying, when water table was still high. Although occasionally reported, the quantification of this flux under varying hydrologic conditions has not received enough attention so far. We furthermore observed a lag in recovery of CH4 emissions after rewetting exceeding 200 days in the majority of sites. Such a decline has previously been postulated based on inverse atmospheric modeling (Bousquet et al., 2006). The observed lag supports the concept that summer drought in the temperate and boreal zone leads to a lingering decline of the wetland CH4 source on the annual timescale. Our results also suggest that peat sulfur content could play a critical role in this phenomenon. Because inorganic reduced sulfur content in our peats was unrelated to EMEP/IDEM sulfur deposition data, sulfur content in peat soils and its effect on CH4 emissions appear to be modulated by physical soil properties, such as bulk density and related differences in soil hydrology and redox dynamics.
Acknowledgements
The study was funded by the German Research Foundation (DFG) grant BL 563/7-3 to C. Blodau as part of the Research Unit 562 (soil processes under extreme meteorological boundary conditions) and the BiodivERsA-PEATBOG project, whose German subproject was funded by the German Ministry of Education and Research (BMBF) grant 01LC0819A to C. Blodau through ERA-net (European Union's 6th Framework). We thank all agencies and landowners for peatland access. We thank Bjorn Robroek for field support and Polina Bam, Heidi Zier, and Karin Sollner for laboratory assistance and two anonymous reviewers for their constructive comments.


