Revision of methane and carbon dioxide emissions from inland waters in India
Substantial greenhouse gas (GHG) emissions including methane (CH4) and carbon dioxide (CO2) from inland waters have captured international concern (Barros et al., 2011; Bastviken et al., 2011; Raymond et al., 2013; Panneer Selvam et al., 2014). Global freshwaters are consistently oversaturated with CO2 in contrast to atmospheric level resulting in a significant source of atmospheric CO2 (Raymond et al., 2013). Green house gas emissions from global inland waters are reported to be 0.65 Pg of C (CO2 eq) yr−1 as CH4 (Bastviken et al., 2011) and 1.2–2.1 Pg C yr−1 as CO2 (Raymond et al., 2013). However, global estimates are constrained by data paucity and poor coverage of Asia in particular. Recently Panneer Selvam et al. (2014) showed an impressive estimate of GHG emissions from inland waters in India, yielding a substantial revision of GHG emission from global freshwaters. However, the major rivers such as Ganges–Brahmaputra, Indus and Peninsular rivers are not sampled. Hence, rivers were potentially not representative for the whole of India. Moreover, current estimates suffered from data limitation on reservoirs particularly GHG emission from drawdown zone and reservoir downstream (spillways and turbines), where are recognized to be significant carbon emitters (Lima et al., 2008). This should be another major concern, for example, Lima et al. (2008) estimated annual CH4 emission of 14.2 Tg CH4 yr−1 from India's large dams (4005 dams are modeled), and this data could be 33.4 Tg CH4 yr−1 if spillways/turbines are fully considered (Table 1). Of which, 1.1 Tg CH4 yr−1 was from the reservoir surface, three times higher than the current emission from reservoir/barrage (0.33 Tg CH4 yr−1; Panneer Selvam et al., 2014).
| Category of water | Area | CH4 flux | CO2 flux | CH4 emission | CO2 emission | CO2 (eq) | References | |
|---|---|---|---|---|---|---|---|---|
| 103 km2 | mmol m−2 day−1 | mmol m−2 day−1 | Tg yr−1 | Tg yr−1 | Tg yr−1 | |||
| India | Lake & Pond | 3.262 | 4.7 | 2 | 0.09 | 0.1 | 2.35 | Panneer Selvam et al., 2014; |
| India | Riverine wetland | 0.393 | 7.2 | 19.8 | 0.017 | 0.125 | 0.55 | Panneer Selvam et al., 2014; |
| India | River & stream | 29.272 | 7.2 | 19.8 | 1.23 | 9.31 | 40.06 | Panneer Selvam et al., 2014; |
| India | River & stream | 52.6 | 163 | 137.6 | This study | |||
| India | Reservoir & barrage | 17.644 | 3.2 | 8.4 | 0.33 | 2.37 | 10.62 | Panneer Selvam et al., 2014; |
| India's large dams | 14.2 (1.1 from upstream) | Lima et al., 2008; | ||||||
| India | Reservoir & Barrage | 6.27 | 3.08 | 159.83 | This study | |||
| Tropical lakes & reservoirs | 1840 | 54.79 | 1650 | Aufdenkampe et al., 2011; | ||||
| Tropical lakes | 585.536 | 7.8 | 26.6 | Bastviken et al., 2011; | ||||
| Tropical reservoirs | 186.437 | 16.6 | 18.1 | Bastviken et al., 2011; | ||||
| Tropical rivers | 176.856 | 0.87 | 0.9 | Bastviken et al., 2011; | ||||
| Tropical rivers | 146 | 365.30 | 843.33 | Aufdenkampe et al., 2011; | ||||
| Tropical streams | 60 | 621.00 | 586.67 | Aufdenkampe et al., 2011; | ||||
| Tropical wetlands | 3080–6170 | 54.79 | 4106.67 | Aufdenkampe et al., 2011; | ||||
| Total in India | 60.691 | 2.13 | 22.01 | 75.26 | Panneer Selvam et al., 2014; | |||
| Total in India | 9.1 | 141.60 | 369.1 | This study | ||||
| China | Hydropower reservoirs | 28 | 0.32 | 24.8 | 0.46 | 19 | 30.5 | SY Li, QF Zhang, RT Bush, LA Sullivan, under review; |
| Rivers | 189-356.2 | Li et al., 2013; | ||||||
| Lakes | 0.03–77.1 | −15–72 | ||||||
| USA | River & stream | 541.1 | 355.7 | Butman & Raymond, 2011; | ||||
| Global scale | ||||||||
| Rivers | 357.627 | 0.72 | 146.85 | 1.5 | 843.33 | Bastviken et al., 2011; Li et al., 2013; | ||
| Rivers & streams | 536 | 6600 | Raymond et al., 2013; | |||||
| Lakes & reservoirs | 3000 | 1173.33 | Raymond et al., 2013; | |||||
| Lakes | 4200 | 2.94 | 28.81 | 72 | 1943.33 | 3743.33 | Barros et al., 2011; | |
| Reservoirs | 1500 | 7.31 | 41.55 | 64 | 1001 | 2601 | Barros et al., 2011; | |
| Hydropower reservoirs | 340 | 2.01 | 32.23 | 4 | 176 | 276 | Barros et al., 2011; | |
| Hydropower reservoirs | 330 | 9.7 | 278.7 | 521.2 | Hertwich, 2013; | |||
| Lakes & reservoirs | 2800–4540 | 2346.67 | Aufdenkampe et al., 2011; | |||||
| Rivers (60–100 m) | 220–360 | 1100 | Aufdenkampe et al., 2011; | |||||
| Streams (60–100 m) | 90-150 | 953.33 | Aufdenkampe et al., 2011; | |||||
| Wetlands | 4240–15220 | 7626.67 | Aufdenkampe et al., 2011; | |||||
| World large dams | 104.3 | Lima et al., 2008 |
- The CO2 equivalent was calculated as the data for CO2 plus the CH4 data multiplied by 25, on the basis of GWP for CH4 (see Appendix S1).
Here, we identify a gross underestimation of GHG evasion from India with focuses on riverine CO2 emission and GHG from spillways/turbines, providing a revised and arguably more complete account for the emission of GHG from inland freshwaters of India.
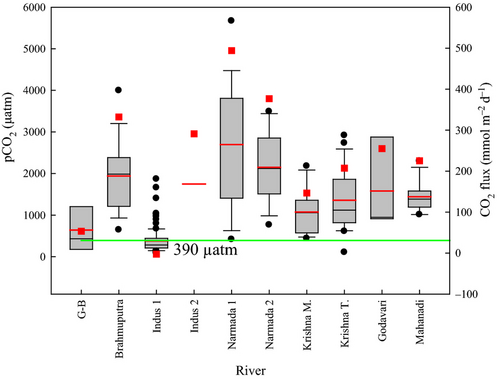
Aqueous partial pressure of CO2 was consistently higher than atmospheric level (ca. 390 μatm), ranging from 640 to 2700 μatm (Fig. 1), hence leading to a CO2 flux ranging from 53 to 494 mmol m−2 day−1 in the major rivers of India. Our estimated area weighted CO2 flux was on average 163 mmol m−2 day−1, which was eightfold higher than the current estimate of 20 mmol m−2 day−1 (Panneer Selvam et al., 2014). Thus, the extrapolated CO2 emission could be 137.6 Tg CO2 yr−1 when the water area of 52 600 km2 for rivers/streams is considered, implying that Indian rivers/streams contributed an extra ca. 117.8 Tg CO2 yr−1 to the global CO2 budget. Our extrapolated flux was 38.7% of CO2 emission from rivers and streams of the United States (ca. 355.7 ± 117.3 Tg CO2 yr−1; Butman & Raymond, 2011).

The estimated 5.94 Tg CH4 yr−1 and 0.71 Tg CO2 yr−1 could be released through spillways/turbines, thus increasing CO2 emission to be 3.08 Tg CO2 yr−1 and CH4 emission to be 6.27 Tg CH4 yr−1 by Indian reservoirs. The estimated CH4 emission was still much lower (ca. 44%) than prior estimate by Lima et al. (2008) (Table 1).
In combination with GHG emission from other aquatic systems in India (Panneer Selvam et al., 2014), we derive that a total of 140.52 Tg CO2 yr−1 and 8.07 Tg CH4 yr−1 was released from India's inland waters. Thus, expressed as CO2 equivalents (eq), 342.3 Tg CO2 (eq) is being emitted from India's water bodies. This is equal to around 193.4% of the estimated land sink of 177 Tg CO2 yr−1 in India. If downstream methane emission of 32.4 Tg CH4 yr−1 is used (Lima et al., 2008), the total GHG emission by India's waters could be 1004 Tg CO2 (eq) yr−1, 5.7 times greater than the land sink of India.
Regional level inaccuracy as a result of data limitation and bias in data distribution is the major source behind huge uncertainties for global scale estimates, i.e. 0.5-1.8 Pg C-CO2 yr−1 by global rivers and streams, and 0.32–0.8 Tg C-CO2 yr−1 for lakes and reservoirs (Barros et al., 2011; Raymond et al., 2013; Table 1). However, by utilizing the updated estimates (see Table 1), we are able to provide a revised estimate of GHG evasion as follows: 1.8 Pg C-CO2 yr−1 for rivers and streams (Raymond et al., 2013); 0.8 Pg C-CO2 yr−1 for lakes and reservoirs (Barros et al., 2011); 103.3 Tg CH4 yr−1 for rivers, lakes, and reservoirs (Bastviken et al., 2011); 100.8 Tg CH4 yr−1 from reservoirs' spillways and turbines. This corresponds to 4.0 Pg C-CO2 (eq)/y. Combining rivers, lakes, and reservoirs with wetland provides a total GHG evasion of 8.9 Pg C-CO2 (eq) yr−1 from all inland waters (2.1 Pg C-CO2 yr−1 is from wetlands (Aufdenkampe et al., 2011); 177.4–640 Tg CH4 yr−1 is from global wetlands if we used the averaged CH4 emission rate in India's wetlands to upscale to global scale, and a surface area of 42.4-152.2 × 10⁵ km2 for wetlands is considered). This implies that methane evasion from inland waters (613 Tg CH4 yr−1) is higher than anthropogenic CH4 source (ca. 450 Tg CH4 yr−1), and CO2 emission from inland waters is 49.5% of global human's carbon source (9.5 Tg C yr−1).
With these revisions, some uncertainty is addressed and enables a more complete, revised estimate of GHGs emissions of some 141.6 Tg CO2 yr−1 and 9.1 Tg CH4 yr−1 is released by India's inland waters. This corresponds to 369 Tg CO2 (eq) yr−1, which is 4.9-fold higher than the current estimate and 2.1 times greater than the estimated land carbon sink of India (Panneer Selvam et al. (2014). To improve on the current quantification of GHGs on a national scale, new and more efforts to measure flux data associated with dams and data through the monsoon season are urgently needed in India and elsewhere in Asia.


