Integrating telemetry with a predictive model to assess habitat preferences and juvenile survival in an endangered freshwater turtle
Summary
- The introduction of predators and habitat destruction is leading to a worldwide decline in freshwater turtles. Here, we assessed the preferred habitat and the predation rates for juveniles of the endangered Mary River turtle (Elusor macrurus).
- Juvenile turtles were fitted with miniaturised transmitters and located accurately over a 21-day period. Water depth and velocity were measured at each locality, and the data used to populate a predictive distribution model (ecological niche factor analysis – ENFA – with Mahalanobis distances). The model showed that the juvenile turtles preferred areas of shallow, slow-flowing water near riffles. Extrapolation of the model throughout the entire river trunk identified a further 49 discrete locations that possessed the environmental characteristics preferred by the juvenile turtles.
- A further 12 juveniles were released with long-life (9 months) acoustic transmitters, and static underwater receivers were deployed to continuously record the presence and absence of turtles. The passive telemetry results supported the ENFA model and also suggested a 50% predation rate of the juvenile turtles over 9 months. Half of the predated turtles were probably taken by fish, whilst the other half were taken by a bird or mammal predator (inferred by changes in the movement of the attached transmitters).
- Combining telemetry with a predictive distribution model showed where juvenile E. macrurus are likely to be found and the riverine features that require preservation to conserve the species.
Introduction
The habitat requirements of juvenile aquatic animals can be very different to those of the adults. Consequently, conservation efforts targeted only at the adults may be ineffective in ensuring the persistence of populations (Kinney & Simpfendorfer, 2009; Ward, Nislow & Folt, 2011). One of the key factors attributed to declining freshwater fish stocks has been the loss/alteration of juvenile habitat (Allan & Flecker, 1993; March et al., 2003; Stickler et al., 2008; Welch et al., 2008), which in turn has been associated with anthropogenic alterations in river depth and stream flow (Poff et al., 1997). The commercial implications of declining fish populations have motivated research into the physical characteristics of juvenile fish habitats (Welch, Ward & Batten, 2004; Armstrong & Nislow, 2006; Barry et al., 2007; Stickler et al., 2008), and the information has guided management for population recovery (Kingsford, 2000; Cooke et al., 2008; Greene et al., 2009; Welch et al., 2009; Simpfendorfer, Wiley & Yeiser, 2010). A similar focus of research would be extremely valuable in aiding in the management and conservation of other threatened riverine animals, such as turtles.
Freshwater turtles are widely distributed in rivers and lakes throughout the world. There are 263 identified species, and the group has undergone serious decline over recent decades (Hoffmann et al., 2010). Current assessments consider that 45% of all freshwater turtle species are threatened, with 28% classified as endangered (Rhodin et al., 2010). Two reasons recognised as being responsible for the current decline are the loss of riverine habitats and the introduction of invasive predators (Rhodin et al., 2011).
The Mary River turtle (Elusor macrurus) of Queensland, Australia (International Union for Conservation of Nature (IUCN), 2011), is the second most endangered freshwater turtle in Australia. It is the sole survivor of an ancient lineage of Australian species (Georges & Thomson, 2006) but, due to its elusive behaviour (hence their generic name ‘Elusor’), and the often poor water clarity in these rivers, they remained undiscovered to science until 1994 (Cann & Legler, 1994).
The geographical distribution of E. macrurus is restricted to the mainstream of the Mary River and its major tributaries (Cann, 1998; van Kampen, Emerick & Parkes, 2006; Flakus & Connell, 2008). The female lays its eggs in sandy banks along the margins of the river, and the nests can be easily identified the morning after they have been laid. As a consequence, the eggs were extensively collected for the pet trade in the 1960s and 1970s − although sold as an already described species (Flakus, 2002). Comparison between the numbers of E. macrurus eggs collected in the 1960s and 1970s with the number of nests presently being laid along the river suggests that the population has declined by c. 95% over the last 30–40 years (Flakus, 2002; Limpus, 2012). Along with egg collection, the extensive anthropogenic modification of the river catchment and introduced predators have likely played an important role in the turtles' demise. River geomorphology, channel structure and stream flow have been modified by sand mining, impoundments, cattle grazing and the clearing of riparian vegetation. Introduced predators (European red fox, Vulpes vulpes; sooty grunter, Hephaestus fuliginosus), as well as some natives (Lace monitor, Varanus varius; white-tailed rat, Hydromys chrysogaster) appear to be doing particularly well in the new riverscape.
In response to the decline of E. macrurus, management has sought to protect the high-density nesting areas from predators and trampling by livestock. As a consequence, hundreds of E. macrurus hatchlings have been entering the Mary River over the past decade (M. Connell, pers. obs.; Flakus & Connell, 2008). It is not yet clear if this intervention has increased population recruitment (i.e. are the young turtles finding suitable habitat in the river in which they can feed and avoid predators), because juvenile turtles are rarely sighted or captured in the wild.
To assess survival and habitat preferences of juvenile E. macrurus, we used remote telemetry to locate them in the river after release. It was logistically unfeasible to capture a sufficient number of juveniles for the study, and therefore, eggs were collected from nesting banks, hatched in the laboratory, and then, the hatchlings were released into the river with transmitters attached. We opted to tag and release turtles within their first and second year of age to assess habitat selection over the first few years of life. To parameterise habitat selection, we measured water depth and water flow at every location a tagged turtle was detected. We also measured the distance of the tagged turtles from the nearest riffle, because these areas have previously been suggested as providing good habitat for juvenile turtles (Cann, 1998).
Methods
Study reach
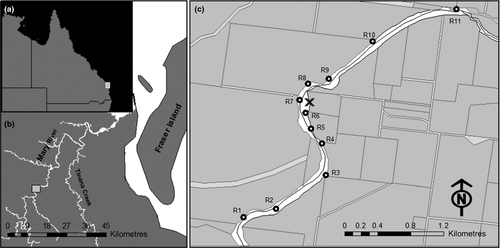
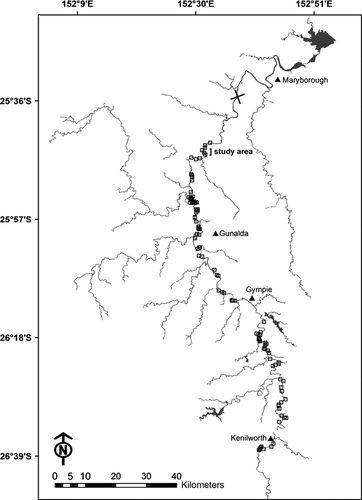
The study was undertaken over a 4.7-km reach of the Mary River, Queensland, Australia (Fig. 1). This short reach of the river was selected because many nests occur in the local area (M. Connell, pers. obs.). It was composed of three pools of varying size (400–1800 m length) and four riffles. The pools were characterised by deep (3–6 m), slow-flowing (c. 0.2 m s−1) water, whereas the riffles were shallow (0.5–1 m depth) and faster flowing (up to 1.5 m s−1). Immediately up- and downstream of the riffles, there were patches of ‘slack’ or ‘back’ water (velocity 0 to −0.5 m s−1). These areas were shallower (0.5–2 m depth) than the pools but also had very slow-moving water (< 0.2 m s−1).
Study animals
Eggs of E. macrurus were collected from four different nests within the study reach in each of 2009 and 2010. The eggs were returned to The University of Queensland (Brisbane, Australia) and incubated under simulated natural conditions. After hatching, the turtles were placed into holding tanks containing gravel, shelters, basking platforms and water at 40 cm depth. The tanks were kept in an outdoor facility, and because the laboratory was close to the Mary River, climatic conditions were similar to those in nature. Water and air temperatures were monitored hourly and were similar for all holding tanks (Hobos TidBit, Onset, MA, U.S.A.). The juvenile turtles were fed a commercial diet (Nutrafin Max, Hagen, Montreal, QC, Canada), blood worms and spinach.
In April 2011, miniaturised transmitters were attached to juvenile E. macrurus of two age groups: 5-month and 16-month old (Table 1).
| Number of individuals | Age upon release (months) | Trans-mitter type | Location moni-toring | Tracking period (days) | |
|---|---|---|---|---|---|
| Group I | 6 | 5 | VHF | Active | 21 |
| Group II | 10 | 16 | Acoustic | Active | 21 |
| Group III | 12 | 16 | Acoustic | Passive | 270 |
Radio telemetry
The VHF-radio transmitters (LT5; Titley Scientific, Columbia, MO, U.S.A; 0.6 g in air, 0.4 g in water, with the dimensions 16 × 7 × 4 mm and a 100 × 0.4 mm antenna) were used to track turtles that were 5 months of age (Group I). The mass of these transmitters represented < 2% of the turtles' body mass (23.9 ± 0.3 g; mean ± SE; n = 6). Each transmitter emitted VHF waves at a frequency unique to each individual and had a projected battery life of 21 days. The transmitters were attached on the posterior left side of the turtles' carapace, using a quick-drying contact epoxy (UltraFix Plus; Ramset, Melbourne, Vic., Australia). The overall tagging procedure took < 5 min.
We would have preferred to tag all the hatchlings with acoustic transmitters, but 5-month-old turtles were too small so VHF-radio transmitters were used instead. Radio telemetry allowed location fixing with the same accuracy as acoustic telemetry, although detection could not be automated. Active tracking was undertaken on a weekly basis.
Acoustic telemetry
Twenty-two acoustic transmitters (V7; VEMCO, Halifax, NS, Canada) were attached to the marginal scutes of 16-month-old E. macrurus. These transmitters (L 20 × D 7 mm; 1.6 g in air) weighed < 2% of the turtle's body mass at this age (86.8 ± 5.1 g in air; n = 22). To attach the acoustic transmitters, a 2.5-mm-diameter hole was drilled vertically through one of the posterior marginal scutes of the carapace, and the transmitter secured with a sterilised plastic nut and bolt (1.5 mm).
The acoustically tagged turtles were themselves divided into two groups (Groups II and III; Table 1). In Group II, the acoustic transmitters emitted a sonic pulse every 60 s encoded with a unique ID number. The projected battery life of these transmitters was 21 days. In Group III, the transmitters also emitted a unique sonic pulse every 60 s, but only switched on for 20 min every 6 h, thus extending the battery life up to 9 months.
To ensure that the VHF and acoustically tagged turtles were swimming and feeding normally, all individuals were returned to the holding tanks and observed for 2 weeks before release. They were then released at the river margins by the nesting bank from where they were collected (Fig. 1).
Passive monitoring of turtle presence and movement
The acoustic signals from Group III turtles (16-month-old juveniles) were detected by static underwater receivers (n = 11, VR2W; VEMCO) deployed throughout 4.7 km of river stretch (Fig. 1c). These were placed to ensure that the middle sections of each pool, plus the areas up- and downstream from riffles, were covered. Each receiver was secured to a concrete anchor (15 kg) and moored to a tree on the river bank by a 6-mm multistrand stainless steel cable. The detection range of each receiver (c. 50 m radius) was determined before the release of the animals, by towing an activated transmitter in a pre-determined pattern away from each receiver and then comparing the received and missing detections with the boat's location. A tagged turtle could not traverse a pool or riffles without being detected. The receivers were collected after 9 months and the data downloaded. The data downloaded from the 11 static underwater receivers were arranged into a single data matrix. This matrix was then subjected to a procedural event log analysis in order to extract and summarise turtle residence time within the detection range of each receiver and turtle movement between receivers. This was executed in the V-Track software (Campbell et al., 2012). A turtle was considered to reside near to a single receiver if it was detected on consecutive transmitter duty cycles (every 6 h).
Environmental variables
Water depth and surface velocity were recorded on a weekly basis where turtles from the Groups I and II were located. First, each turtle was located to within a few metres using either a VHF receiver (Regal 2000; Titley Scientific) and directional Yagi antenna (Group I) or an acoustic directional hydrophone and receiver (VR 100; VEMCO; Group II). The boat was then manoeuvred to be directly above the turtle's location (detection of similar magnitude 360°) and the geographical position (Oregon 550; Garmin, Kansas City, KS, U.S.A.), surface water velocity (Flo-Mate 2000; Marsh-McBirney, Hach Company, Denver, CO, U.S.A.) and water depth (CUDA 300 Portable Sonar; Eagle Marine Electronics, Oklahoma City, OK, U.S.A.) recorded.
To compare the locations of turtles with the habitat available in the river, it was necessary to characterise depth and surface water velocity throughout the reach. Depth and velocity were therefore sampled from 100 locations within the river. These locations were randomly generated from a polygon of the study area using the ‘splancs’ library of functions in R (Rowlingson & Diggle, 1993; R Development Core Team, 2011). The Kriging function in ArcGIS 10 (ESRI, 2011), spherical semivariogram model set to a lag size of 10 m2, was then used to create smoothed surface maps for these two variables throughout the study reach. A raster resolution of 10 m2 was considered sufficient to differentiate spatial changes in water depth and velocity. The centre of each riffle was recorded at its narrowest point, and for each location where a turtle was detected, the distances to the riffle and to the river margin were calculated using the Euclidean distance function in ArcGIS 10. This provided four ecogeographical variables (EGVs) with which to investigate habitat selection: water depth (m), surface water velocity (m s−1), distance to the nearest riffle (m) and distance to the nearest river margin (m).
Habitat suitability modelling
To test whether the tagged E. macrurus were selecting their habitat, we used an ecological niche factor analysis (ENFA). This ‘presence-only’ model of habitat selection compares the distribution of ecogeographical variables at localities occupied by the turtles against the available habitat within the study reach. This minimises multicollinearity and redundancy by extracting the relevant ecological information from a set of environmental variables and is particularly useful when the species of interest is rare or cryptic (Guisan & Zimmermann, 2000; Hirzel, Helfer & Metral, 2001; Hirzel & Arlettaz, 2003). Similarly to principal components analysis (PCA), ENFA determines the relationships between variables and finds combinations of these variables that produce uncorrelated indices or components. Unlike PCA, however, the components in ENFA have direct ecological meaning (Bryan & Metaxas, 2007). In ENFA, the environmental niche of a species is described by two indices. The first, termed ‘marginality’, describes the difference between the means of cells occupied by a turtle in relation to that of the whole study reach. For each ecogeographical variable, a marginality coefficient (mi) is calculated. Marginality values close to minus or plus one indicate a high preference for areas below and above, respectively, the mean habitat available for that ecogeographical variable. Values close to zero indicate little or no habitat preference. The second index, termed ‘specialisation’, describes how restricted the selected habitats were, relative to the overall range for each ecogeographical variable within the study reach. A specialisation coefficient (λi) is also calculated for each ecogeographical variable, whereby the closer the index for this variable is to 1, the more restricted is the range of the animal for that ecogeographical variable (Hirzel et al., 2002).
 (1)
(1)where ‘V’ is the number of ecogeographical variables in the analysis. Large values of global marginality (≥ 1) indicate that the species is not equally represented in all habitats.
 (2)
(2)where ‘S’ ranges from 1 to ∞, with the niche becoming narrower as S increases (for details on ENFA mathematical procedures, see Hirzel et al., 2002). Environmental data were imported into R as a raster-based grid, and the ENFA was undertaken using the package adehabitatHS (Calenge, 2006). The variable ‘depth’ was normalised through the ‘box-cox’ algorithm (Sokal & Rohlf, 1981). The Monte Carlo test was used to assess the significance of the marginality and specialisation results (Basille et al., 2008). In this test, 1000 sets of juvenile turtle locations were generated randomly throughout the study reach. For each set of locations, marginality and specialisation eigenvalue scores were calculated and the actual values compared with these random distributions.
Generating habitat suitability maps
A habitat suitability map was generated for the study reach based upon the range of ecogeographical variables for which the juvenile E. macrurus were tracked (Groups I and II). This was calculated in the adehabitatHS package in R using the squared Mahalanobis distances (i.e. the multivariate distances between the mean niche of the study species and the habitat components at each mapped location; see Calenge et al., 2008). In this map, the suitability values were rescaled using the isopleth method, ranging from 0 (unsuitable) to 100 (highly suitable). In addition, turtle residence time within the detection range of each underwater acoustic listening station was compared against a randomised distribution, also within these detection areas, using the area under the curve (AUC) metric, in the ‘ROC’ package in R (Sing et al., 2009). The AUC score ranges from 0.5 to 1.0. Values over 0.5 are deemed significant, and values closer to the theoretical maximum of 1.0 indicate an ideal predictive model.
Assessing model accuracy over extended periods of time
The long-term data collected from passive acoustic receivers were used to assess turtle survival, as well as to test the accuracy of the habitat suitability model over an extended period (9 months). This was based upon the mean habitat suitability score for the detection range of each receiver (radius = 50 m). Performance was assessed by a Poisson generalised mixed model (GzLMM), using ‘lmer’ package in R (Bates, Maechler & Bolker, 2012), with habitat suitability score implemented as a fixed effect, residence time as the response variable and turtle ID as a random effect.
Results
Turtle movement and survival
A total of 48 location fixes were obtained by active location monitoring (Group I = 18, Group II = 30). Upon release into the river, 80% of the turtles moved downstream, whilst the rest moved to the upstream riffle and beyond. Most turtles took up residence close to the riffle nearest to the release site and were detected there for the remainder of the transmitter battery life. Eight juveniles crossed the riffles immediately up- or downstream from the release site 2–4 months after release (Fig. 1). One of those turtles travelled 2.5 km to the upstream area of the next downstream riffle and remained there for the rest of the study. One juvenile from Group III was detected 1.8 km upstream from the release site after 6 months and remained in the immediate vicinity of this riffle. Of Groups I and II, all turtles were present in the study area after 21 days.
The duty cycling transmitters attached to Group III enabled detection of these turtles over 9 months. Of this group, one transmitter disappeared after 6 weeks, others after 3 and 5 months and another after 7 months. These turtles had probably been eaten by predators, because the transmitters were not detected by the most up- or downstream receivers, and additional active tracking beyond the limits of the study reach failed to detect them. After 7 and 8 months, further two transmitters shifted from maximum daily movements of < 50 m to over 8 km. This rate of movement is too quick to be undertaken by juvenile turtles, and we suspect these individual had been eaten by a larger animal, for example, freshwater eel (Anguilla reinhardtii), sooty grunter (Hephaestus fuliginosus), Mary River cod (Maccullochella peelii mariensis), fork-tailed catfish (Arius graeffei) or water rat (Hydromys chrysogaster).
Ecological niche factor analysis
This analysis (ENFA) was performed using the four variables, depth, surface velocity, distance to the nearest riffle and distance to the nearest river margin (Table 2). The analysis produced a global marginality factor of 3.2, demonstrating that the ecogeographical variables (EGVs) at the turtle locations differed from random, and a specialisation eigenvalue of 10.3, illustrating that the EGV variance within the available habitat was 10 times higher than the variance within the EGVs selected by the turtles. The Monte Carlo test (n = 1000 iterations) confirmed that the EGVs selected by the turtles were significantly different from computer-generated random distributions (P = 0.014).
| EGVs | Marginality factor (3.2) | Specialisation factor (10.3) |
|---|---|---|
| Depth | −0.790 | 0.135 |
| Surface water velocity | −0.212 | 0.801 |
| Distance to riffles | −0.427 | 0.577 |
| Distance to river margin | −0.383 | 0.078 |
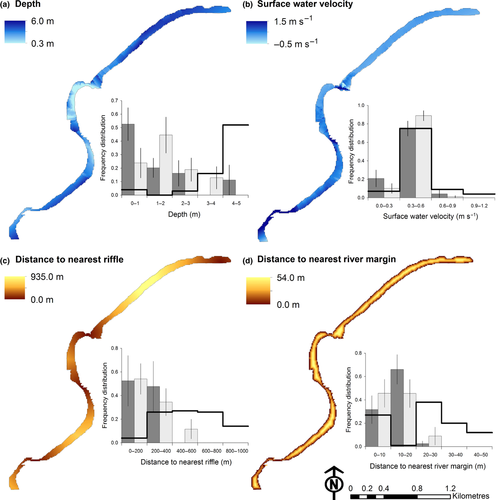
Five-month-old E. macrurus were primarily located in water < 1 m depth, whilst the 16-month-old E. macrurus were primarily located in water between 1 and 2 m depth (Fig. 2a). The ENFA marginality coefficient for depth (Table 2) confirmed that juvenile E. macrurus selected shallower locations than the mean available throughout the river channel. The specialisation score for water depth was close to zero, however, showing the variability in the depth selected by the turtles was high compared with that in the environment. The tagged turtles selected locations with a narrow range of surface water velocity (0–0.6 m s−1), and this was similar to the mean surface water flow available overall (Fig. 2b). This resulted in a marginality factor close to zero and a high specialisation factor for surface water velocity (Table 2). The maximum distance from a riffle within the study reach was 900 m, but turtles were never located more than 400 m from a riffle (Fig. 2c). The results of ENFA confirmed that juvenile E. macrurus selected areas close to riffles (Table 2). The channel near riffles is narrow, and, as a consequence, turtles were rarely farther than 20 m from the river bank (Fig. 2d). Results of ENFA confirmed that the distance to the nearest river margin had a significant effect upon the niche selection of juvenile E. macrurus (Table 2).
Habitat suitability map
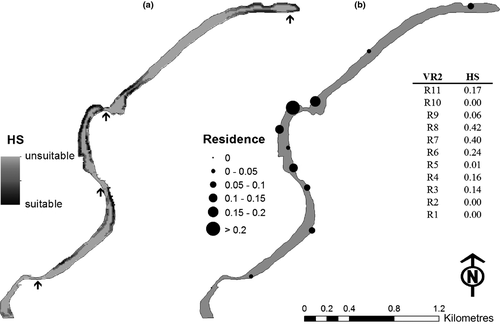
The most suitable habitat for juvenile E. macrurus was marginal areas immediately up- or downstream of a riffle (Fig. 3a). These areas were shallow and had a low surface water velocity. The riffles themselves, which are characterised by fast-flowing water, were not suitable habitat for juvenile E. macrurus as assessed by the model. Similarly, deep water and pools were not suitable habitats.
To test model accuracy, we used the turtle location data collected by the static acoustic receivers over 9 months (Group III). The receivers closest to riffles detected most turtles (Fig. 3b). A habitat suitability score was calculated for the detection area of each receiver, and there was a significant relationship between suitable habitat and turtle residence time ( = 7961.2; P < 0.01). Comparing the model against a random distribution showed that the model significantly predicted turtle location (AUC = 0.65). Extrapolation of suitable habitat for juvenile E. macrurus throughout the Mary River catchment, based upon the location of riffle-pool sequences, revealed 49 discrete locations (Fig. 4). These areas were distributed throughout the length of the river, but two stretches lacked suitable habitat: a c. 15-km section near the town of Gympie and a c. 24-km area upstream from the river barrage.
Discussion
All juvenile Mary River turtles (Elusor macrurus) released during the present study moved to, and remained within, slow-flowing shallow water immediately adjacent to riffles. These turtles were released upon the nesting bank where the eggs were laid and, as a consequence, entered a section of the river characterised by deep, slow-flowing water. None of the turtles remained there, but instead moved towards riffles. Many stopped at the first riffle encountered but some travelled many kilometres from the release site before settling. Regardless, all tagged and released turtles selected shallow slow-flowing water immediately up- or downstream side of a riffle. Once located in these areas, the turtles stayed in the vicinity for the remainder of the study (9 months).
Depth was the most significant EGV within the ENFA model predicting the location of turtles. This makes biological sense for a juvenile turtle because transit time between the surface and substratum would be reduced and therefore so would energy expenditure when surfacing to breathe. The concentration of dissolved oxygen is reduced with depth in tropical rivers, and therefore, oxygen availability would be higher at the substratum in shallow that in deep water (Walker, 1985; Bodie, 2001). This is important because E. macrurus satisfies part of its metabolic demands through aquatic respiration. Therefore, dive duration would be increased at locations with a higher partial pressure of oxygen, reducing the number of surface visits required as well as minimising time at the surface (Clark, Gordos & Franklin, 2009). All these depth-related factors would serve to reduce the time the young turtles would be out of their refuges and exposed to aerial and aquatic predators.
The ENFA model demonstrated that it was the shallow water near riffles that was the favoured habitat and not shallow water per se (shallow water can be also found at the margins of deep pools). An explanation for this preference may come from the turtle's morphology, physiology and diet. Turtles are not streamlined and have a low tolerance of sustained exercise (Marvin & Lutterschmidt, 1997; Du, Zheng & Shu, 2006; Clark, Gordos & Franklin, 2008; Micheli-Campbell et al., 2011). Therefore, by selecting slack water, they avoid displacement whilst swimming and surfacing, reducing energy expenditure. Gut flushing of a limited number of captured juvenile E. macrurus showed that they feed upon green algae and aquatic invertebrates (Flakus, 2002). Algal growth would be significantly higher near riffles because water turbidity in deep pools would reduce light penetration and prevent algal growth. Riffles are characterised by fast-flowing water, which prevents sedimentation, and as a consequence, the substratum around riffles tends to be composed of larger rocks and boulders rather than mud (Poff et al., 1997). These rocks are a stable and sediment-free substratum for algal growth. Therefore, invertebrate grazers are likely to be more abundant near riffles compared with deep pools.
Survival of juvenile turtles in their favoured habitat was fairly high (50%). Freshwater turtles have been recorded in the diet of the water rat (Hydromys chrysogaster) and white-bellied sea-eagle (Haliaeetus leucogaster) (Woollard, Vestjens & MacLean, 1978; Woodall, 1982; Olsen, Fuentes & Rose, 2006), and both predators were regularly sighted foraging within the study reach (Micheli-Campbell, personal observation). Both these predators are known to remove their prey from the water before eating, and therefore, the sudden disappearance of the acoustic transmitters from the river is evidence of the turtle's fate (the turtles could not have emigrated outside the study area without being detected). Two transmitters disappeared at night, suggesting the water rat as a likely culprit, and two disappeared during the day, suggesting a visual predator such as a bird. Two transmitters exhibited a sudden increase in the extent and rate of daily movement, beyond what could be expected by a juvenile turtle. We suggest that these turtles were ingested by a fish with a large gape, such as the freshwater eel, Mary River cod, fork-tailed catfish or sooty grunter.
The Mary River possesses many stretches composed of riffle-pool sequences. These tend to be aggregated, however, and there are also long stretches without a riffle-pool sequence. Riffle-pool sequences are also absent from sections of the river where impoundments have been created. This may be a reason why E. macrurus nests are not commonly found in such areas (Connell, personal observation) and why the adult E. macrurus are never found inhabiting temporary wetlands or artificial waterbodies within the catchment (Limpus, 2012).
Elusor macrurus nesting sites are heterogeneously distributed throughout the catchment (Limpus, 2012), and we suggest that proximity to riffle-pool sequences, as well as nesting bank composition, may determine nest site selection. Management and conservation actions for the Mary River turtle should consider the maintenance of stream flow and the preservation of the nesting sandy banks and riffle-pool sequences.
The study demonstrated a methodology by which critical habitat could be assessed for a cryptic riverine species. As far as we are aware, this is the first time that data collected by static acoustic receivers have been used to validate a predictive distribution model. This technique has great potential for defining critical habitat for other riverine species over extended periods of time.
Acknowledgments
This research was funded by a scholarship to M.A.M.C. from Tiaro & District Landcare Group and an Australian Research Council Linkage Grant to C.E.F. We thank TDLG for field assistance, R.L. Cramp and K. Rudland for turtle husbandry and D. Booth and M. Gordos for advice throughout. We thank the journal reviewers for their criticism and detailed comments, which have greatly improved the manuscript. This study was conducted under ethical approval from Queensland Department of Environment and Resource Management (SPP-WISP02255909) and The University of Queensland Animal Ethics Committee (AEC-SBS/076/09/TIARO & DISTRICTLANDACREGROUP).


