Fatigue crack growth behavior in an aluminum alloy Al–Mg–0.3Sc produced by wire based directed energy deposition process
Abstract
Additive manufacturing (AM) of Al–Mg–Sc alloys has received considerable interest from the aerospace industry owing to their high specific strength and suitability for AM processes. This study has investigated the fatigue crack growth behavior in an Al–Mg–0.3Sc alloy made by wire and arc additive manufacturing. Tests were conducted with two different crack orientations at cyclic load ratios of 0.1 and 0.5. At the lower load ratio, the horizontal crack showed a faster growth rate owing to the smaller grains and coarser second-phase particles that the crack tip had encountered when it propagated along the material build direction. The anisotropy in crack growth rate was mainly caused by the grain size effect. When the applied stress intensity factor range exceeded the value of 10 MPa m1/2, an isotropic crack growth rate between the two crack orientations was measured. This is due to the microstructural influence being overcome by the governing parameter of fracture mechanics. At the higher load ratio of 0.5, crack growth rate is isotropic, and the threshold stress intensity factor range was much lower than that tested under load ratio 0.1. Finally, the modified Hartman–Schijve equation has been successfully employed to represent the crack growth rates in all three regions.
Highlights
- A newly developed aluminum alloy by a wire-based additive manufacturing process;
- Grain size and second-phase particle distribution affect the fatigue crack growth rate;
- A modified equation to be employed to represent the experimental data.
1 INTRODUCTION
The aerospace industry is increasingly adopting additive manufacturing (AM) technologies to produce complex and large-scale structures owing to their benefits of reducing the buy-to-fly ratio (the mass ratio of the raw material to the final finished part) and shorter lead times, resulting in cost savings compared to conventional manufacturing processes.1 Wire and arc additive manufacturing (WAAM) is a directed energy deposition (DED) AM technology capable of producing large-scale metallic components with a high deposition rate and complete raw material usage. WAAM aluminum alloys has recently received particular attention from the aerospace industry.2-4 Among them, the Al–Mg alloys (a 5xxx series aluminum alloy) that have good weldability, moderate strength, and light weight along with excellent corrosion resistance are attractive to the AM and aerospace industry.5 Moreover, their strength can be increased via solution strengthening without post heat treatment, avoiding final structural distortion and prolonged heat treatment time.5 Currently, WAAM Al–Mg alloys can achieve yield and ultimate tensile strengths of approximately 150 MPa and approximately 300 MPa, respectively, which are still lower than the conventional and other AM made heat-treatable Al alloys.2, 6 However, in order to achieve better properties, more Mg content is required, which may bring other issues such as stress corrosion cracking7 and loss of Mg due to vaporization during WAAM process.8
An effective way of increasing the static strength of Al–Mg alloys is through alloy modification.9 It is well documented that the addition of scandium (Sc) and zirconium (Zr) elements to Al alloys can bring two important metallurgical changes. First, they develop finely dispersed Al3(Sc,Zr) equilibrium precipitates during the solidification, which will act as heterogeneous nucleation sites in the α-Al matrix, resulting in grain refinement. Second, the secondary Al3(Sc,Zr) phase that can form during aging provides further strengthening to the α-Al matrix.9-12 Since Al3(Sc,Zr) leads to grain refinement, remarkable improvement in strength can be achieved via precipitation strengthening (e.g., 100% increase in yield strength and 40% in ultimate tensile strength compared to similar materials without Sc).13, 14 Sc addition is also shown to have beneficial effect on weldability and resistance to hot cracking.9 The morphology, size, and distribution of Al3Sc precipitates are greatly influenced by the cooling rates.15 Slower cooling rates of approximately 1 K s−1 resulted in cubic shaped Al3Sc particles due to faceted growth, whereas higher cooling rates (100 and 1000 K s−1) led to non-faceted growth and cubic shaped Al3Sc particles with a cellular-dendritic sub-structure.15 In the as-built condition, the rapid cooling rates in the laser power bed fusion (L-PBF) Al–Mg alloy modified through Sc and Zr addition showed a very fine grained bi-modal microstructure and considerably higher strength compared to the material without Sc and Zr addition.16-20 Wang et al. studied effect of cooling rate by varying the thermal history on microstructure and mechanical properties of an Al–Mg alloy modified through addition of Sc and Zr and built by powder feed laser-DED process.21 Lower cooling rates (102 K s−1) has resulted in uniform equiaxed grain structure. Higher cooling rates (103 K s−1) promoted the enrichment of Al3(Sc,Zr) nucleation sites ahead of the solidification interface and led to heterogeneous grain structure. The presence of precipitates in higher cooling rate materials helped to achieve two times higher yield strength compared to slower cooling rate materials.21 Ren et al. studied the influence of Sc content on the tensile properties of WAAM Al–5Mg alloys.22 When the Sc content was <0.15%, no grain refinement was observed as Sc was fully dissolved in the α-Al matrix. An optimal Sc content of 0.3% was proposed, which has resulted in significant grain refinement leading to increases in the yield strength, ultimate tensile strength, and elongation at failure to 270 MPa, 372 MPa, and 22.5%, respectively.22
WAAM Al–Mg alloys have found increasing numbers of industrial applications, including the automotive and aerospace industries,23 where design for durability and damage tolerance is often mandatory. It has been found that the microstructure, including grain morphology and second-phase particles, plays a crucial role in the fatigue performance of Al–Mg alloys. The grain size effect was investigated by a few researchers. For conventionally processed Al–Mg alloys, Roder et al. found that addition of Sc reduced the grain size and increased the fatigue crack growth rate (FCGR) compared to Al–Mg alloys without Sc.24 A higher crack growth rate was attributed to a straight and smoother crack path (no crack deflection) in samples with smaller grains.24 Similar findings were also made where Al–Mg alloys with smaller grains showed a higher FCGR than the material with larger grains.25 A slower crack growth rate in material with larger grains was attributed to micro-scale crack path deflections that were manifested by rougher crack surfaces. In terms of the second phase particles, it has been reported that coarse secondary phase particles can act as crack nucleation sites in the high cycle fatigue regime.26, 27 Coarse second phase particles can also accelerate FCGR.28, 29 In general, Al–Mg alloys consist of coarse secondary phase particles containing rich Fe/Mn, which are comparatively brittle and easily detached from the matrix.
Based on the literature review, the microstructure characteristics of Al–Mg–Sc alloys, including the grain size and secondary phase particle size and distribution, are influenced by the cooling rates in the AM process, which can affect the fatigue crack growth behavior. Therefore, it is important to understand the fatigue crack growth performance of WAAM Al–Mg–Sc alloy, which has the potential to be used in aerospace structures where damage tolerant properties are required. So far, no open literature has been found on the fatigue crack growth behavior of WAAM Al–Mg alloys with Sc addition. Therefore, this study was aimed at investigating the fatigue crack growth behavior of a WAAM Al–Mg–Sc alloy with two main objectives. First, FCGR in two different crack orientations and at two cyclic load ratios, 0.1 and 0.5, microstructure influence was examined to explain the experimental test results. Second, implementation of an existing empirical equation to represent the crack growth rates, including the threshold and the fast crack growth regions, for design analysis.
2 MATERIAL AND EXPERIMENTAL METHODS
2.1 Material manufacturing and microstructure analysis
Al–Mg–Sc wire with the chemical composition presented in Table 1 was used to deposit a wall of 500 mm long, 150 mm high, and 5 mm thick on a substrate plate made of wrought aluminum alloy 6082. The wall was built using the Cold Metal Transfer-Advanced (CMT-Adv) process and a single bead deposition strategy. The CMT-Adv process can adjust deposition rate more precisely via the negative and positive process cycles. The processing parameters are as follows: torch traveling speed 10 mm s−1, wire feeding rate 6 m min−1, and local shielding gas (argon) flow rate 20 L min−1.
| Element (wt%) | Mg | Sc | Si | Fe | Cu | Mn | Zn | Ti | H (ppm) |
|---|---|---|---|---|---|---|---|---|---|
| Wire | 6.4 | 0.3 | 0.05 | 0.09 | 0.0022 | 0.72 | 0.017 | 0.14 | 5.8 |
| Deposited wall | 6.3 | 0.3 | 0.05 | 0.08 | <0.01 | 0.72 | 0.017 | 0.14 | 0.8 |
Microstructure analysis was carried out in the ND–TD and WD–ND planes (see Figure 1A) using an optical microscope and a scanning electron microscope (SEM). Samples were prepared with standard metallographic procedures, including mounting, grinding with SiC paper down to 2500 grit size, and polishing using diamond suspension to a 1 μm finish, followed by final polishing with colloidal silica with a 0.02 μm particle size. Samples were etched with Keller's agent (2%–3% nitric, 1%–2% hydrochloric, and 1% fluoric acid) for 10–20 s. Grain size measurement was performed on the optical micrographs by following the line intercept procedure outlined in the ASTM E112 standard, which involves an actual count of the number of grains intercepted by a test line or the number of grain boundary intersections with a test line.30

2.2 Fatigue crack growth testing
Ten compact tension, C(T), samples were extracted in two crack orientations by using wire electric discharge machining. The horizontal (H) crack propagates in parallel with the build layers, and the vertical (V) crack propagates across the build layers. The sample extraction plan, geometry, and dimensions are presented in Figure 1. Sample dimensions and fatigue crack growth testing were according to the ASTM E647 standard.31 All the tests were conducted at room temperature using a standard sinusoidal waveform with a cyclic load ratio (R) of 0.1 and 0.5. Five samples were tested in each crack orientation: three at R = 0.1 and two at R = 0.5. Prior to testing, the anticipated crack path was polished to improve crack visibility. Crack length (reference point defined from the load line) was measured by a traveling microscope with 7× objective magnification with an accuracy of ±0.01 mm. All samples were pre-cracked to 1 mm to minimize the effect of notch shape.
First, the K-decreasing test was conducted at a 40 Hz loading frequency to obtain the threshold stress intensity factor range (∆Kth) using the load shedding procedure outlined in the ASTM E647 standard.31 The test started at a ∆K value equal to a pre-cracking load of 0.6 kN. The loading was subsequently decreased as the crack grew, and it ended when the crack growth rate da/dN was below 10−10 m/cycle, as stated in ASTM E647.31 Second, the K-increasing test was carried out under a constant maximum load of 0.6 kN at a 20 Hz load frequency until the sample fractured. FCGR was deduced from the measured data of crack length versus number of load cycles using the seven-point incremental polynomial method for the majority of data points and the secant method for the threshold and fast crack growth regions (i.e., the first three and the last three data points of the crack length vs. cycle curve). Both data reduction methods are recommended by ASTM E647. After the crack growth test, selected samples were used for crack path analysis using an optical microscope. For this, samples were prepared along the WD–ND plane (Figure 1), following the same grinding, polishing, and etching procedures outlined above.
The measured crack growth rates were subsequently fitted by the modified Hartman–Schijve equation (modified H–S eq.) to represent the material property using a formula for engineering design purposes. This equation, introduced by Jones et al.,32, 33 takes account of the R ratio and the asymptotic trend at the extreme values of ∆K.34
3 RESULTS AND DISCUSSION
3.1 Microstructure analysis
Figure 2A shows optical macrographs along the ND–WD and ND–TD planes. The microstructure along the build direction shows two distinct regions, namely, the “fan”-like region and the uniform region, which are the consequence of layer-by-layer deposition and complex thermal cycles. Figure 2B shows high magnification images of the fan-like region with a typical microstructure revealing different grain size regions consisting of both coarse and fine grains, while Figure 2C shows the uniform region having a relatively homogeneous grain size. Figure 2D revealed a grain size distribution of 8.6 ± 3.6, 55.7 ± 17.3, and 18.3 ± 5.2 μm in the fine, coarse, and uniform regions, respectively. Hence, fan-like regions with inhomogeneous grain size and uniform regions with homogeneous grain size across the layers are observed.
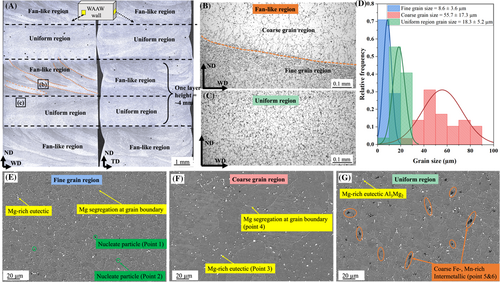
Figure 2E–G presents SEM-backscattered (BS) mode images along the ND–WD plane, showing fine and coarse grain regions corresponding to fan-like regions and uniform regions. Bright particles can be observed in all three images. Fine dark particles are seen in both the fine and coarse grain regions, while large dark needle-like particles are seen only in the uniform region. To further elucidate the above microstructure features, energy-dispersive X-ray (EDX) was performed to characterize these particles at six selected points across the fine, coarse, and uniform regions as highlighted in these figures, and the results are presented in Table 2. In all the regions, bright and net-like grain boundaries consist of Mg-rich particles (scan Points 3 and 4), which are likely to be Al3Mg2 precipitates. Similar precipitates were reported in a L-PBF-processed Al–Mg–Sc–Zr alloy.35 In Figure 2E, fine particles (scan Points 1 and 2) are detected, which may be Ti-rich precipitates, such as Al3Ti, with a trace amount of Sc; these particles can act as grain nucleation sites during the solidification and thus produce finer grains36; as Figure 2G shows, coarse needle-like second phase particles (Points 5 and 6) of more than 20 μm long are characterized as Fe, Mn-rich precipitate, and Al6(Fe,Mn). These particles are hard and brittle.37
| Scanning location | Al | Mg | Ti | Mn | Fe | Sc |
|---|---|---|---|---|---|---|
| Point 1 | 70.7 | 7.8 | 9.7 | 2.9 | 0 | 1.7 |
| Point 2 | 65.7 | 8.0 | 9.6 | 3.0 | 0 | 1.0 |
| Point 3 | 90.3 | 9.7 | 0 | 0 | 0 | 0 |
| Point 4 | 91.1 | 8.9 | 0 | 0 | 0 | 0 |
| Point 5 | 59.9 | 1.4 | 0.4 | 16.9 | 14.4 | 0.2 |
| Point 6 | 61.1 | 1.9 | 0.2 | 17.9 | 12.7 | 0 |
3.2 Fatigue crack growth behavior and analysis
Experimental test data in terms of crack growth rate (da/dN) versus applied stress intensity factor range (∆K) for R = 0.1 is presented in Figure 3A with a zoomed view in Figure 3B. Comparison with literature data on a similar Al–Mg–Sc alloy processed by L-PBF39 and a conventional cold rolled alloy.25 WAAM material shows a higher value in the threshold stress intensity factor range ∆Kth (average ∆Kth ~1.8 MPa m1/2 for vertical cracks and 2.7 MPa m1/2 for horizontal crack samples) compared to the L-PBF material (average ∆Kth ~1.2 MPa m1/2),38 indicating that the WAAM material exhibited higher resistance to the onset of fatigue crack propagation. This can be attributed to the coarser grains (>5 μm) in the WAAM alloy due to lower cooling rates compared to the finer grain size (<2 μm) in the L-PBF alloy.38 Coarser grains result in noticeable crack path deflection and a greater level of crack closure, hence a lower crack growth rate.39, 40 When ∆K is greater than 5 MPa m1/2, the L-PBF alloy's crack growth rate is comparable with the current study as the grain size effect is overcome by the mechanical factors (the stress intensity factor) near and within the Paris law region. L-PBF is prone to process inherent tensile residual stresses due to the faster cooling rates compared to the WAAM process.41 It is well documented that tensile residual stresses will increase the crack growth rate.42 Previous studies on L-PBF AlSi10Mg near-net shape built C(T) samples showed very low residual stresses of 30 MPa that did not significantly influence crack growth rate.43 On the other hand, the lower cooling rates associated with WAAM results in much lower residual stresses compared to the L-PBF process.44 An important point to make is that fatigue test samples built by L-PBF are near-net shape, so residual stress is kept in the samples, while the WAAM samples used in this study were extracted from a much larger “wall”; sample extraction has further reduced residual stress to virtually zero that has negligible impact on FCGR.45
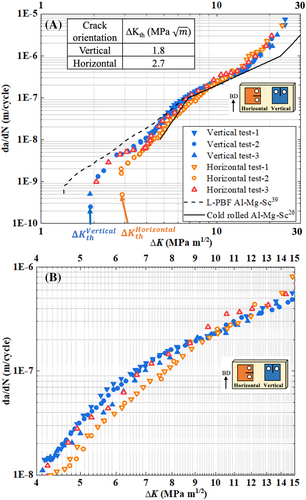
Conventional cold-rolled Al–Mg–Sc alloy,25 on the other hand, shows a different trend: it initially had a comparable crack growth rate, only marginally lower than that of the current WAAM material near and within the Paris law region. When ∆K is greater than 15 MPa m1/2, the cold-rolled material continued to keep the stable crack growth while the WAAM material entered the fast crack growth stage and failed. This is due to the altered grain orientation against the crack propagation direction after rolling25; hence, it postponed the fast crack growth stage and increased the resistance to cyclic failure (the maximum stress intensity factor range being 40% greater than that of the WAAM material).
The following observations can be made: First, all test data fall into a typical sigmoidal curve pattern showing three distinct regions of fatigue crack propagation. The first (far left) has a very slow crack growth rate when the applied stress intensity factor range ∆K is closer to the threshold stress intensity factor range ∆Kth.46 It is observed that in the WAAM material, the ∆Kth value is influenced by the crack orientation. The horizontal crack samples showed a higher ∆ value of 2.7 MPa m1/2, whereas the vertical crack samples showed a lower average value of ∆ of 1.8 MPa m1/2. The second region is the Paris law region, and the third region (far right) is where the crack growth rate increased rapidly, leading to final fracture failure.46 There is no significant difference between vertical and horizontal directions in the maximum values of the stress intensity factor range at failure nor the crack growth rates in the Paris law region. This demonstrates that the microstructure difference is overcome by the mechanical factor ∆K when it is greater than 10 MPa m1/2.
Secondly, crack growth rate anisotropy is observed in both the near-threshold region and the lower ∆K region (∆K < 10 MPa m1/2); the linear part (5 MPa m1/2 < ∆K < 20 MPa m1/2) follows the Paris law relationship.46 The horizontal cracks showed a lower crack growth rate than the vertical crack samples. For the horizontal cracks, there is a discrepancy between “test-3” and the other two tests, which will be discussed in the following paragraph.
In order to explain the anisotropy in ∆Kth and crack growth rate in the near-threshold and lower ∆K region (∆K < 10 MPa m1/2), microstructural effects in terms of grain size and morphology were considered. Crack paths were analyzed using an optical microscope as described in Section 2.1. Figure 4 shows schematics of the crack orientations and microstructural images with the crack path in different regions. Figure 4A1–A3 shows that the vertical crack passes through the fan-like and uniform regions alternately. The fan-like regions consist of fine and coarse grains zones with an average grain size of 8.6 ± 3.6 and 55.7 ± 17.3 μm respectively, while the uniform regions contain much smaller grains of 18.3 ± 5.2 μm.
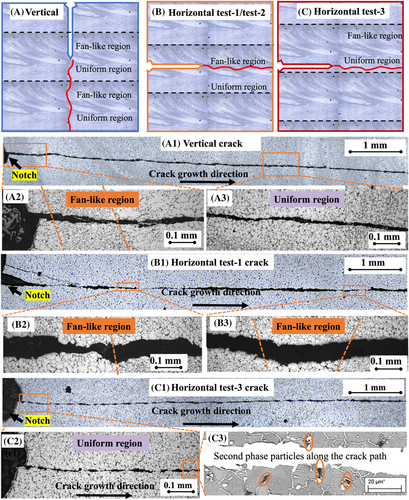
In contrast, Figure 4B1–B3 shows the horizontal crack (test-1 and test-2) passed through only the fan-like regions since the starter notch was in the fan-like region. Overall, the horizontal cracks (test-1 and test-2) propagated in average larger grains along the entire crack path compared to the vertical cracks. Both ∆Kth and crack growth rate can be influenced by the grain size and morphology.47-49 Previous studies on an aluminum alloy 2524 showed that the samples with coarser grains showed a larger crack closure effect caused by crack surface roughness compared to samples with finer grains; therefore, coarser grains resulted in a higher ∆Kth and a lower crack growth rate. In addition, coarser grains also caused crack path deflection, which changed the pure mode-I crack growth to mixed mode; consequently, the crack growth driving force, that is, the mode-I stress intensity factor range, was reduced, which also contributed to the reduced crack growth rate.39, 50 As a result, the lower crack growth rate of the horizontal cracks (test-1 and test-2) was measured compared to the vertical cracks. Since ∆Kth increases linearly with the grain size in log scale,51 the average value of is higher than that of .
Horizontal crack “test-3” was an exception (rather than a case of test data scatter). Optical micrographs in Figure 4C1–C3 shows the starter notch tip was in the uniform region; therefore, crack propagated through this region only, which consisted of only finer grains (<20 μm), leading to a smoother crack path with no visible crack path deflection. As a result, the horizontal crack “test-3” data showed lower ∆Kth (~30% lower) and a higher crack growth rate (~30% higher) in the region of ∆K < 10 MPa m1/2 compared to the two other horizontal crack samples (horizontal crack test-1 and test-2). Furthermore, coarse and brittle Fe- and Mn-rich second-phase particles (refer to Section 2.1) were observed along the crack path, Figure 4C3. The presence of such particles in the uniform region can facilitate crack growth, resulting in lower ∆Kth as well as a faster growth rate locally when those particles are cut through by the advancing crack tip. Similar findings were reported for other aluminum alloys.29
Crack growth rates at R = 0.5 are presented in Figure 5. The average values of ∆Kth are 1.4 MPa m1/2 for the vertical cracks and 1.7 MPa m1/2 for the horizontal cracks. This indicates that at higher cyclic load ratios, grain size still had some influence on the ∆Kth. However, both sample orientations showed similar crack growth rates in the Paris law and the fast crack growth regimes. Since the mean stress is higher at the higher R ratio, the crack closure effect due to grain coarsening was reduced.39, 52 Crack propagation was mainly driven by the stress intensity factor range ∆K, and the effect of microstructure is negligible. This is manifested by the negligible difference in crack growth rates between the two crack orientations in the Paris law region and the fast growth region.
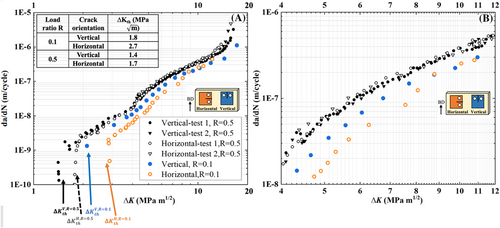
Figure 5 also shows the crack growth rate comparison between R ratios of 0.1 and 0.5. As expected, at the same ΔK, the crack growth rate is higher at the higher R ratio throughout the crack growth histories. This can be explained in the previous paragraph, where our findings can be supported by the theory introduced by Suresh et al.39
4 REPRESENTATION OF CRACK GROWTH RATE BY THE MODIFIED HARTMAN-SCHIJVE EQUATION
| Load ratio, R | Crack orientation | ∆Kth (MPa m1/2) | A (MPa m1/2) | p (averaged) | D (averaged) |
|---|---|---|---|---|---|
| 0.1 | Vertical | 1.8 | 31.1 | 1.85 | 3.3E−9 |
| Horizontal | 2.7 | 31.1 | |||
| 0.5 | Vertical | 1.4 | 40.0 | ||
| Horizontal | 1.7 | 40.0 |
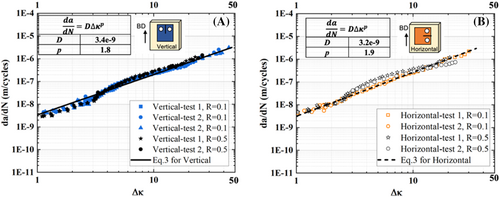
Values of log(D) and p can be obtained, respectively, from the interception at the y-axis and slope of the fitting line in Figure 6, so the material constants D and p are determined and shown in the figure insert. The other two material parameters, A and Kth, and the averaged values of D and p for both crack orientations are listed in Table 3. The collapse of a wide range of test data (two crack orientations and two load ratios) into the same line indicates that the modified H–S eq. can describe the crack growth rates in full range from the threshold growth point to the final fast growth end. This means that only one test is needed to determine the cyclic fracture toughness A and threshold stress intensity factor Kth under just one load ratio, which can then be used for other load ratios within 0.1 and 0.5. This finding agrees with the work by Jones et al. on a study of L-PBF Al–Mg–Sc–Zr alloys.56
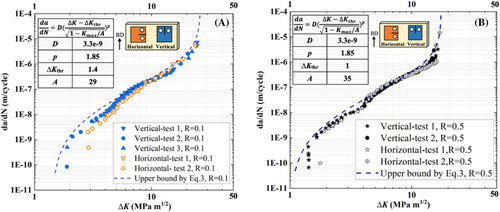
Finally, the experimental data is plotted in terms of da/dN versus applied in Figure 7, with an upper bound curve generated by the modified H–S eq. (Equation (3)) using average values for D and p. The upper bound curve can serve as the worst crack growth rate property value for damage tolerance design and assessment.57 The upper bound values for ∆Kth and A are shown in Figure 7 insert. It demonstrates that the modified H–S eq. can represent the crack growth rate in the whole sigmoidal curve and for both horizontal and vertical cracks in this new alloy.
5 CONCLUSIONS
- The microstructure of this material can be characterized by the fan-like and uniform regions, which are periodically alternating with different grain sizes and inhomogeneous precipitate distribution along the material build direction. Mg-rich precipitates are distributed in all regions. Mn- and Fe-rich coarse particles are concentrated in the uniform regions, while Ti-rich and Sc-rich precipitates are found mainly in the fine-grain regions. This is due to the cyclic thermal history during the material deposition process as well as different cooling rates at different locations.
- Anisotropy in FCGRs between the two crack orientations is observed in the near threshold and lower ΔK regions (ΔK < 8 MPa m1/2) where the horizontal crack sample shows a 50% lower crack growth rate than the vertical when tested at R = 0.1. This is because most of the horizontal cracks propagate only in the fan-like region, where coarser grains cause more crack closure, hence a slower growth rate. The vertical cracks propagate in both the fan-like regions and uniform regions alternately; the finer grains and more second-phase particles result in a higher crack growth rate.
- The absence of crack growth rate anisotropy in the Paris law region under the higher load ratio of 0.5 is due to the increased mean stress that reduces crack closure effect due to the grain size influence on crack path deviation.
- The modified H–S eq. can represent the experimental crack growth rates very well in all three regions. The equation can generate an upper bound curve for the crack growth rate property that can provide a safe margin for damage tolerance design.
- This study implies that the WAAM Al–Mg–Sc alloy can be used for structural components that are designed for damage tolerance, as the material is comparable with or better than similar alloys (processed by conventional or other AM processes) in their resistance to fatigue crack growth, which is a key property for damage tolerance design.
AUTHOR CONTRIBUTIONS
Jin Ye: Conceptualization; methodology; investigation; data analysis; writing—original draft preparation. Abdul Khadar Syed: Conceptualization; methodology; supervision; resources; writing—review and editing. Xiang Zhang: Conceptualization; methodology; supervision; resources; writing—review and editing; funding acquisition. Eloise Eimer: Investigation; formal analysis; writing—review and editing. Stewart Williams: Resources; writing—review and editing; funding acquisition.
ACKNOWLEDGMENTS
We would like to thank Colin Thorneycroft and Steve Damms at Coventry University for their support during the sample machining and Yipeng Wang at Cranfield University for their support during the wall deposition. We also thank the UK Engineering and Physical Sciences Research Council (EPSRC) for supporting this research through the NEWAM program grant (EP/R027218/1).
CONFLICT OF INTEREST STATEMENT
The authors declare that they have no known competing financial interests or personal relationships that could have appeared to influence the work reported in this paper.
Open Research
DATA AVAILABILITY STATEMENT
The data underlying this study can be accessed through Cranfield's research data repository at https://doi.org/10.17862/cranfield.rd.21082183.


