Transverse fatigue behaviour and residual stress analyses of double sided FSW aluminium alloy joints
Abstract
Friction stir welding (FSW) since its invention has been attracting relevant interest for joining aluminium alloys. Due to the nature of this process, the materials can be joint without melting. Thanks to this peculiar characteristic, the issues associated with the cooling from liquid phase are avoided or considerably reduced, such as cracking, porosity, and defects.
However, as well as other well-established welding techniques, the FSW process gives rise to formation of residual stress in the welding region and surrounding volume: heat and thermo-mechanical affected zones. Presence of residual stress in a mechanical component is well-known to affect its performance, particularly regarding fatigue at high number of cycles. Another aspect that influences the fatigue life is the underlying microstructure.
In this work, we firstly study the residual stress field and the underlying microstructural features arising in FSW butt joints and their effect on the fatigue performance of this type of weldments. The evaluation of residual stress field is carried out by means of modern experimental techniques. In the first instance, synchrotron X-ray powder diffraction was employed for two-dimensional full field maps of residual stress. Corroboration of these measurements was done by exploiting the capability of focused ion beam and digital image correlation (FIB-DIC), which is able to deliver pointwise absolute measurement of residual stress. A set of FSW samples were then tested under uniaxial fatigue loading at several loading ranges, in the high cycle fatigue regime, in order to understand whether the severity of loads affects the crack path and life endurance. Fractographic and electron backscattered diffraction (EBSD) analysis then revealed crack nucleation site and propagation mechanisms with the respect of the underlying microstructure. Outcome of these experimental studies is then thoroughly discussed.
Nomenclature
-
- ∆σ
-
- Fatigue stress range
-
- σUTS
-
- Ultimate tensile stress
-
- σmax
-
- Maximum fatigue stress
-
- σxx
-
- xx-component of residual stress
-
- σyy
-
- yy-component of residual stress
-
- EBSD
-
- Electron backscattered diffraction
-
- EDM
-
- Electrical discharge machining
-
- FEM
-
- Finite element method
-
- FIB-DIC
-
- Focused ion beam and digital image correlation
-
- FSW
-
- Friction stir welding
-
- FWHM
-
- Full width half maximum
-
- HAZ
-
- Heat affected zone
-
- HCF
-
- High cycle fatigue
-
- IPF
-
- Inverse pole figure
-
- R
-
- Fatigue stress ratio
-
- RS
-
- Residual stress
-
- SCF
-
- Stress concentration factor
-
- SEM
-
- Scanning electron microscopy
-
- SXRD
-
- Synchrotron-based X-ray diffraction
-
- t
-
- Sample thickness
-
- TMAZ
-
- Thermo mechancial affected zone
1 INTRODUCTION
Friction stir welding (FSW) is widely employed technique for the joining of soft metallic alloys, although an effort has been currently made to extend its applicability to harder alloys such as steel.1 The family of aluminium alloys is perhaps the most common class of materials welded by using this method.2 Nevertheless, much research has focused also on the weld of dissimilar materials.3-6 Over 20 years since its invention, FSW has been developed for a number of butt weld types, eg, closed square,7 T-joints,8 and tubes.9, 10 Weldments produced by this technique show superior mechanical properties than those manufactured by conventional ones, such as Metal Inert Gas (MIG) and Tungsten Inert Gas (TIG). The aspects that make this technique favourable against others are the high quality of the welds in terms of presence of low porosity and defects,2 relatively low residual stresses (RS)11 and higher fatigue performance.12 In addition to this, it has been demonstrated that also the distortion of the final product is reduced.
In the last decade, a relevant amount of effort has been put in optimising the process parameters with the goal of achieving more and more resistant mechanical components realised through this technique.13, 14 Also, a very extensive characterisation campaign has been conducted for several materials, especially to assess and model fatigue performance.15, 16
Nonetheless, in order to reliably predict failure of mechanical components and assemblies produced by FSW, profound knowledge of the failure mechanisms involved is necessary, which are often neglected or merely empirically accounted for. The two main affecting factors of the fatigue characteristics of these welds are the microstructure and the presence of RS. The former has been widely studied and reported in the literature, highlighting the significant grain refinement and texture modification.17, 18 The latter, ie, RS, is in general well-known to be detrimental for the fatigue properties of weldments, as high magnitudes of tensile stresses can be present within both the heat affected zone (HAZ) and the thermo-mechanically affected zone (TMAZ) of the weld, and generally lower tensile magnitude in the nugget of the weld.19 It is therefore central to better understand role and prominence of these affecting factors in this class of components when subjected to fatigue loadings.
In this study, an experimental investigation on fatigue, RS, and microstructural properties is conducted. In the first place, high cycle fatigue (HCF) tests were performed on dog-bone samples, extracted from a double sided FSW aluminium alloy plate, at different loading amplitudes. Postmortem examination of the fractured samples and microstructure morphology were, respectively, conducted by means of optical profilometry and scanning electron microscopy (SEM). The microstructure of one of the fatigued samples was revealed by using electron backscattered diffraction (EBSD), covering a large area of the thickness cross-section spanning from the fractured surface to the unaffected region sufficiently far from the weld. As far as the RS evaluation is concerned, the transverse and normal components were evaluated by employing two independent experimental techniques. To obtain a full 2D map of RS over the welded region cross-section (through-thickness), synchrotron-based X-ray technique (SXRD) was used in transmission mode.20-25 In addition to this measurement, a linear spatially resolved RS profile along the mid-thickness line was obtained by an independent technique called focused ion beam and digital image correlation (FIB-DIC),26, 27 which allowed for the measurement of very local RS, independently from the prior knowledge of the unstrained condition of the probed material. Qualitative information regarding the region where high plastic deformation occurred was also extracted from the SXRD acquired patterns by evaluating the peak broadening effect.
The geometry of the studied joint was also examined in this study to quantify the amplification of stress due to the presence of notch-like features. Thus, the nominal stress concentration (SCF) arising when this joint is subject to uniaxial load was simulated exploiting the capabilities of the finite element method.
The experimental outcomes of this research were critically analysed and thoroughly discussed in order to identify crack initiation and propagation mechanisms.
2 MATERIAL
A 4-mm-thick aluminium alloy AA6082-T6 plate was the material used for the manufacturing of a FSW joint. With the purpose of executing the fatigue tests, the welded plate was subjected to wire electro discharge machining (EDM) to cut dog-bone samples; geometry and dimensions are shown in Figure 1. The rolling direction of the plates corresponds to the longitudinal direction indicated in the figure.
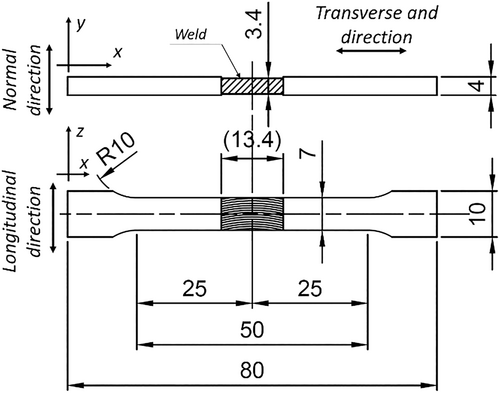
In addition to this set of samples, a further sample was extracted by thinning the 7 mm width indicated in Figure 1 down to 2 mm; this was the sample subsequently used for the SXRD analysis. The choice of 2 mm was made by compromising the level of X-ray scatter and sample absorption at the beam energy available.
3 METHODS
3.1 Fatigue tests
The experimental analysis of fatigue testing was conducted using an ElectroPuls E10000 dynamic test instrument provided by Instron. This test rig is able to achieve high loading frequency (up to 100 Hz) at loads as high as 10 kN. Nevertheless, for the purpose of the present study, only the HCF regime was considered; therefore, the frequency was limited to 25 Hz. Such constrain was imposed in order to reduce the effect of thermal heating, which may have affect the outcome of the tests.
A preliminary tensile monotonic test allowed for determining both the ultimate tensile stress (σUTS) and yield stress (σY), which were assessed, respectively, to be 180 and 152 MPa. It is worth reporting that the assessment of the yield stress was done by assuming a 0.2% plastic strain offset. Therefore, the fatigue tests were performed at a maximum load being lower than the σY. In the present campaign of fatigue tests, the samples were cyclically loaded at load ratio R = 0.1. This choice was mainly aimed at reducing the effect of plasticity induced crack closure taking place while the crack propagates through the welded region. By decreasing the effect of crack closure, the crack surface shows a less amount of plastic deformation generated by the contact between crack flanks, which in turns allows improved optical inspection of the crack surface morphology. Maximum cyclic stresses σmax were thereby chosen to range between 80 and 140 MPa; which corresponds to stress ranges ∆σ of 72 to 126 MPa. Seven samples were employed in total for the fatigue tests.
3.2 FIB-DIC ring-core and synchrotron based XRD for the evaluation of residual stress
RS in materials can be evaluated through a number of experimental techniques ranging from destructive to non-destructive. However, only few of them provide absolute estimation of RS values independently from the material microstructural characteristics; these are based on the concept of stress relaxation. Stress relaxation takes place when a cut (removal of material) is performed in the material, which in turn it gives rise to deformation of the surrounding material due to the pre-existence of RS. Based on this concept, several techniques have been developed in the last decades,28-31 and more recently, it also has been implemented at the nano- and micron-scales.32-35 One of the two methods employed in this study is based on such a physical phenomenon, and it is applied at the micron-scale. Such a method is also known as FIB-DIC micro-ring-core technique.26, 27, 36, 37 In this acronym, FIB stands for focused ion beam, which is the technique utilised for the material removal at such a small scale, and DIC is the digital image correlation technique adopted to track and to measure the surface feature displacements occurring on the surface of the “core” while the milling proceeds. Such core is the pillar-like volume of material left after the machining is completed. Latest developments of this method have allowed the evaluation of depth profiling of RS within coatings or treated surface with depth resolution up to 50 nm. However, as concerns the present study, since depth profiling was not required but rather an averaged local value, a more classic strategy was used for the back calculation of RS from the measured strain relief provided by DIC analysis. This calculation framework consists in the fitting of the relief curve with a master curve obtained by FEM simulation, assuming the RS is constant throughout the whole depth reached by the ring-core milling. It is assumed that the RS depth profile is constant at each local measurement. This assumption is realistic seeing as the total ring-core milling depth is only 5 μm. It is important to highlight that this calculation accounts for the presence of several sources of errors, ie, DIC tracking and master curve fitting,38 elastic local anisotropy,39 and FIB-induced amorphisation.40-42 Such a propagation of errors will be illustrated by using error bars for each local measurement. It is worth stressing that in comparison with the SXRD technique, FIB-DIC relies on the assessment of RS within a much smaller gauge volume. It is therefore challenging to estimate the RS variability within the workpiece induced by the manufacturing technique, ie, sum of physical errors.
One of the limitations of the FIB-DIC method is the rather prohibitive possibility of obtaining full-field maps of RS over large areas, given the relevant time required for each measurement point (about 20 minutes each). Since in this study one of the purposes was to find correlations between the presence of the RS and fatigue crack nucleation and propagation, it was considered of great importance to consider a full picture of RS present in the weld. Moreover, SXRD method provided an unparalleled amount of statistical information, which allowed for the assessment of RS variability throughout the sample thickness.

3.3 Optical, SEM, and EBSD for microstructural investigation
The fatigue mechanical testing was followed by detailed inspection of the fracture surface to investigate the cracking mechanisms operative during propagation. Firstly, optical examination was carried out by using an Alicona Infinite Focus optical microscope, which provided 2-mm lateral resolution and accurate focus ensured by the out-of-plane scan reconstruction implemented in its dedicated software. As an outcome, the 3D reconstruction of the crack surface morphology was recreated. For this analysis, two representative fatigued samples were studied.
A representative fractured sample was then examined using SEM microscopy. Detailed fractographic analysis was performed over specific regions of the sample, for instance: initiation point, steady fatigue crack growth region, and monotonic failure.
The microstructural characteristics of the material in the vicinity of the fracture were studied by invoking the EBSD method. One end of a representative fractured sample was used for this task. The analysed surface can be identified as the xy-plane depicted in Figure 1. Such a surface was progressively polished using several grades of sand papers, followed by diamond suspensions up to 1 μm and colloidal silica solution as a last step. Besides the region close to the fracture, thanks to the large size of the map, it was also possible to appreciate the gradient of microstructure size and texture degree across the three dominant regions identified in FSW joints, namely, nugget, HAZ, and TMAZ. The map true pixel size was set to 4 μm.
4 RESULTS
4.1 Fatigue tests
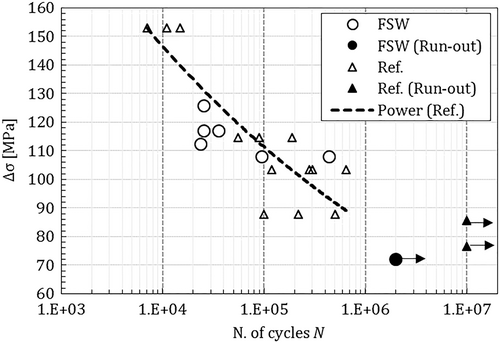
The results of the fatigue test campaign are summarised in the Wohler diagram in Figure 2. As it is possible to see, the sample fatigued at 72 MPa of stress range experienced fatigue life greater than the cut-off threshold, above which the test is considered as a run-out. On the other hand, other samples tested at different stress ranges showed a general trend of load being inversely proportional to the number of cycles, as expected and well-known from fatigue theory. The experimental data are fitted with the classic empirical Wohler curve. It is worth remembering that this manuscript is not devoted to the full fatigue characterisation of these joints but rather at investigating some failure characteristics. For this reason, the number of fatigue tests was limited to only seven. Needless to say that the actual curve requires a larger number of experimental tests to be statistically representative; however, the present experimental results provide an insight on the trend. In addition, the fatigue behaviour of FWS joints of the same material, extracted from the literature, are reported in the same plot,45 indicated as “Ref.”, along with the fitted power curve.
4.2 Microstructure characterisation and fractography
The investigation of the fracture surface was performed on two samples using optical depth-resolved microscopy. The samples loaded at higher and lower fatigue stress ranges, respectively, at 112.5 and 126 MPa are shown in Figure 3. As it is possible to observe from both the contour plots and the 3D reconstruction, the crack followed a path not strictly perpendicular to the loading direction, as expected for homogeneous materials. Thereby, a first conclusion is that the crack path was strongly influenced by the underlying microstructure and possibly from the RS field for all the samples and fatigue load amplitudes. For all the cases studies, macroscopic features were observed. These features can be seen as marks that are not associated with the direction of crack propagation, as will be shown later, but rather linked to the tool advance, as also observed in the literature46; Figure 3A shows the location of these marks and are indicated as “tool rotation marks.”

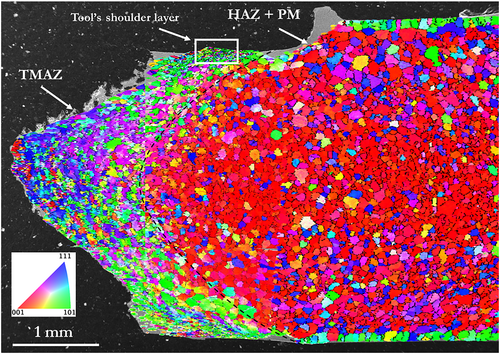
A large EBSD map over the regions of interest was acquired and then overlaid onto a secondary electron image obtained from SEM, shown in Figure 4. This maps clearly enables the visualization of the crack path and how this is linked to the microstructure and texture. Two main regions could be identified in the map, the first belonging to the TMAZ on the left-hand side and the second showing a transition to the unaffected microstructure on the right-hand side. A further region can be recognised at the top and bottom sides of the weld, in correspondence of the tool contact region where a prominent grain refinement took place, forming a shallow layer which is named as tool's shoulder layer.
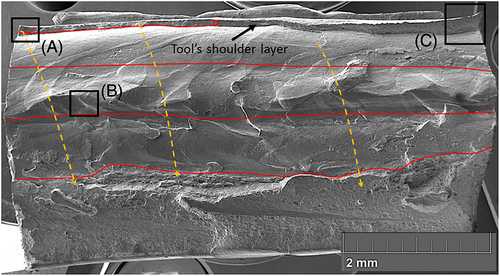
A more detailed inspection of the fractured surface was done by SEM, and the results are shown in Figures 5 and 6. The overview image presented in Figure 5 not only highlights again the tool advance macroscopic marks but also provides enough resolution to identify the typical fatigue striation, which are directly associated to the length of crack propagation at each load cycle. With the purpose of facilitating the comprehension of the image, continuous red lines are manually overlapped to enhance visualisation of the crack front at some stages of propagation. In addition, orange arrows indicate the direction of propagation.

It is important to identify features of this joint when compared with other types of FSW. For instance, despite the nature of the double sided FSW,45 the effect of the tool's shoulder is only predominant on the side where crack nucleation occurred, making the single side type of joint not much different from this point of view. On the contrary, if the monotonic behaviour of the joint was studied, we would experience a difference because of the additional tool's shoulder layer being present at the bottom part (visible in Figure 4). In general, the literature reports an improved performance of double sided FSW, especially in terms of strength.47-49 This effect is thought to be related to the accessibility of the material from both sides, which makes the processed material more homogeneous. Another aspect that may be worth elucidating is the crack path, which differs from what is observed for single sided FSW. In fact, in contrast with the double sided joint seen from the Figure 4, the single side joint presents a V-groove usually extending all the way through the thickness. It can be expected that the crack path would not differ from the traditional single side joint for one third of the crack extent. Instead, as the effect of the double side becomes more and more prominent, the crack path diverts assuming a more characteristic shape resembling the groove (or the TMAZ).
Another visible characteristic is that all the nucleation of cracks took place within the region affected by the tool's shoulder contact. This region can be identified only by observing the fractured surface, as visible at the crack nucleation site in Figure 3, or in more details in the Figure 6A,C. After detailed imaging inspection, it turned out that this can be considered as a semi-detached layer, about 100-um thick. It is indeed at this outer layer where crack first originated, most probably facilitated by the pre-existence of a large defect, as underlined in Figure 6A. It is also important to remark that the interface between the shoulder layer and the core material is rather discontinuous, making the fatigue crack propagating in different manners. In fact, Figure 6C illustrates how at the right-hand side of the specimen the crack propagated in fatigue mode in the core, but the outer layer showed ductile fracture, imputed to monotonic load failure.
4.3 Residual stress evaluation and FEM stress analysis
As explained earlier, two experimental techniques were employed for the study of RS across the weld regions. The analysis of the acquired diffraction patterns, quantification of lattice strain first, and calculation of RS second, allowed for the reconstruction of the RS maps reported in Figure 7A,B. The lack of detailed information at the very top and bottom parts of the maps was attributed to free-edge effects, being this not perfectly even and producing artefacts and therefore unrealistic values of stress that were ultimately discarded.
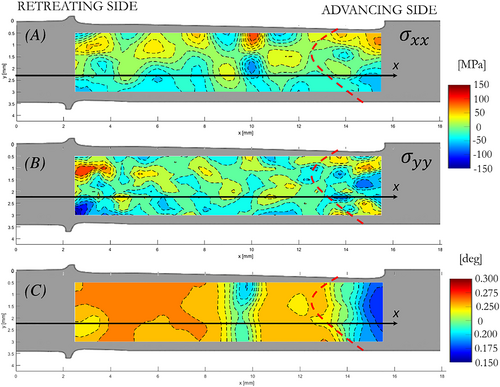
Although it is generally very challenging to extract quantitative evaluation of the plastic strain present in the weld, the analysis of peak broadening effect may sometimes provide some insights.50 With this end, a peak broadening analysis was carried out, using the same crystal plane (<311>) previously employed for the lattice strain analysis. The resulting contour map is shown in Figure 7C.
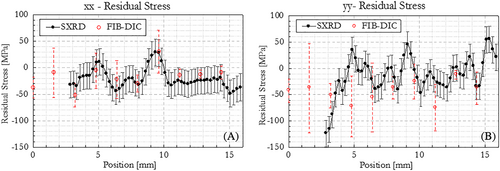
To corroborate the results from SXRD, a line of spatially resolved FIB-DIC ring-core measurements was performed across the FSW section. The line is shown by the black arrows in Figure 7A,B, and the x-axis shares the same origin with the SXRD contour plots. For the sake of comparison, RS line profiles were extracted from the SXRD maps at the same locations and plotted in Figure 8. It is worth noting that the error bars concerning the yy component of RS are significantly larger than corresponding xx ones. This is due to the SEM fast scan direction, being in this specific case, corresponding to the x-direction. In any case, the magnitude of error bars is still tolerable.
The sample selected for the study of RS was also imaged by optical microscopy with the purpose of generating a geometrical model. A 2D model of the sample cross section was then imported in an FEM environment and the uniaxial loading condition simulated, neglecting material, and geometrical nonlinearities. After mesh refinement at the high local curvature regions and appropriate implementation of load and boundary conditions, it was possible to estimate the nominal SCF. A contour plot of the SCF is reported in Figure 9.

5 DISCUSSION
The combination of microstructural characterisation and stress analysis has shed some light onto the nature and propagation of fatigue crack. The first observation can be drawn upon the direct observation of the crack path, which turned out to be strictly associated to the nature of the geometric properties of the process itself. Indeed, the shape of the TMAZ region vastly influenced the crack propagation path, regardless the magnitude of the tested fatigue loadings. It is then obvious that crack deflection mechanisms were operative during propagation, leading to a superior dissipation of energy during this process compared to an ideal case where the crack path would be perfectly perpendicular to the loading direction.
In addition, EBSD analysis provided further information of the nature of such a route followed by the crack through the sample thickness. As shown in Figure 4, overall, the crack trajectory followed the morphology of the microstructure present in the TMAZ. In this region, especially in the core of the weld, a mild grain refinement took place, accompanied by a significant modification of the microstructure texture from the parent material that can be appreciated on the right hand side of the map. The most interesting aspect perhaps is the effect that the tool's shoulder had on the microstructure where the dynamic contact took place. In this region (squared in Figure 4), abundant grain refinement occurred, caused mainly by the large shear stresses induced by the tool. It is actually in this region where the fractographic analysis later revealed the site of crack nucleation or at least one of the nucleations. Not the only site because SEM analysis also displayed both the presence of a discontinuous interface connecting this layer to the TMAZ and different crack propagation mechanisms and rates between the two adjacent regions. Hence, the most extensive fatigue crack propagation process throughout the sample thickness is likely to have origin at this interface, and it may have originated in a later stage of propagation, after that most of the outer layer was cracked. Another clue supporting this theory arises from the fact that at the opposite side of the nucleating crack, the outer layer did not show fatigue failure, but rather a monotonic ductile failure. Meaning that this portion of layer only failed when most of the sample was already cracked by fatigue.
The analysis of RS also provided very noteworthy results in the context of fatigue failure. Clearly, there is no evident trend of RS profiles across the weld, which showed alternating tensile and compressive regions, not necessarily associated with the three main regions defined earlier. In any case, the RS results presented here show a very good degree of accuracy, provided by the employment of two independent experimental techniques. In fact, Figure 8 shows how a satisfactory agreement was found by comparing the results of the two techniques, namely, SXRD and FIB-DIC. Small local divergences experienced here can be imputed to a scale effect becoming more and more prominent when the diameter of the ring-core used for the FIB-DIC evaluation approaches the dimension of the grain. It has been shown in previous works how, apart from the local elastic anisotropy, small variation of stress at the micron scale are due to the presence of type II and type III RS.51-53 Overall, similar stress magnitudes or lower were also found in similar alloy.54 An interesting aspect can be appreciated though, and it concerns the sign of RS over the path of the crack. Especially in Figure 7A, it is clear how the crack propagated through regions where the sign of RS was predominantly positive, which means that compressive RS regions may have played a role in deflecting the crack towards regions where a more detrimental type of RS was present.
Qualitative estimation of the plastic deformation occurred across the welded region could also be extracted from the SXRD experiment by quantifying the FWHM of the fitted peak. This confirmed the presence of high plastic deformation taking place in the TMAZ region compared with the HAZ. Interestingly, the central part of the weld showed lower degree of plastic deformation, probably due to the different temperatures present in this region, which induced grain recrystallisation.
In addition to the microstructural and intrinsic stress state of the weld, the geometrical effect of the welded joint was eventually analysed. Interestingly, high concentration of stresses being present at the advancing side of the weld close to the crack origin site was wound, thanks to the SCF that was numerically evaluated via FEM. This aspect may also have contributed on triggering the fatigue failure constantly on the top side of the sample, and it is undeniable how the presence of this type of notch can reduce the fatigue life of such components.
6 CONCLUSIONS
The present work has highlighted the importance of the both microstructural characteristics and RS in affecting the HCF performance of this class of FSW joints. Fatigue tests showed a distinctive crack path that was found to be associated to the microstructural regions resembling the tool shape, regardless the severity of fatigue loading.
The nucleation of crack took recurrently place close to the advancing side, particularly where the tool's shoulder layer was present. Nucleation generally occurred at this layer first, in particular where defects were present, every time from the free surface, and it is not excluded the hypothesis that further crack nucleation happened at the interface between the tool's surface layer and the core of the weld, since this was seen to be discontinuously connected. An accurate evaluation of RS was carried out by using two independent techniques. This analysis outlined how the crack propagated trough regions showing high magnitude of tensile RS, hence confirming the role of RS in fatigue crack propagation.
The analysis of peak broadening highlighted the large plastic deformation that arose especially in the TMAZ. Furthermore, the FEM analysis has shown a concentration of stresses nearby the actual position of crack nucleation due to the presence of a notch-like feature produced by the welding process. The presence of this feature may have contributed in triggering the crack nucleation from this side.
It is then evident that several factors do actually have a relevant influence on the fatigue properties of this family of joints. For this reason, future predictive models will need to account for these aspects to achieve more and more distinctive performance.
ACKNOWLEDGEMENTS
The authors acknowledge the Research Complex at Harwell and the Centre for In situ Processing Studies, and Diamond Light Source for access to beamline B16 (proposal MT13737-1). Scientific support from beamline scientist Dr Igor P. Dolbnya is also acknowledged.


