Circadian changes in aperiodic activity are correlated with seizure reduction in patients with mesial temporal lobe epilepsy treated with responsive neurostimulation
Abstract
Objectives
Responsive neurostimulation (RNS) is an established therapy for drug-resistant epilepsy that delivers direct electrical brain stimulation in response to detected epileptiform activity. However, despite an overall reduction in seizure frequency, clinical outcomes are variable, and few patients become seizure-free. The aim of this retrospective study was to evaluate aperiodic electrophysiological activity, associated with excitation/inhibition balance, as a novel electrographic biomarker of seizure reduction to aid early prognostication of the clinical response to RNS.
Methods
We identified patients with intractable mesial temporal lobe epilepsy who were implanted with the RNS System between 2015 and 2021 at the University of Utah. We parameterized the neural power spectra from intracranial RNS System recordings during the first 3 months following implantation into aperiodic and periodic components. We then correlated circadian changes in aperiodic and periodic parameters of baseline neural recordings with seizure reduction at the most recent follow-up.
Results
Seizure reduction was correlated significantly with a patient's average change in the day/night aperiodic exponent (r = .50, p = .016, n = 23 patients) and oscillatory alpha power (r = .45, p = .042, n = 23 patients) across patients for baseline neural recordings. The aperiodic exponent reached its maximum during nighttime hours (12 a.m. to 6 a.m.) for most responders (i.e., patients with at least a 50% reduction in seizures).
Significance
These findings suggest that circadian modulation of baseline broadband activity is a biomarker of response to RNS early during therapy. This marker has the potential to identify patients who are likely to respond to mesial temporal RNS. Furthermore, we propose that less day/night modulation of the aperiodic exponent may be related to dysfunction in excitation/inhibition balance and its interconnected role in epilepsy, sleep, and memory.
Key points
- Greater circadian changes of both the aperiodic exponent and oscillatory alpha power during the first 3 months of responsive neurostimulation (RNS) are correlated significantly with improved seizure reduction following RNS.
- Circadian features of baseline, non-epileptiform intracranial power spectra are a potential biomarker of seizure reduction.
- The aperiodic exponent of intracranial power spectra increases with epileptiform activity and holds promise for characterizing epileptiform brain states.
1 INTRODUCTION
Responsive neurostimulation (RNS), which delivers electrical stimulation in response to detected epileptiform activity near the seizure focus, is an established therapy for intractable focal epilepsy.1-4 Most patients treated with RNS experience a reduction in seizure frequency over time—44% at year 1 and 75% at year 9—but the clinical response is variable, and few patients have prolonged seizure freedom.3, 4 To date, patient characteristics and disease features have not explained the variability in outcomes.4-9 A biomarker of the clinical response has the potential to explain variability in seizure reduction and identify patients who are likely to respond to therapy.
The RNS System (NeuroPace, Inc.) is uniquely positioned to utilize an electrographic biomarker from the long-term intracranial recordings stored by the device. Thus far, a few potential biomarkers of the clinical response to RNS have been identified: a decrease in interictal spike frequency,10 ictal frequency modulation,11, 12 and frequency-dependent reorganization of interictal functional connectivity.13 In addition, preimplant biomarkers may prognosticate eventual response; for example, both intracranial network synchronizability from stereoelectroencephalography recordings14 and global functional connectivity from magnetoencephalography15 have been associated with clinical outcomes. These biomarker identification studies have focused on intracranial changes of oscillatory (i.e., periodic) spectral power in predefined frequency bands; however, nonoscillatory (i.e., aperiodic) components are promising measures of broadband spectral changes that have yet to be fully explored.16-19
Traditional approaches to analyzing power spectra conflate oscillatory and aperiodic activity, which may have distinct functional implications.20 Further parameterization of the power spectra is warranted to separate true oscillatory activity from the underlying aperiodic background (Figure 1A).16 The aperiodic component of a neural power spectrum decreases exponentially as frequency increases. This relationship can be represented as 1/fβ, where f is the frequency and β is the aperiodic exponent or negative slope of the power spectra as plotted on a log–log axis (Figure 1B).16, 21, 22 Although the aperiodic background has often been ignored or assumed to reflect experimental noise, renewed interest in the aperiodic exponent has identified functional changes related to development,23, 24 arousal,25-27 and disease states.28-32
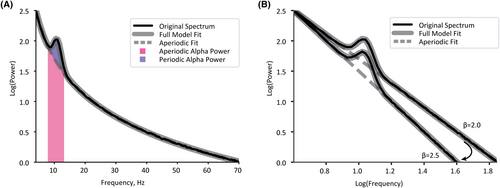
The aperiodic exponent is of particular interest to epilepsy dynamics as it has been associated with the balance of excitation and inhibition (E/I balance). In this framework, an increase in the aperiodic exponent—that is, a steepening of the slope—is associated with a shift to a more inhibitory state (Figure 1B).33 Initial observations show an increase in the aperiodic exponent related to epileptiform activity, suggesting that this measure may be a valuable biomarker of seizure-like activity. A case study identified an increase in the aperiodic exponent leading up to and during a seizure recorded with magnetoencephalography,34 and a study using intracranial neural recordings observed increases in the aperiodic exponent for seconds following interictal epileptiform discharges.35 However, no previous study has characterized the aperiodic exponent in ambulatory intracranial recordings from the RNS System device.
The objective of this study was to evaluate the aperiodic exponent, presumed to reflect E/I balance, as a biomarker for the clinical response to RNS. We hypothesized that as a patient's seizure frequency decreased, the aperiodic exponent would concurrently be reduced.36 We observed more-specific changes in aperiodic exponents, such that patient-specific circadian rhythmicity of the aperiodic exponent was associated with seizure reduction. Here, we report a novel electrographic biomarker measured during the initial months after implantation that prognosticates clinical response to RNS in patients with mesial temporal lobe epilepsy.
2 MATERIALS AND METHODS
2.1 Patient selection
We identified patients with intractable mesial temporal lobe epilepsy who were implanted with the RNS System between 2015 and 2021 at the University of Utah. To be included in this retrospective study, patients had to be implanted with at least one depth lead in the mesial temporal lobe and have stimulation turned on for at least 4 months.5 In addition, a follow-up seizure frequency must have been collected between February 2021 and February 2022. Board-certified epileptologists (A.M.A., A.Y.P., and B.J.N.) collected baseline and most recent follow-up seizure frequencies. We excluded patients with concurrent psychogenic nonepileptic seizures to ensure accurate seizure reporting.
2.2 Standard protocol approvals, registrations, and patient consents
The University of Utah Institutional Review Board approved the retrospective data collection and analysis and waived written informed consent.
2.3 Electrocorticography acquisition
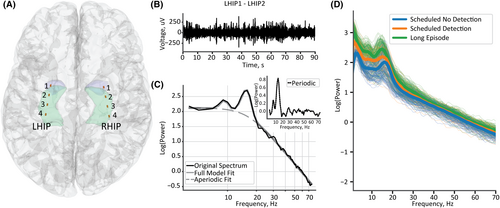
The RNS neurostimulator captures longitudinal intracranial recordings, i.e., electrocorticograms (ECoGs). A typical recorded event consists of four channels sampled at 250 Hz. Each channel is recorded differentially from its neighboring contact in a bipolar montage, with four contacts on each of two leads, resulting in four channels per patient (see Figure 2A for representative contact locations and Figure 2B for a recording of a single channel). The mesial temporal ECoG recordings analyzed in this study were classified by the neurostimulator as either “Scheduled” or “Long Episodes,” with each saved recording lasting 90 s. Scheduled ECoGs representing patients’ interictal baselines were recorded and stored approximately every 6 h. However, some Scheduled ECoGs included triggered detections, and, therefore, represented a more pathological state than baseline. Detection settings are programmed for each patient to identify characteristic seizure activity such as rhythmic changes in frequency or trains of spikes or slow waves. Thus, we further classified the Scheduled ECoG recordings as those with or without a detection. An ECoG was classified as a Long Episode if the detection settings were triggered for more than 30 s. We analyzed all Scheduled and Long Episode ECoGs recorded from the mesial temporal depth leads for 90 days after implant.
2.4 Spectral parameterization
We calculated the power spectra for all four channels of each ECoG using the NeuroDSP Python toolbox.37 We used Welch's method with a Hanning window of 1 s and a 12.5% overlap between segments and averaged across all windows. We then parameterized the power spectra using the FOOOF (“fitting oscillations and one over f”) toolbox described in Donoghue et al.16 We used the following model parameters: frequency range of 4–75 Hz (within the passband of the device), minimum peak height of 0.1, maximum number of oscillatory peaks as six, and “knee” as the aperiodic fit mode. We selected the knee aperiodic mode because broad frequency ranges (greater than 40 Hz) typically do not have a single 1/f characteristic, rather they have a bend in the aperiodic component.16 Therefore, the aperiodic exponent reported characterizes the slope after the knee. The FOOOF parameterization quantified the aperiodic exponent, that is, the negative slope of the power spectra on a log–log axis (Figure 2C), and the oscillatory power, that is, the power relative to the aperiodic background (see the inset in Figure 2C). We calculated the average frequency band power above the aperiodic background within the frequency ranges included in our FOOOF model: theta (4–8 Hz), alpha (8–13 Hz), beta (13–30 Hz), and gamma (30–75 Hz).10
2.5 Statistical analysis
We used a Pearson correlation to test for significant correlations between continuous demographic variables and seizure reduction. For all statistical analyses, we evaluated significance using α = .05. We used a linear mixed-effects model to quantify the change in the aperiodic exponent across three ECoG classifications: Scheduled without detections, Scheduled with detections, and Long Episodes. The aperiodic exponent of each ECoG was the dependent variable, and the ECoG classification was the independent variable. To control for multiple channels and ECoG studies per patient, we incorporated two levels of data clustering as random effects with random intercepts for patient and ECoG channel. We adjusted the p-values to account for the multiplicity of pairwise group comparisons using Hommel's procedure.38
We next investigated the circadian rhythmicity of the aperiodic exponent during a 24-h period. We selected the cosinor model, frequently used for circadian analyses because it does not require data to be collected at equidistant time intervals while assuming a 24-h period.39 The cosinor model uses the least-squares method to fit a cosine to time series data. We fit a cosinor model of the aperiodic exponent for each channel within a patient, collapsing all their Scheduled ECoGs with no detections to a single 24-h period using the CosinorPy package.40 The cosinor model quantifies the acrophase (i.e., the time of day when the aperiodic exponent peaks) and the amplitude at the acrophase (i.e., half of the magnitude of variation within 24 h). Only patients who had Scheduled ECoGs with no detections sampled approximately every 6 h were included in this analysis for accurate cosinor fits. The statistical significance of the cosinor model was assessed with the F-test, significant when the model sum of squares is large relative to the residual sum of squares, using the null hypothesis that there is no rhythm (amplitude was zero).39, 40
We subsequently quantified the relationship between circadian changes in the aperiodic exponent and seizure outcomes. We first calculated the mean aperiodic exponent for each channel during the day (6 a.m. to 12 a.m., 18 h) and night (12 a.m. to 6 a.m., 6 h) and subtracted the mean day exponent from the mean night exponent. We used a linear mixed-effects model to describe the relationship between seizure reduction (independent variable) and change in the aperiodic exponent (dependent variable) from night to day. We selected this statistical model to control for the patient as a random effect, because we included multiple channels (up to four) per patient. We also performed a linear regression between seizure reduction and the average aperiodic exponent change across all channels in each patient in order to summarize the between-patient associations. We followed the same procedure to model the relationship between seizure reduction and the day/night average power difference for theta, alpha, beta, and gamma frequency bands.
3 RESULTS
3.1 Cohort characteristics
We analyzed 24 patients (14 female) with mesial temporal lobe epilepsy who were implanted with at least one depth lead in the mesial temporal lobe (see Figure 2A for representative depth lead locations). Outcomes for a subset (19/24) of this cohort were reported previously in Charlebois et al.9 The median age at follow-up was 41 years (range 23–67 years), and the median stimulation duration was 27.5 months (range 4.8–49.6 months). Seizure outcomes were variable across the cohort, with a median seizure reduction of 61% (range 0%–100%). Seven patients (29%) were super responders with seizure reduction >90%, 11 (46%) were intermediate responders with seizure reduction between 50% and 90%, and 6 (25%) were non-responders with a seizure reduction <50%. Demographic features were not correlated significantly with seizure reduction: age (r = −.33, p = .12), epilepsy duration (r = −.10, p = .64), baseline seizure frequency (r = −.10, p = .63), and stimulation duration (r = −.19, p = .37).
3.2 Aperiodic exponent increases during epileptiform activity
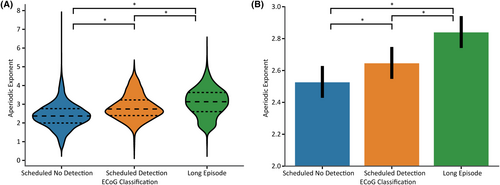
We next investigated the association between the aperiodic exponent and ECoG classification (Figure 3). We analyzed 29 152 ECoG spectra across all patients within the first 3 months after implantation (15 268 Scheduled no detections, 4736 Scheduled detections, and 9148 Long Episodes). We found a statistically significant difference in the aperiodic exponent across all pairwise group comparisons (p < .001 after Hommel‘s correction). The group mean of the aperiodic exponent (accounting for random variance introduced by patient and channel factors) increased with epileptiform activity: Scheduled no detection 2.53, Scheduled detection 2.65, and Long Episodes 2.84.
3.3 Circadian changes in the aperiodic exponent are correlated with seizure reduction
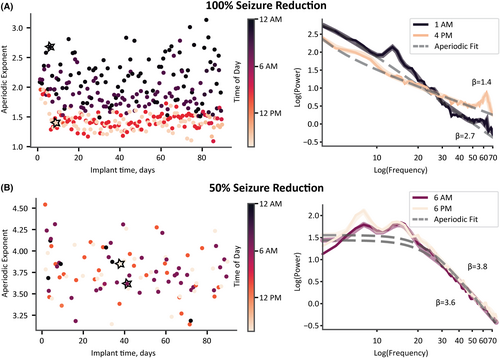
While visualizing a patient's Scheduled no detection aperiodic exponent over time, color-coded by the time of day, we observed a patient-specific separation between the day and night exponents (Figure 4). Consequently, we modeled each channel of a patient's ECoG as a cosinor based on the time of day and the aperiodic exponent for all ECoG recordings during the first 3 months after implantation (Figure 5A,B). Surprisingly, this circadian rhythmicity did not persist across all patients (Figure 5B). We, therefore, sought to understand why aperiodic exponent rhythmicity was not consistent across patients.
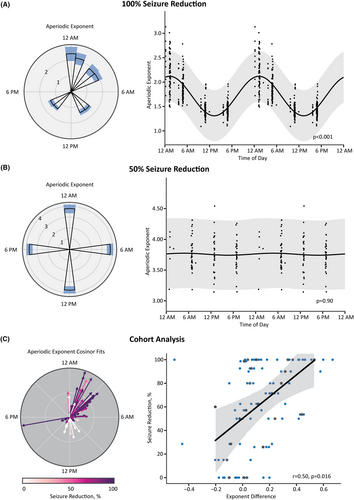
We next investigated the association between aperiodic exponent circadian changes and seizure outcomes. We found that a greater increase in the aperiodic exponent at night was associated with greater seizure reduction (n = 23 patients; a single patient did not have Scheduled no detection ECoGs sampled at night and was not included in the analysis) (Figure 5C). We found a significant main effect of seizure reduction on day/night aperiodic exponent difference (β = 0.003, SE = 0.001, z(80) = 2.722, p = .006). Moreover, the average day/night aperiodic exponent difference within a patient was correlated significantly with seizure reduction (r = .50, p = .016; Figure 5C). We show the parameterization of the cosinor fits on the left of Figure 5C. Each vector represents a single channel. The vector angle displays the time of day at which the cosine reaches its peak (i.e., acrophase), and we normalized the length of the vector by the amplitude of the largest cosine across all channels and patients. What is striking in this figure is that the ECoG channels of responders have similar acrophases in the middle of the night. In contrast, channels of nonresponders are variable with lower amplitudes.
3.4 Circadian changes in oscillatory alpha power are correlated with seizure reduction
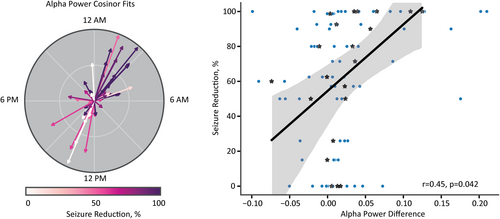
We then asked whether circadian changes of periodic features, independent of aperiodic activity, were also correlated with seizure reduction. We compared the average frequency band-specific power change between the night and the day for the aperiodic-adjusted power spectra (see Figure 2C inset). We found that a greater increase in alpha power at night was associated with greater seizure reduction (23 patients; one patient did not have Scheduled no detection ECoG sampled at night and was, therefore, excluded from the analysis; Figure 6). We found a significant main effect of seizure reduction on alpha power difference (β = 0.0005, SE = 0.0002, z(74) = 2.395, p = .017). Moreover, the average alpha power difference within each patient was correlated significantly with seizure reduction (r = .45, p = .042; Figure 6). Power changes in aperiodic-adjusted theta, beta, and gamma frequency bands did not have significant main effects (all p's > .05). Although we found a significant correlation between oscillatory alpha power changes and seizure reduction, traditional spectral analysis methods (i.e., band power before adjusting for the aperiodic component) were unable to identify a significant correlation between the average alpha power difference and seizure reduction (r = .38, p = .092; Figure S1).
4 DISCUSSION
The clinical response to RNS is variable, and currently no recognized approaches prognosticate a patient's response in the early stages of therapy.11, 13 Here, we present the rhythmicity of the aperiodic exponent measured during the initial 3 months after implantation as a candidate biomarker for seizure reduction after RNS. We found that increased mesial temporal aperiodic exponent and oscillatory alpha power at night correlated with seizure reduction. To our knowledge, this is the first study to propose circadian features of baseline, nonepileptiform activity as a biomarker of RNS response.
4.1 Aperiodic exponent and epileptiform activity
Moreover, we found that the aperiodic exponent increased with epileptiform activity, as shown by an increase in the aperiodic exponent during Scheduled ECoGs with detections and Long Episodes. This finding is consistent with studies showing an increase in the aperiodic exponent at seizure onset, during the seizure, and after interictal epileptiform discharges.34, 35 The changes in the aperiodic exponent may be explained by differences in E/I balance, as the aperiodic exponent has been shown to increase, that is, show a steeper slope, when balance favors more inhibition.33 These results have functional implications that could be explored further to characterize epileptiform brain states and aid in seizure prediction.
4.2 Excitation/inhibition balance
Mechanisms to maintain E/I balance are in place in a healthy brain. However, these mechanisms can break down in epilepsy, resulting in the prevention of inhibition and/or promotion of excitation.41 The aperiodic exponent lends itself as a unique way to probe changes in E/I balance,33 as hyperexcitability during the interictal state and the disruption of E/I balance are commonly associated with epilepsy. Changes in cortical excitability are not unique to epilepsy and are known to have circadian variations. For example, cortical excitability in healthy participants is increased during the day compared to at night,42 which is consistent with our finding of greater day/night modulation of the aperiodic exponent in responders.
4.3 Circadian rhythms and epilepsy
The rhythmicity of epilepsy has been documented for centuries.43-47 The recent availability of longitudinal ambulatory ECoG recordings has enabled quantification of long-term circadian and multidien patterns of epileptiform activity.48-52 Sleep disturbances such as insufficient sleep and comorbid sleep disorders have additionally been tied to circadian rhythm disturbances in patients with epilepsy.53, 54 Seizures themselves are known to disrupt sleep structure and can contribute to comorbid cognitive and mood disorders.55 An initial study in patients receiving RNS did not identify sleep disturbances due to stimulation; instead, sleep disturbances preceded RNS detections.56 Many questions remain surrounding the interaction among sleep–wake cycles, circadian rhythms, and seizure activity.
The circadian patterns of nonepileptic background activity may contain promising readouts of the interictal state.57 We identified two features of the baseline power spectra that displayed patient-specific circadian rhythmicity: the aperiodic exponent and oscillatory alpha band power. Previous research has shown that the aperiodic exponent can delineate arousal states such as wakefulness, anesthesia, non–rapid eye movement sleep, and rapid eye movement sleep.25-27, 58 Our finding of an increase in the aperiodic exponent during night hours supports previous work showing an increase in the aperiodic exponent from wakefulness to sleep. This same observation in healthy subjects leads us to speculate that a reduced change in the aperiodic exponent from day to night in nonresponders may be associated with fewer intact homeostatic mechanisms to restore E/I balance overnight. Of note, Lendner et al.58 found decreased changes in the aperiodic exponent at night after sleep deprivation. Moreover, participants with a greater modulation of the aperiodic exponent from day to night had better memory retention.58 These observations suggest that less modulation of the aperiodic exponent may identify dysfunction in E/I balance related to epilepsy, sleep, and memory.
The therapeutic mechanism of RNS is poorly understood; however, identifying biomarkers associated with the clinical response may aid in discovering underlying mechanisms. We propose that the magnitude of circadian aperiodic modulation may be a biomarker of epilepsy severity, where reduced aperiodic exponent rhythmicity is tied to more severe epilepsy. Our cohort's baseline seizure frequency was not significantly correlated with RNS response. Nonetheless, this finding does not preclude the idea that baseline aperiodic exponent modulation may be related to other aspects of epilepsy severity, such as mechanisms regulating E/I balance or a marker of network plasticity.
A current theory of the mechanism of RNS is that, over time, plasticity effects from stimulation restructure the epileptic network, leading to a reduction in seizures.11-14 Fluctuations of E/I balance via the aperiodic exponent may be a marker of baseline network plasticity at the time of implantation, leading to a better response in patients with more intact or plastic networks. Fan et al.15 show that RNS responders had increased functional connectivity in alpha and beta bands compared to nonresponders before implantation, further supporting the idea that more intact functional networks lead to a better response to RNS.
In addition to identifying the rhythmicity of aperiodic power spectra features, we found that day/night modulation of oscillatory alpha power was correlated with seizure reduction. Previous work has shown that decreased alpha oscillations are tied to sleep deprivation, impaired cognition, and weakened memory.59, 60 It is intriguing that circadian oscillations within the hippocampus have been observed previously61 and work in Drosphilia found that the magnitude of long-term potentiation is rhythmic and dependent on previous states of sleep.62 These results suggest that the aperiodic exponent and periodic alpha power may be independent ways to measure plasticity in the mesial temporal lobe.
4.4 Implications for the future of RNS
Taken together, circadian changes in the aperiodic and periodic components of the baseline power spectra appear to be closely linked with sleep–wake cycles, cognition, and memory. Additional work is necessary to disentangle the interaction between these features and epilepsy. To aid in this process, automatic sleep classifiers are being developed to explore further the interaction between sleep and wake stages in epilepsy.63 This classification will be useful to link a specific electrophysiological biomarker to an arousal state rather than a time of day, to better understand the contributions of circadian rhythms in long-term intracranial data. These advances are paving the way for novel adaptive stimulation paradigms that tailor the stimulation to a specific brain state, whether a circadian state or a marker of epileptiform activity that could be identified with the aperiodic exponent. Adaptive stimulation could, in theory, be used to reinforce beneficial rhythms.64 Future studies are warranted to help us better understand the relationships among E/I balance, epilepsy, memory, sleep–wake cycles, and circadian rhythms.
It is important to note that we found that modulation of the aperiodic exponent during the first few months after implantation was associated with clinical response. This advance is significant because previously proposed electrographic biomarkers of response were not predictive of clinical outcomes until months or years of therapy.11, 13 Moreover, future investigations measuring these same features from preimplant recordings during presurgical monitoring could help identify whether this biomarker could be utilized to prognosticate RNS outcomes before implanting the device.
4.5 Limitations
This study is limited by its retrospective nature and modest sample size. A larger, prospective study will be needed to confirm the relationship between baseline rhythmicity of the aperiodic exponent or alpha power and seizure reduction. Because of the inherent heterogeneity of epilepsy, we limited our analysis to patients with mesial temporal lobe epilepsy and leads implanted in the mesial temporal lobe. Additional studies will be necessary to determine whether the features identified here generalize to other types of epilepsy and recordings outside the mesial temporal lobe. Preimplant invasive recordings or scalp electroencephalography recordings could be valuable tools for examining whether circadian rhythmicity extends beyond the mesial temporal lobe or is exclusive to recordings of the epileptic network.
A further limitation of this study is the use of patient-reported outcomes. Although seizure diaries are currently acknowledged as the gold standard for reporting epilepsy outcomes, the accuracy of these measurements can be adversely affected by noncompliance or underreporting due to postictal amnesia or seizures during sleep.65-68 To mitigate a potential source of inaccuracy in patient reporting, we excluded patients with psychogenic nonepileptic seizures. Objective, quantitative biomarkers of seizures are needed to optimize therapy. The RNS System provides quantitative measures of preictal or ictal activity through detection and Long Episode counts. These counts provide a useful proxy for seizure-like activity; however, these measures are sensitive to detection settings. Moreover, the correlation between Long Episodes and electrographic seizures is variable across patients and needs to be confirmed visually.66 Advances in ambulatory epilepsy monitoring systems such as continuous recording hold promise for more accurate, quantitative electrographic biomarkers of epilepsy outcomes.69, 70
Another limitation of this work is the sampling of Scheduled ECoG recordings. The RNS System was programmed to store Scheduled ECoGs, 90 s in duration, every 6 h. For future studies, it would be beneficial to utilize continuous preimplant recordings or ECoGs sampled more frequently throughout the day to better quantify circadian relationships and determine the feasibility of prognosticating RNS outcomes with the aperiodic exponent before device implantation. Moreover, continuous recordings would provide an opportunity to understand how the aperiodic exponent changes leading up to and recovering from pathological activity or stimulation and whether this affects the circadian modulation of the baseline aperiodic exponent.
4.6 Conclusion
This study aimed to characterize the aperiodic exponent, known to reflect E/I balance, as a biomarker of response to RNS. We observed circadian modulation of the aperiodic exponent, where a greater magnitude of day and night modulation was associated with improved seizure outcomes. Our results suggest that previously unidentified changes in circadian features of baseline intracranial power spectra are a biomarker of response to RNS early during therapy and could be used to identify patients likely to respond to RNS.
AUTHOR CONTRIBUTIONS
C.M.C. executed the data analysis and prepared the first manuscript draft; C.M.C., D.N.A., E.H.S., and T.S.D. provided intellectual input into developing and implementing the methodological approach; J.D.R. and C.R.B. provided the computational resources necessary for the completion of the project; E.H.S., A.D.D., J.D.R., and C.R.B. provided project guidance; B.J.N., A.Y.P., and A.M.A. contributed retrospective patient data to the study; and all authors participated in critical review of the manuscript.
ACKNOWLEDGMENTS
This work was supported by National Science Foundation (NSF) Graduate Research Fellowship 1747505 (C.M.C.), National Institutes of Health (NIH) National Institute of Neurological Disorders and Stroke (NINDS) F32 NS 114322 (D.N.A.), NIH NINDS K23 NS 114178 (J.D.R.), NIH P41 GM103545 (C.M.C. and C.R.B.), and NIH UH3 NS109557 (C.M.C. and C.R.B.).
CONFLICT OF INTEREST STATEMENT
A.D.D. holds intellectual property related to neuromodulation therapy. J.D.R. is a consultant for ClearPoint Inc. and prior consultant for Medtronic and NeuroPace. C.R.B. has served as a consultant for NeuraModix and Abbott and holds intellectual property related to neuromodulation therapy. All other authors report no competing interests. We confirm that we have read the Journal's position on issues involved in ethical publication and affirm that this report is consistent with those guidelines.
STANDARD PROTOCOL APPROVALS, REGISTRATIONS, AND PATIENT CONSENTS
The University of Utah Institutional Review Board approved the retrospective data collection and analysis and waived written informed consent.
Open Research
DATA AVAILABILITY STATEMENT
Data associated with the RNS device was obtained through a data use agreement between the University of Utah and NeuroPace and is subject to the following licenses/restrictions: Data in this publication may be made available to researchers for academic use. Requests sent to [email protected] will be reviewed in accordance with NeuroPace data sharing policy.


