Corrigendum
In Janbek J. et al. [1], due to an error in the coding of one of the variables used for an adjustment model, some estimates should be changed for accuracy without affecting the conclusions of this study:
Page 411: In Results section, the MRR value need to be changed. The corresponding sentence should read ‘MRR in dementia/infection was 7.35 (95% confidence interval: 7.25–7.45) and was increased for infections of all sites’.
Page 413: In the second paragraph of Results section, the MRR values in the first sentence should be changed. The corresponding sentence should have read as ‘The fully adjusted MRR for the dementia/infection (after dementia) group was 7.35 (95% confidence interval [CI], 7.25–7.45) compared with the reference group (no dementia/no infection), whereas MRR in the no dementia/infection group was 2.93 (95% CI, 2.91–2.95) and in the dementia/no infection group 3.66 (95% CI, 3.62–3.71)’.
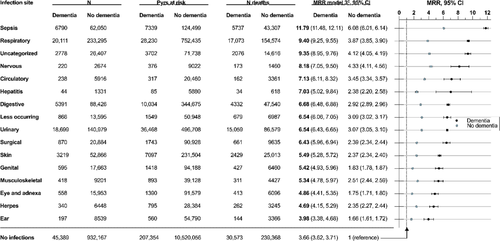
Page 413: In the third paragraph of Results section, the last sentence ‘Highest ratios were seen for sepsis followed by uncategorized infections and infections in the respiratory, circulatory, and nervous systems (Table S7)’ should have read as ‘Highest ratios were seen for sepsis followed by respiratory, uncategorized, nervous, and circulatory infections systems’ (Table S7).
Page 414: In the Table 1, the values under the subheading ‘MRR model 3c, 95% CI’ are incorrect. The correct Table 1 is given below.
| Exposure groups | N | % | Pyrs at risk | N deaths | MRR model 1a, 95% CI | MRR model 2b, 95% CI | MRR model 3c, 95% CI | ||||
|---|---|---|---|---|---|---|---|---|---|---|---|
| All | Dementia | 112,565 | 354,456 | 82,537 | |||||||
| Infection (after) | 30,323 | 26.9 | 57,940 | 24,894 | 10.61 | (10.47, 10.76) | 10.69 | (10.54, 10.83) | 7.35 | (7.25, 7.45) | |
| Infection (before) | 36,853 | 32.7 | 89,162 | 27,070 | 7.78 | (7.67, 7.88) | 7.85 | (7.74, 7.95) | 4.78 | (4.72, 4.84) | |
| No infection | 45,389 | 40.3 | 207,354 | 30,573 | 4.01 | (3.96, 4.06) | 4.07 | (4.02, 4.12) | 3.66 | (3.62, 3.71) | |
| No dementia | 1,383,871 | 12,384,679 | 492,723 | ||||||||
| Infection | 451,704 | 32.6 | 1,864,623 | 253,355 | 4.68 | (4.65, 4.71) | 4.75 | (4.72, 4.78) | 2.93 | (2.91, 2.95) | |
| No infection | 932,167 | 67.4 | 10,520,056 | 239,368 | 1 (ref) | 1 (ref) | 1 (ref) | ||||
| Total | 1,496,436 | 12,739,135 | 575,260 | ||||||||
| Women | Dementia | 70,162 | 233,809 | 51,027 | |||||||
| Infection (after) | 18,364 | 26.2 | 38,408 | 14,914 | 9.48 | (9.32, 9.65) | 9.55 | (9.38, 9.72) | 6.76 | (6.64, 6.88) | |
| Infection (before) | 22,415 | 31.9 | 57,345 | 16,275 | 7.26 | (7.14, 7.39) | 7.32 | (7.20, 7.45) | 4.67 | (4.59, 4.75) | |
| No infection | 29,383 | 41.9 | 138,056 | 19,838 | 3.94 | (3.88, 4.00) | 3.98 | (3.92, 4.04) | 3.67 | (3.61, 3.73) | |
| No dementia | 744,402 | 6,953,106 | 257,446 | ||||||||
| Infection | 237,376 | 31.9 | 1,022,965 | 131,513 | 4.56 | (4.52, 4.60) | 4.61 | (4.57, 4.65) | 2.94 | (2.92, 2.97) | |
| No Infection | 507,026 | 68.1 | 5,930,141 | 125,933 | 1 (ref) | 1 (ref) | 1 (ref) | ||||
| Men | Dementia | 42,403 | 120,646 | 31,510 | |||||||
| Infection (after) | 11,959 | 28.2 | 19,532 | 9980 | 12.51 | (12.25, 12.77) | 12.63 | (12.37, 12.90) | 8.29 | (8.12, 8.47) | |
| Infection (before) | 14,438 | 34.0 | 31,817 | 10,795 | 8.50 | (8.33, 8.67) | 8.61 | (8.44, 8.79) | 4.91 | (4.81, 5.01) | |
| No Infection | 16,006 | 37.7 | 69,297 | 10,735 | 4.04 | (3.96, 4.12) | 4.13 | (4.05, 4.22) | 3.59 | (3.52, 3.67) | |
| No Dementia | 639,469 | 5,431,574 | 235,277 | ||||||||
| Infection | 214,328 | 33.5 | 841,659 | 121,842 | 4.81 | (4.77, 4.85) | 4.91 | (4.87, 4.95) | 2.91 | (2.88, 2.93) | |
| No Infection | 425,141 | 66.5 | 4,589,915 | 113,435 | 1 (ref) | 1 (ref) | 1 (ref) | ||||
Note
- Bolded MRRs are mainly the focus of this paper.
- Abbreviations: CI, confidence interval; MRR, mortality rate ratio; N, number; Pyrs, personyears; ref, reference group.
- a Adjusted for sex, age, and calendar year.
- b Further adjusted for highest attained educational level and civil status; p ≤ 0.00001 for all MRRs.
- c Further adjusted for Charlson Comorbidity Index.
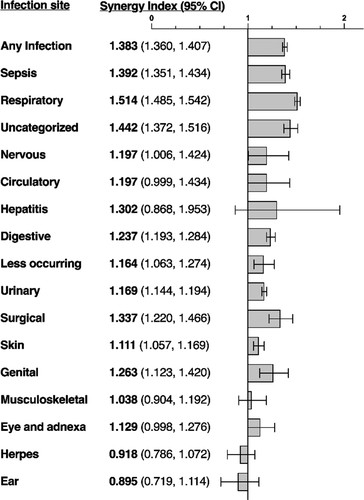
Page 415: In Figure 2 ‘MRR 95% CI’ values are incorrect. The revised Figure 2 is given below.

Page 415: The first paragraph should be updated and it should read as ‘The synergy index for any infection was 1.383 (95% CI, 1.360–1.507) and was highest for infections in the respiratory system followed by uncategorized infections, sepsis, and surgical infections. A nonsignificant synergy index was seen for infections of the eye, musculoskeletal, and circulatory systems as well as for herpes, hepatitis, and ear infections’.
Page 415: In second paragraph of Discussion section, the index value in the first sentence should be updated and should read as ‘A synergy index of 1.383 shows excess mortality risk in people with both dementia and infections that is beyond the mortality risk from either dementia or infections alone and is beyond the added sum of the two mortality risks’.
Page 416: In the fourth paragraph of Discussion section, the MRR values in the second sentence should be changed and should read as ‘Our study showed that increased mortality was higher in all infection sites, and MRRs ranged from 11.79 in people with dementia and sepsis to 3.98 in those with dementia and ear infections’.
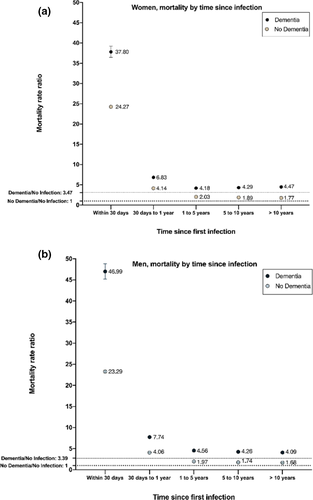
Page 416, 417: MRR Values in Figures 3 and 4 should be updated. Revised figures and its legend are given below.


The authors apologise for errors and inconvenience cause.


