Glutamatergic and dopaminergic neurons in the mouse ventral tegmental area
Abstract
The ventral tegmental area (VTA) comprises dopamine (DA), γ-aminobutyric acid (GABA) and glutamate (Glu) neurons. Some rat VTA Glu neurons, expressing vesicular glutamate transporter 2 (VGluT2), co-express tyrosine hydroxylase (TH). While transgenic mice are now being used in attempts to determine the role of VGluT2/TH neurons in reward and neuronal signaling, such neurons have not been characterized in mouse tissue. By cellular detection of VGluT2 mRNA and TH immunoreactivity (TH-IR), we determined the cellular expression of VGluT2 mRNA within VTA TH-IR neurons in the mouse. We found that some mouse VGluT2 neurons coexpressed TH-IR, but their frequency was lower than in the rat. To determine whether low expression of TH mRNA or TH-IR accounts for this low frequency, we evaluated VTA cellular coexpression of TH transcripts and TH protein. Within the medial aspects of the VTA, some neurons expressed TH mRNA but lacked TH-IR; among them a subset coexpressed VGluT2 mRNA. To determine if lack of VTA TH-IR was due to TH trafficking, we tagged VTA TH neurons by Cre-inducible expression of mCherry in TH::Cre mice. By dual immunofluorescence, we detected axons containing mCherry, but lacking TH-IR, in the lateral habenula, indicating that low frequency of VGluT2 mRNA (+)/TH-IR (+) neurons in the mouse is due to lack of synthesis of TH protein, rather than TH protein trafficking. In conclusion, VGluT2 neurons are present in the rat and mouse VTA, but they differ in the populations of VGluT2/TH and TH neurons. Under normal conditions, the translation of TH protein is suppressed in the mouse mesohabenular TH neurons.
Introduction
The A10 area has dopamine (DA) neurons highly concentrated within three midline nuclei [caudal linear nucleus (CLi), interfascicular nucleus (IF), and rostral linear nucleus of the raphe (RLi)] and two more lateral midbrain nuclei [parabrachial pigmented (PBP) and paranigral nuclei (PN)] that lie just medial to the substantia nigra. The PBP and PN have been classically considered the major nuclei of the ventral tegmental area (VTA) (Swanson, 1982). In addition to DA neurons, γ-aminobutyric acid (GABA) and glutamate neurons are found in the rat A10 area (Hur & Zaborszky, 2005; Kawano et al., 2006; Yamaguchi et al., 2007, 2011; Nair-Roberts et al., 2008; Li et al., 2013; Morales & Root, 2014).
Glutamatergic neurons within the rat A10 area selectively express transcripts encoding vesicular glutamate transporter2 (VGluT2). Whereas most of these VGluT2 neurons lack expression of both protein and mRNA for tyrosine hydroxylase (TH, limiting enzyme for the production of DA) (Yamaguchi et al., 2007), there are some VGluT2 neurons located in the medial PBP, medial PN, CLi, RLi and IF of the rat that coexpress VGluT2 mRNA and TH protein (VGluT2/TH neurons) (Kawano et al., 2006; Yamaguchi et al., 2011). Recent findings from a combination of neuronal tract tracing, in situ hybridization and immunohistochemistry show that in the rat the VGluT2-only neurons and VGluT2/TH neurons each innervate the medial prefrontal cortex and the nucleus accumbens, leading to the suggestion that in addition to the well-recognized mesocorticolimbic DA and GABA pathways, there exists a parallel mesocorticolimbic glutamatergic pathway from VGluT2-only and VGluT2/TH neurons (Yamaguchi et al., 2011).
Although our current understanding of the molecular characteristics of VGluT2 and VGluT2/TH neurons has been obtained from rat brain tissue analysis (Yamaguchi et al., 2011; Li et al., 2013), mice are increasingly used to determine the role of midbrain glutamate and glutamate–DA neurons in brain function (Birgner et al., 2010; Hnasko et al., 2010, 2012; Stuber et al., 2010; Tecuapetla et al., 2010; Alsio et al., 2011; Fortin et al., 2012; Adrover et al., 2014; Chuhma et al., 2014; Nordenankar et al., 2014; Root et al., 2014a,b). However, the VGluT2 and VGluT2/TH neurons in the mouse VTA are not well characterized, and the extent to which these neurons compare with those in the rat VTA is not known. Here, we show that in common with the rat, the mouse VTA has neurons expressing VGluT2 mRNA intermixed with neurons expressing TH protein. In contrast to the rat VTA, however, most of the neurons in the mouse RLi and IF lack detectable levels of TH protein despite expressing both TH mRNA and VGluT2 mRNA. We caution that these mouse RLi and IF neurons expressing TH mRNA could be erroneously classified as non-TH neurons due to their undetectable levels of TH immunoreactivity. However, these RLi and IF neurons can be manipulated in TH::Cre mice because they express the TH promoter, leading to the erroneous assumption that DA-releasing neurons are being manipulated. In addition, we detected in the mouse interpeduncular nucleus (IP), but not the rat, many neurons that lack detectable levels of TH protein but contain TH mRNA.
Materials and methods
Surgical procedure for viral injection
VGluT2::Cre mice [from Dr Kiehn's laboratory (Borgius et al., 2010); background: C57BL/6 J mouse, breeding at least five generations, 25–30 g body weight] and TH::Cre mice [from the Jackson Laboratory, Bar Harbor, ME, USA; strain name: B6.Cg-Tg(TH-cre)1Tmd; background: C57BL/6NJ inbred mouse, 25–30 g body weight] were injected into the VTA with Cre-inducible recombinant adeno-associated virus (AAV) encoding channelrhodopsin-2 (ChR2) tethered to mCherry (VGluT2-mCherry or TH-mCherry mice). Mice were anesthetized with 3% isoflurane (Butler Schein, Dublin, OH, USA). The deeply anesthetized mice were fixed in a stereotaxic apparatus and 0.5 μL (0.1 μL/min) of pAAV-ChR2-mCherry viral vector (AAV-EF1a-DIO-hChR2-mCherry, 3 × 10¹² genomes/mL, UNC Vector Core Facility, Chapel Hill, NC, USA) was injected bilaterally into the VTA (Bregma in mm: AP −3.4, ML ± 0.3, DV −4.3) using a NanoFil syringe with 35 gauge needle (World Precision Instruments, Sarasota, FL, USA). The needle was left in place for 10 min after each injection. Six weeks after the virus injection, the mice were perfused. Mice were housed in groups of up to four animals per cage in an animal room at 22 °C under a 12-h light/dark cycle (lights on at 07:00), with ad libitum access to food and water. Each animal procedure was approved by the NIH/NIDA Animal Care and Use Committee, and experiments were carried out in accordance with the guidelines laid down by the NIH regarding the care and use of animals for experimental procedures.
Tissue preparation
Male Sprague–Dawley rats (260–280 g body weight, n = 3), C57BL/6 mice (25–30 g body weight, n = 10), male VGluT2-mCherry mice (n = 3) and male TH-mCherry mice (n = 3) were anesthetized with chloral hydrate (35 mg/100 g) and perfused transcardially with 4% (w/v) paraformaldehyde (PF) in 0.1 m phosphate buffer (PB), pH 7.3. The brains were left in 4% PF for 2 h at 4 °C, rinsed with PB and transferred sequentially to 12, 14 and 18% sucrose solutions in PB. Coronal serial cryosections of different thickness were prepared: 5 μm (four mice), 10 μm (three mice and three rats) or 12 μm (three mice), and 16 μm for VGluT2-mCherry mice and TH-mCherry mice.
Combination of in situ hybridization and immunolabeling
Coronal free floating cryosections (10, 12 or 16 μm in thickness) or sections collected on glass slides (5 μm in thickness) were processed as described previously [Wang & Morales (2008) for free floating sections, and Morales & Wang (2002) for sections on glass slides]. Different thicknesses were used to maximize detection of signal in individual neurons. The sections were incubated for 10 min in PB containing 0.5% Triton X-100, rinsed 2 × 5 min with PB, treated with 0.2 m HCl for 10 min, rinsed 2 × 5 min with PB and then acetylated in 0.25% acetic anhydride in 0.1 m triethanolamine, pH 8.0, for 10 min. The sections were rinsed 2 × 5 min with PB, and post-fixed with 4% PF for 10 min. Prior to hybridization and after a final rinse with PB, the free-floating sections were incubated in hybridization buffer (50% formamide; 10% dextran sulfate; 5 × Denhardt's solution; 0.62 m NaCl; 50 mm dithiothreitol; 10 mm EDTA; 20 mm PIPES, pH 6.8; 0.2% SDS; 250 μg/mL salmon sperm DNA; 250 μg/mL tRNA) for 2 h at 55 °C. The sections collected on glass slides were dehydrated through a series of graded ethanol solutions (50, 70 and 95%, 5 min for each concentration). The sections were hybridized for 16 h at 55 °C in hybridization buffer containing [35S]- and [33P]-labeled single-stranded antisense or sense TH (nucleotides 14–1165, Accession No. NM_012740), VGluT1 (nucleotides 53–2077, Accession No. NM_053859.1), VGluT2 (nucleotides 317–2357, Accession No. NM_053427), VGluT3 (nucleotides 1–1729, Accession No. BC117229.1) probes at 107 c.p.m./mL. Plasmids that contained the VGluT1 or VGluT2 were provided by Dr Robert H Edwards (University of California, San Francisco). The sections were treated with 4 μg/mL RNase A at 37 °C for 1 h, washed with 1 × SSC, 50% formamide at 55 °C for 1 h, and with 0.1 × SSC at 68 °C for 1 h. After the last SSC wash, the sections were rinsed with PB and incubated for 1 h in PB supplemented with 4% bovine serum albumin and 0.3% Triton X-100. This was followed by overnight incubation at 4 °C with mouse anti-TH monoclonal antibody (1 : 500, MAB 318, Millipore, Billerica, MA, USA) for which specificity has been documented (Tagliaferro & Morales, 2008) or mouse anti-mCherry antibody (632543; Clontech Laboratories Inc., Mountain View, CA, 1 : 500 dilution). After rinsing 3 × 10 min in PB, sections were processed with an ABC kit (Vector Laboratories, Burlingame, CA, USA). The material was incubated for 1 h at room temperature in a 1 : 200 dilution of the biotinylated secondary antibody, rinsed with PB and incubated with avidin-biotinylated horseradish peroxidase for 1 h. Sections were rinsed and the peroxidase reaction was then developed with 0.05% 3, 3-diaminobenzidine-4 HCl (DAB) and 0.03% hydrogen peroxide (H2O2). Free-floating sections were mounted on coated slides. All slides were dipped in Ilford K.5 nuclear tract emulsion (Polysciences, Inc., Warrington, PA, USA; 1 : 1 dilution in double distilled water) and exposed in the dark at 4 °C for 4 weeks prior to development.
Immunofluorescence and confocal microscopy
Free floating coronal sections from the nucleus accumbens (nAcc) and the lateral habenula (LHb) (30 μm in thickness) of TH-mCherry mice were incubated for 1 h in PB supplemented with 4% BSA and 0.3% Triton X-100. Sections were then incubated with a cocktail of two primary antibodies [mouse anti-mCherry antibody (1 : 500, 632543, Clontech Laboratories) + rabbit anti-TH antibody (1 : 1000, AB152, Millipore)] overnight at 4 °C. After rinsing 3 × 10 min in PB, sections were incubated in a cocktail of two corresponding fluorescence secondary antibodies [Alexa Fluor 594-AffiniPure donkey anti-mouse (715-585-151; Jackson ImmunoResearch Laboratories, West Grove, PA, USA; 1 : 100 dilution) + Alexa Fluor 488-AffiniPure donkey anti-rabbit (711-545-152; Jackson ImmunoResearch Laboratories, 1 : 100 dilution)] for 2 h at room temperature. After rinsing, sections were mounted on slides. Fluorescence images were collected with an Olympus FV1000 Confocal System (Olympus, Tokyo, Japan). Images were taken sequentially with different lasers with 20 × or 100 × oil immersion objectives and z-axis stacks were collected at 0.2 μm.
Data analysis of cellular subpopulations
Sections were viewed, analysed and photographed with bright field or epiluminescence microscopy using a Nikon Eclipse E 800 microscope fitted with 4 × and 20 × objective lenses. Single- and double-labeled neurons were observed within each traced region at high power (20 × objective lens) and marked electronically. Subdivisions of the midbrain DA system were traced according to Swanson (1982), Phillipson (1979a,b), Halliday & Tork (1986), German & Manaye (1993), Paxinos & Watson (2007), and Paxinos & Franklin (2001). VGluT2/TH double-labeled material was analysed using epiluminescence to increase the contrast of silver grains (neither dark field nor bright field optics allow clear visualization of silver grains when co-localized with a high concentration of immunoproducts). A cell was considered to express VGluT2 mRNA when its soma contained concentric aggregates of silver particles above background level. A neuron was considered to express TH immunoreactivity when its soma was clearly labeled as brown. A TH-immunolabeled neuron was included in calculation of the total population of TH cells when the stained cell was at least 5 μm in diameter. Cells expressing VGluT2 mRNA, TH immunoreactivity or both markers were counted separately. To determine cellular coexistence of VGluT2 mRNA and TH immunolabel, (i) silver grains corresponding to VGluT2 expression were focused under epiluminescence microscopy, (ii) the path of epiluminescence light was blocked without changing the focus, and (iii) bright field light was used to determine if a brown neuron, expressing TH in focus, contained the aggregates of silver grains seen under epiluminescence. The same method and criteria were applied to determine cellular coexistence of TH mRNA and mCherry immunolabel in VGluT2::Cre mice, as well as VGluT2 mRNA and mCherry immunolabel in TH::Cre mice. Labeled cells were counted three times, each time by a different observer. The background was evaluated from slides hybridized with sense probes. Pictures were adjusted to match contrast and brightness by using the program Adobe Photoshop (Adobe Systems Incorporated, Seattle, WA, USA).
Results
Cellular expression of VGluT2 mRNA, but not VGluT1 or VGluT3 mRNA, in the A10 area
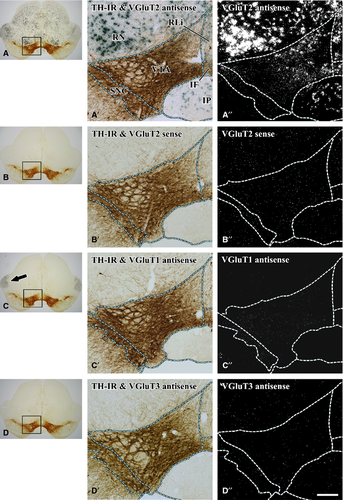
To determine the presence of glutamatergic neurons within the mouse A10 area, we used a combination of radioactive in situ hybridization to identify cellular expression of transcripts encoding VGluT1, VGluT2 or VGluT3, and immunodetection for TH protein (Fig. 1). We detected cells expressing VGluT2 mRNA (but not VGluT1 or VGluT3) intermingled with TH-immunoreactive (TH-IR) cells in the lateral (PBP, PN) and midline nuclei of the A10 area (CLi, IF, RLi) (Fig. 1A–A″). The specificity of the detection of VGluT2 mRNA was confirmed by the lack of signal when sections were hybridized with the VGluT2 radioactive sense riboprobe (Fig. 1B–B″).
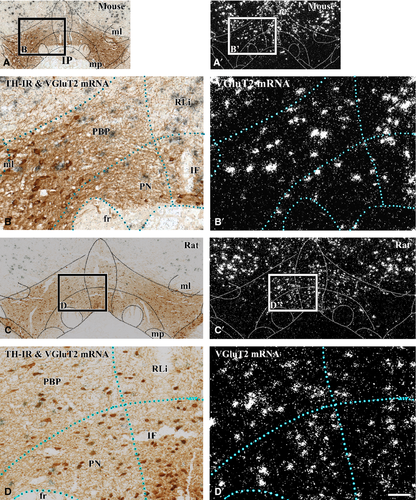
Within the mouse A10 area, neurons expressing VGluT2 mRNA were detected throughout the rostro-caudal levels of the A10 area with a medio-lateral decreasing gradient in concentration (Fig. 2A′ and B′). This mouse VGluT2 cellular pattern of distribution was similar to the one observed in the rat (Fig. 2C′ and D′).
The majority of mouse neurons expressing VGluT2 mRNA lacked TH-IR in the A10 area
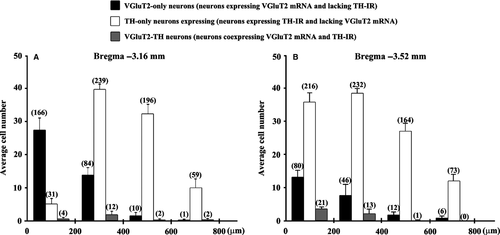
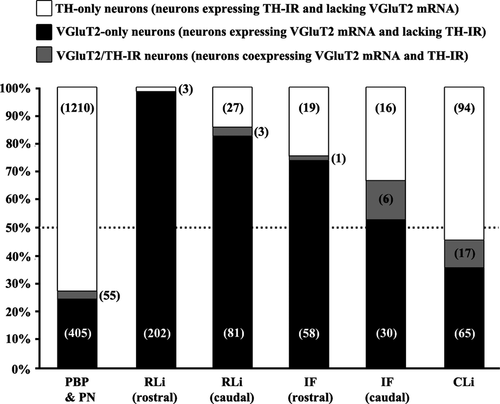
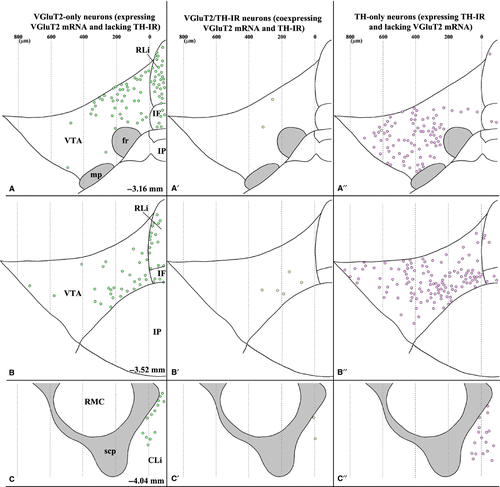
To determine the degree of overlapping between neurons expressing VGluT2 mRNA and those expressing TH-IR in the mouse A10 area, coronal sections were processed for dual detection of VGluT2 mRNA and TH-IR. The latero-medial portions of the PBP and PN contained neurons expressing VGluT2 mRNA (Figs. 3-6); about 10% of them coexpressed TH-IR [55 VGluT2 mRNA (+)/TH-IR (−) neurons from a total population of 460 VGluT2 mRNA (+) neurons, Fig. 5]. These VGluT2 mRNA (+)/TH-IR (+) neurons represented as little as 4% of the PBP–PN TH-IR (+) neurons [55 VGluT2 mRNA (+)/TH-IR (+) neurons from a total population of 1265 TH-IR (+) neurons, Fig. 5]. As observed in the PBP–PN, the majority of VGluT2 mRNA (+) neurons within the midline nuclei also lacked detectable levels of TH-IR (Figs 5 and 6). Within the RLi only 1% of the VGluT2 mRNA (+) neurons were found to coexpress TH-IR [three VGluT2 mRNA (+)/TH-IR (+) neurons from a total population of 286 VGluT2 (+) neurons]. These RLi dual neurons represented about 10% of the TH-IR (+) neurons [three VGluT2 mRNA (+)/TH-IR (+) neurons from a total population of 33 TH-IR (+) neurons]. Within the IF about 7% of the VGluT2 mRNA neurons coexpressed TH-IR [seven VGluT2 mRNA (+)/TH-IR (+) neurons from a total population of 95 VGluT2 mRNA (+) neurons]. The IF VGluT2 mRNA (+)/TH-IR (+) neurons represented about 17% of those containing TH-IR [seven VGluT2 mRNA (+)/TH-IR (+) neurons from 42 TH-IR (+) neurons]. Among the different nuclei of the A10 area, the CLi had the highest proportion of VGluT2 mRNA neurons coexpressing TH-IR in which approximately 20% of the VGluT2-mRNA neurons contained TH-IR [17 VGluT2 mRNA (+)/TH-IR (+) neurons from a total population of 82 VGluT2 mRNA (+) neurons]. The VGluT2 mRNA (+)/TH-IR (+) neurons within the CLi represented about 15% of the TH-IR (+) neurons [17 VGluT2 mRNA (+)/TH-IR (+) neurons from a total population of 111 TH-IR (+) neurons].

A subset of mouse VTA neurons expressed TH mRNA but lacked detectable levels of TH-IR in their cells bodies and processes
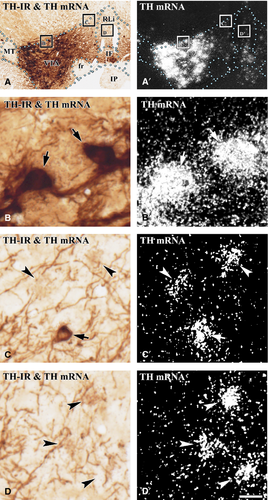
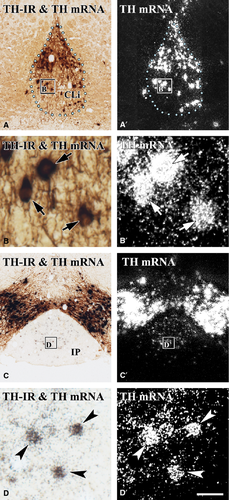
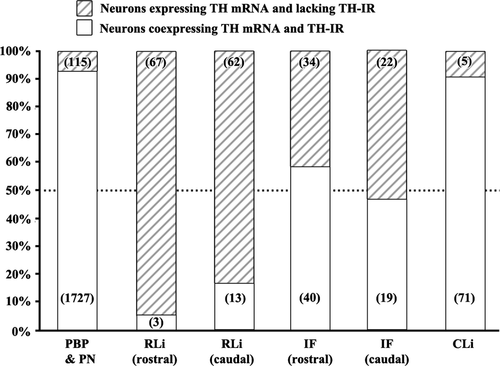
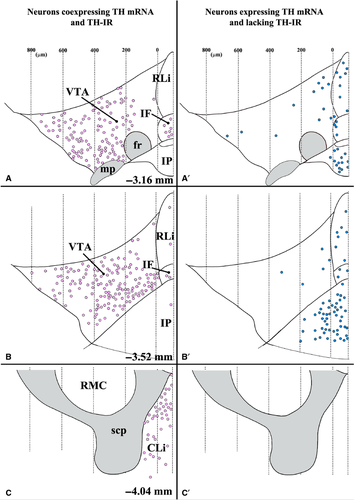
In the mouse, TH-IR (+) neurons were numerous in the lateral aspects of the PBP and PN (Fig. 2B), but infrequent in the RLi and IF (Fig. 2B). In contrast, TH-IR (+) neurons were numerous in all subdivisions of the rat A10 area, including the RLi and IF (Fig. 2D). To examine whether the low numbers of mouse VGluT2 mRNA (+)/TH-IR (−) neurons and mouse TH-IR (−) neurons reflect lack of TH protein or lack of TH mRNA, we next determined the degree of cellular coexpression of TH mRNA and TH protein in the mouse A10 area. More than 90% of the neurons expressing TH mRNA coexpressed TH-IR in the PBP and PN [1727 TH mRNA (+)/TH-IR (+) neurons from a total of 1842 TH mRNA (+) neurons] and in the CLi [71 TH mRNA (+)/TH-IR (+) neurons from a total of 76 TH mRNA (+) neurons] (Figs 7-10). In contrast, a large population of neurons in the RLi and IF containing TH mRNA did not have TH-IR (Figs 7, 9 and 10). About 10% of the neurons expressing TH mRNA coexpressed TH-IR in the RLi [16 TH mRNA (+)/TH-IR (+) neurons from a total of 145 TH mRNA (+) neurons], and about 50% of the neurons expressing TH mRNA coexpressed TH-IR in the IF [59 TH mRNA (+)/TH-IR (+) neurons from a total of 115 TH mRNA (+) neurons] (Figs 9 and 10). Many neurons expressing TH mRNA without detectable levels of TH-IR were also found within the IP, a ventral structure to the IF (Figs 8C–D′ and 10A–B′).
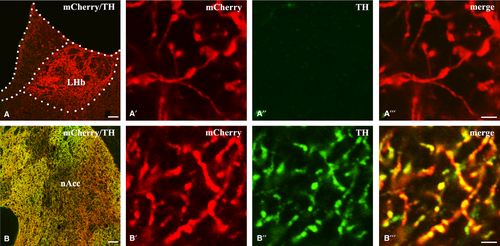
To determine whether the observed lack of TH-IR in the soma is due to anterograde transport, we looked for TH-IR in fibers derived from VTA TH neurons that were tagged in vivo with mCherry by viral vector transduction. We injected into the VTA of TH:Cre transgenic mice a Cre-inducible AAV with double-floxed inverted open reading frame (DIO) expressing genetically engineered ChR2 fused with mCherry, as ChR2 promotes the axonal transfer of mCherry. Because the TH neurons located within the anteromedial VTA provide TH-containing fibers to the LHb in the rat (Swanson, 1982), and because the TH mRNA (+)/TH-IR (−) neurons in the mouse are in the anteromedial VTA, we determined whether mesohabenular fibers expressing mCherry under the TH promoter coexpressed TH-IR. By double immunofluorescence, we found mesohabenular fibers containing high levels of mCherry signal (Fig. 11A′), but lacking detectable levels of TH-IR (Fig. 11A′′), indicating that the LHb is indeed targeted by TH mRNA (+)/TH-IR (−) neurons. In contrast, the VTA innervations to the nAcc containing mCherry (Fig. 11B and B′) also contained TH-IR, cell bodies of which were distributed within the lateral VTA in which TH mRNA (+)/TH-IR (+) neurons, rather than TH mRNA (+)/TH-IR (−) neurons, were present. While we consistently found mCherry-labeled axons without TH-IR in the LHb, we found great variability in the expression of TH-IR within the mCherry-labeled neurons located in the medial aspects of the VTA, where TH mRNA (+)/TH-IR (−) neurons were consistently detected in the wild-type mice. The expression of TH-IR within mCherry-labeled cell bodies located in the midline nuclei may reflect induced translation of TH protein due to the genetic manipulation of the mice or due to the viral infectivity or synthesis of the complex mCherry–ChR2.
Within the RLi, the majority of neurons expressing TH mRNA coexpressed VGluT2 mRNA
As detailed above, the vast majority of RLi neurons that expressed TH mRNA (~ 90%) lacked detectable levels of TH-IR. Thus, the lack of TH-IR in neurons that express TH mRNA may explain, in part, the low numbers of VGluT2 mRNA (+)/TH-IR (+) neurons found in the RLi. To explore this possibility, we used a non-radioactive riboprobe to detect TH mRNA together with a radioactive VGluT2 probe. However, the non-radioactive probe allowed identification of many neurons containing TH mRNA in the PBP, PN and CLi, but none in the RLi. Because neurons expressing TH mRNA were found in the RLi when radioactive riboprobes were used (Fig. 7), we concluded that low levels of TH mRNA expression in the RLi were below the detectable levels permitted by non-radioactive probes. To overcome this limitation, we identified TH neurons by detecting Cre-induced mCherry in the VTA of TH::Cre mice. We confirmed by radioactive in situ hybridization that almost all mCherry-expressing neurons within the A10 area coexpressed TH mRNA [99.2%; 473 TH mRNA (+) neurons from a total of 477 mCherry-IR (+) neurons]. Using a combination of mCherry immunolabeling and detection of VGluT2 mRNA, we found that in the RLi about 68% of mCherry-IR neurons expressed VGluT2-mRNA [124 mCherry-IR (+)/VGluT2 (+) neurons from a total of 182 mCherry-IR (+) neurons]. These findings indicate that the majority of RLi neurons expressing TH mRNA have VGluT2 mRNA, but lack detectable levels of TH protein.
Within the RLi, half of the neurons expressing VGluT2 mRNA coexpress TH mRNA
To further characterize the VGluT2/TH neurons in the RLi within the total population of VGluT2 neurons, we identified VGluT2-expressing neurons by detecting Cre-induced mCherry in the VTA of VGluT2::Cre mice. Using a combination of mCherry immunolabeling and detection of TH mRNA, we found that in the RLi about half of the mCherry-IR neurons coexpressed TH mRNA [20 TH mRNA (+)/mCherry-IR (+) neurons from a total of 51 mCherry-IR (+) neurons].
Discussion
Most of our knowledge on the cellular composition, neuronal connectivity and synaptic interactions of the neurons of the A10 area has been derived from studies in the rat (Phillipson, 1979a; Swanson, 1982; German & Manaye, 1993; Sesack et al., 2003; Margolis et al., 2006; Geisler et al., 2007; Ikemoto, 2007; Sesack & Grace, 2010; Morales & Pickel, 2012; Morales & Root, 2014; Yetnikoff et al., 2014). However, with the increasing availability of tools for specific cellular targeting in genetically modified mice, the mouse is becoming the species of choice for studying the role of specific neuronal phenotypes in reward or aversion (Alsio et al., 2011; Tan et al., 2012; van Zessen et al., 2012; Stamatakis et al., 2013; Ilango et al., 2014; Lammel et al., 2014). Genetically modified mice (Cre recombinase-dependent) are also being used to determine VTA efferents by viral tracing methodologies (Hnasko et al., 2012; Taylor et al., 2014). The present findings reveal that expression of reporter genes under control of the TH promoter in the mouse does not guarantee the selective manipulation or mapping of DA projections. This adds to evidence from the rat that TH, once the standard marker for DA neurons, can identify false positive neurons that express TH protein, but do not package DA in vesicles (Li et al., 2013) for synaptic or parasynaptic release.
The main difference between the rat and mouse A10 areas was found within the population of neurons expressing TH protein. While all rat VTA neurons expressing TH mRNA coexpress detectable levels of TH protein, many neurons in the mouse RLi and IF express TH mRNA without detectable levels of TH protein, some of which express VGluT2. As such, the mouse TH mRNA (+)/TH-IR (−) neurons and the VGluT2-mRNA (+)/TH mRNA (+)/TH-IR (−) neurons can be genetically manipulated, leading to the erroneous conclusion that DA is released from these neurons. Likewise, results from genetic manipulations under control of the VGluT2 promoter may be erroneously ascribed to glutamatergic-only neurons when in truth they should be ascribed to VGluT2-TH neurons. At present the target sites of the mouse VGluT2 mRNA (+)/TH mRNA (+)/TH protein (−) neurons of the RLi and IF are unknown. However, a recent study has shown that RLi and IF neurons expressing mCherry under the VGluT2 promoter and lacking TH immunolabeling project to the ventral pallidum, bed nucleus of the stria terminalis, the magnocellular preoptic nucleus and the olfactory tubercle (Taylor et al., 2014). Thus, these structures could potentially be targeted by both VGluT2-only (comprising half of the VGluT2 neurons in the RLi) and VGluT2 mRNA (+)/TH mRNA (+)/TH protein (−) neurons (comprising ~ 70% of the TH mRNA neurons in the RLi).
VGluT2-only and VGluT2-TH neurons in mouse and rat A10 area
The rat and the mouse contain VGluT2 mRNA-expressing neurons in the lateral and medial nuclei of the A10 area. The mouse VGluT2 neurons, like those of the rat, have a major subpopulation of neurons expressing VGluT2 mRNA but lacking TH-IR (VGluT2-only neurons) and a smaller subpopulation of neurons coexpressing VGluT2 mRNA and TH-IR (VGluT2/TH-IR neurons).
The rat and mouse VGluT2 mRNA-expressing neurons each have a decreasing lateral-to-medial density gradient in which the lateral aspects of the PBP and PN contain VGluT2-only neurons, and the medial aspects (in addition to the VGluT2-only neurons) contain VGluT2/TH-IR neurons. Despite the qualitative similarity, the proportions of VGluT2/TH-IR neurons within the VGluT2 population in the rat and mouse are different. In the rat the subpopulation of VGluT2/TH-IR neurons represents ~ 25% of the neurons expressing VGluT2 mRNA in the lateral PBP, lateral PN and RLi, ~ 30% in the IF and ~ 20% in the CLi (Yamaguchi et al., 2011). In contrast, the mouse subpopulation of VGluT2/TH-IR neurons, with the exception of the CLi, is much smaller than that found in the rat. The mouse VGluT2/TH-IR neurons represent ~ 10% of the neurons expressing VGluT2 in the lateral PBP–PN, ~ 1% in the RLi and ~ 7% in the IF. The only VTA subregion in which the rat and mouse proportion of VGluT2/TH-IR neurons is similar is the CLi, where in both cases the VGluT2/TH-IR neurons represent ~ 20% of the neurons expressing VGluT2.
Within the subdivisions of the A10 area in which VGluT2 neurons are present, the proportion of VGluT2/TH-IR neurons with the TH-IR population also differs between the rat and mouse. We have found by both in situ hybridization and single cell quantitative reverse transcription PCR analysis that almost half of the TH-IR neurons in the rat coexpress VGluT2 mRNA in the medial PBP, medial PN, RLi and rostral IF (Yamaguchi et al., 2011). In contrast, the frequency of VGluT2/TH-IR neurons is much lower (~ 4% in the lateral PBP–PN, ~ 10% in the RLi, ~ 17% in the IF and ~ 15% in the CLi). Thus, we conclude that under normal conditions, most of VGluT2 neurons in the A10 area of the adult rat and adult mouse do not have the ability to co-release DA, and that the proportion of A10 neurons with the capability for this dual co-release is lower in the mouse than in the rat.
TH-IR neurons in the mouse and rat A10 areas
TH immunoreactivity has been used over the last 40 years as the primary marker for the identification of DA neurons in the midbrain (Morales & Pickel, 2012). Recent studies indicate that in the rat A10 area all neurons expressing TH mRNA are TH-IR and are able to synthesize DA, as all of them coexpress aromatic l-amino acid decarboxylase (Li et al., 2013). However, some of these neurons do not have detectable levels of proteins or transcripts encoding molecules for the vesicular transport of DA (vesicular monoamine transporter 2, VMAT2) or its reuptake (DAT). The DA neurons lacking both VMAT2 and DAT signals are restricted to the midline nuclei (CLi, RLi and IF), nuclei for which signaling properties and projection targets remain to be determined (Li et al., 2013). While all TH mRNA neurons in the rat A10 area have detectable levels of TH protein (detected by immunolabeling), the mouse CLi and IF nuclei have many neurons expressing TH mRNA that lack detectable levels of TH protein. The lack of TH protein in the mouse neurons may reflect the presence of a repression mechanism that limits its translation. Regardless, the TH neurons within the midline nuclei of the A10 area in both the rat and the mouse are heterogeneous in their molecular composition. In contrast to the midline nuclei, DA neurons of the lateral aspects of the A10 area and neighboring substantia nigra appear to be less heterogeneous (Li et al., 2013).
In summary, we found that, in common with the rat, the mouse A10 area contains VGluT2, TH and VGluT2/TH neurons. However, unlike the A10 area of the rat, the mouse A10 area contains a group of TH and VGluT2/TH neurons that do not seem to synthesize DA in the adult under normal conditions, as they lack detectable levels of TH protein. Future studies are necessary to determine the extent to which the differences in TH neuronal composition between the rat and mouse A10 areas have functional significance.
Acknowledgements
This work was supported by the Intramural Research Program of the National Institute on Drug Abuse. Research was planned and carried by T.Y., J.Q. and M.M. T.Y., J.Q., H.-L.W., S.Z. and M.M. analysed the data. M.M. wrote the paper with the contribution of all the authors. The authors declare that they do not have any conflicts of interest related to the data presented in this manuscript. We thank Bing Liu for her help in processing brain tissue.
Abbreviations
-
- AAV
-
- adeno-associated virus
-
- ChR2
-
- channelrhodopsin-2
-
- CLi
-
- caudal linear nucleus
-
- DA
-
- dopamine
-
- DAT
-
- dopamine transporter
-
- fr
-
- fasciculus retroflexus
-
- GABA
-
- γ-aminobutyric acid
-
- IF
-
- interfascicular nucleus
-
- IP
-
- interpeduncular nucleus
-
- IR
-
- immunoreactive
-
- LHb
-
- lateral habenula
-
- ml
-
- medial lemniscus
-
- mp
-
- mammillary peduncle
-
- MT
-
- medial terminal nucleus of the accessory optic tract
-
- nAcc
-
- nucleus accumbens
-
- PB
-
- phosphate buffer
-
- PBP
-
- parabrachial pigmented
-
- PF
-
- paraformaldehyde
-
- PN
-
- paranigral nuclei
-
- RLi
-
- rostral linear nucleus of the raphe
-
- RMC
-
- red nucleus magnocellular part
-
- RN
-
- red nucleus
-
- SCP
-
- superior cerebellar peduncle
-
- SNC
-
- substantia nigra compacta
-
- TH
-
- tyrosine hydroxylase
-
- VGluT1
-
- vesicular glutamate transporter type 1
-
- VGluT2
-
- vesicular glutamate transporter type 2
-
- VGluT3
-
- vesicular glutamate transporter type 3
-
- VMAT2
-
- vesicular monoamine transporter 2
-
- VTA
-
- ventral tegmental area


