Temporal regularity facilitates higher-order sensory predictions in fast auditory sequences
Abstract
Does temporal regularity facilitate prediction in audition? To test this, we recorded human event-related potentials to frequent standard tones and infrequent pitch deviant tones, pre-attentively delivered within isochronous and anisochronous (20% onset jitter) rapid sequences. Deviant tones were repeated, either with high or low probability. Standard tone repetition sets a first-order prediction, which is violated by deviant tone onset, leading to a first-order prediction error response (Mismatch Negativity). The response to highly probable deviant repetitions is, however, attenuated relative to less probable repetitions, reflecting the formation of higher-order sensory predictions. Results show that temporal regularity is required for higher-order predictions, but does not modulate first-order prediction error responses. Inverse solution analyses (Variable Resolution Electrical Tomography; VARETA) localized the error response attenuation to posterior regions of the left superior temporal gyrus. In a control experiment with a slower stimulus rate, we found no evidence for higher-order predictions, and again no effect of temporal information on first-order prediction error. We conclude that: (i) temporal regularity facilitates the establishing of higher-order sensory predictions, i.e. ‘knowing what next’, in fast auditory sequences; (ii) first-order prediction error relies predominantly on stimulus feature mismatch, reflecting the adaptive fit of fast deviance detection processes.
Introduction
Regularities are key to auditory perception as they afford fast recognition of sequential relationships in input (e.g. links between successive speech units; Kiebel et al., 2009) and promote perceptual object formation in complex auditory scenes (Winkler et al., 2009). Recent theories argue for a principled distinction between ‘temporal’ regularities, such as constancy in stimulus-onset time, and ‘formal’ regularities, which pertain to the predictability of stimulus features (Hughes et al., 2012; Schwartze et al., 2012; Waszak et al., 20121). Formal regularities come in different degrees of complexity. The frequent repetition of a tone sets a first-order formal regularity. The onset of an infrequent deviant tone elicits a first-order prediction error response, the Mismatch Negativity (MMN) component of the event-related potentials (ERPs; Garrido et al., 2009; Bendixen et al., 2012). However, if the onset of the deviant tone obeys a higher-order formal regularity, the ensuing error response is largely attenuated. Sussman & Winkler (2001) first showed that at fast stimulation rates (6.7 Hz), deviant tone repetitions with 100% probability yield no appreciable MMN, while deviant repetitions with only 50% probability elicit a robust MMN. They proposed that the human brain uses contextually valid rules to minimize activation for uninformative or unsurprising events. Conceptually, such a stance is akin to a novel approach to repetition suppression (Summerfield et al., 2008; Kovács et al., 2012), which challenged the neuronal ‘fatigue’ account (Ulanovsky et al., 2004; Grill-Spector et al., 2006) by suggesting that response attenuation is mainly driven by contextually valid expectations. Using functional magnetic resonance imaging, Summerfield et al. (2008) demonstrated that highly probable repetitions of face pictures lead to a significantly smaller blood oxygen level-dependent contrast than improbable repetitions. Other studies have then replicated the interaction between repetition and repetition probability (Summerfield et al., 2011; Todorovic et al., 2011).
Very little is known about the extraction of repetition probability as a higher-order regularity. We adapted the design by Sussman & Winkler (2001) to verify whether constancy in tone onset modulates first-order prediction error, or facilitates the formation of higher-order sensory predictions based on deviant repetition probability. The available evidence is inconclusive. At slow stimulation rates (≤ 2 Hz), irregularity in stimulus-onset time appears to hinder standard repetition effects, i.e. first-order prediction, in complex sequences (Costa-Faidella et al., 2011), but does not affect the MMN to pitch deviants (Schwartze et al., 2011). Slow stimulation rates may be suboptimal to investigate between-sound relationships as reflected by the MMN response, including temporal ones (Yabe et al., 1998; Sussman & Gumenyuk, 2002; Wacongne et al., 2012). Thus, to tackle our research question, we embedded highly probable (predictable) and less probable (unpredictable) deviant repetitions within isochronous (regular onset) and anisochronous (irregular onset) fast sequences.
Materials and methods
Participants
Fifteen healthy volunteers (seven female, mean age 25.7 ± 3.6 years, range 20–30 years) participated in the study for paid compensation or course credit. All participants self-reported normal hearing, no history of neurological or psychiatric disorders, and no medication affecting the CNS. Participants gave their written informed consent according to the Declaration of Helsinki. Their data were analysed anonymously. Participants were assigned a progressive numerical code, which did not include information about their identity. We followed the ethical guidelines of The German Psychological Society (‘Deutsche Gesellschaft für Psychologie’, DGPs: http://www.dgps.de/dgps/aufgaben/ethikrl 2004.pdf). Thus, this experiment did not require any additional ethical approval.
Stimuli and experimental design
The stimuli were two sine tones, a 500-Hz standard tone and a 560-Hz deviant tone (Δf = ˜2 semi-tones in the even-tempered scale), binaurally presented via headphones in pseudo-randomized oddball series, with the constraint that at least two standard tones appeared before a deviant. Tones were played at an intensity of 55 dB sensation level. Hearing thresholds for the standard tone frequency were individually measured using a detection task alternated twice for each ear (for details on the procedure, see Kaernbach, 1990). Within- and between-ear threshold differences never exceeded 10 dB. Tone duration was 50 ms, including 5 ms rise and 5 ms fall times. Tone sequences were presented using Cogent2000v1.25 (Cogent 2000 Team, University of London, UK). Participants sat in an electrically shielded, sound-attenuated chamber. They were instructed to ignore the auditory stimulation and watch a silenced, subtitled movie of their choice on a computer screen in front of them (distance = 120 cm).
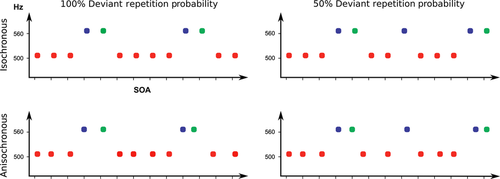
Figure 1 schematically pictures the experimental design. Stimulus-onset asynchrony (SOA) was set to 150 ms. The onset of first deviant tones was always unpredictable, and violated in the pitch dimension the first-order formal regularity established by standard tone repetition. We assume that also the repeated deviant tone violated the first-order regularity established by standard tones. In both cases, a first-order prediction error response is elicited. Two ‘repetition probability’ conditions were created: in a ‘high-repetition probability’ condition, deviant tones were always repeated; in a ‘low-repetition probability’ condition, deviant tones were either repeated or followed by a standard tone with equal probability. Two ‘temporal regularity’ conditions were created, producing ‘isochronous’ and ‘anisochronous-onset’ sequences. Large jitter values may induce significant differences in single-trial peak latencies, leading to an artifactual reduction of event-related deflection amplitudes (low-pass effect of averaging procedure; see Spencer, 2005). We thus kept anisochrony to a perceptible minimum, limiting the SOA jitter to ± 20% (in randomized steps of 5 ms, range 120–180 ms, uniform distribution). The same number of deviant pairs was used in both deviant repetition probability conditions. In the high-repetition probability condition, there were 1200 standard and 240 deviant stimuli, accounting for 120 deviant pairs. Standard tones had a probability of 83.33%, and deviant tones 16.67% (each deviant considered as a single event). They were administered in one block of about 3.6 min. In the low-repetition probability condition, global oddball values were adapted to 87% standard and 13% deviant tones: 2400 standard, 360 deviant stimuli, accounting for 120 deviant pairs and 120 single deviant tones (one block, about 6.9 min). This way, we could control for refractoriness-dependent differences on the elicitation of first deviant N1 amplitudes, as the length of standard sequences (mean n = 10) before first deviant onset was the same across higher-order formal regularity conditions: high-repetition probability, 1200 standards/120 first deviants; low-repetition probability, 2400 standards/240 first deviants, pooled from both paired and single events. Block order presentation was randomized within subjects. An additional condition with repetition probability set to 75% was also included. Its effects are reported in the Supporting Information, section A, as they were uninformative to the aims of distinguishing between high and low deviant repetition probabilities.
Electrophysiological data recording and analysis
Electroencephalogram (EEG) was continuously recorded using an ActiveTwo amplifier system (BioSemi, Amsterdam, the Netherlands; http://www.biosemi.com), with a 64-electrode cap according to the extended 10/20 system (Nuwer et al., 1998). Horizontal and vertical eye movements were monitored using electrodes placed below the outer canthi of both eyes and at the nasion. Additional electrodes were placed at the tip of the nose, and left and right mastoid sites. EEG and electrooculogram (EOG) activities were sampled at 512 Hz, and EEG activity was off-line re-referenced to the electrode placed at the tip of the nose. Then, EOG artifact correction by regression was applied as described in Schlögl et al. (2007), with offline passband 0.2–100 Hz (Kaiser Window, Beta 5.6533, filter order 4637 points). A 25-Hz low-pass filter with the same filter order was applied to the EOG artifact-corrected data before epoching. Channels with technical malfunction (range 1–4 in seven out of 15 subjects) were interpolated using spherical spline interpolation (Perrin et al., 1989, 1990).
Epochs started 50 ms before and ended 250 ms after tone onset. As in our paradigm there is no standard after the first deviant in deviant pairs, the same standard ERP served for comparison for both first and repeated deviant ERPs. Epochs were averaged separately for standard stimuli (excluding the standard tone after the repeated deviant, and after single deviants), first and repeated deviant tones both drawn from pairs. Baseline correction (−50 to 0 ms) was applied to both first and repeated deviant epochs. First deviant baseline mean values were used to baseline-correct repeated deviant epochs. This procedure resolved any confounding effect for repeated deviant processing arising from baselining during first deviant processing. Epochs containing amplitude changes exceeding 100 μV at any EEG channel were excluded (3.4% on average across conditions per subject, range 0.1–9.6%).
Before entering statistical analysis, ERP amplitudes were re-referenced to the averaged mastoid recordings to obtain an estimate of the full MMN amplitude (Schröger, 1998). MMN is best seen at frontocentral sites in the difference waves obtained subtracting the standard from the deviant ERPs (Schröger, 2005). Mean voltage amplitudes were calculated within a pre-defined time window between 125 and 165 ms after sound onset (around deviant N1 peak). The deviance response highlighted by the difference waves is presumably partly comprised of N1 refractoriness effects and MMN (Schröger, 1998, 2005). For simplicity, we refer to it as MMN.
Data were subjected to a series of univariate repeated-measures analyses of variance (anovas). The modulation of first-order prediction error was tested separately for first and repeated deviant tones on N1 amplitudes in the MMN latency range at Fz by an anova with the factors stimulus type (deviant vs. standard), repetition probability (referring to deviant repetition: high vs. low) and temporal regularity (anisochronous vs. isochronous sequences). Higher-order formal regularity effects were tested on the deviant minus standard difference waves (i.e. the MMN component) by an anova with the factors repetition (first vs. repeated deviant), repetition probability (high vs. low) and temporal regularity (anisochronous vs. isochronous). To check for differences in the distribution of MMN as a function of repetition and/or repetition probability, four regions of interest (ROIs) were defined: left (F5, FC5, C5); center-left (F1, FC1, C1); center-right (F2, FC2, C2); and right (F6, FC6, C6). Scalp potential (SP) measures and scalp current density (SCD) values were computed for each ROI as the mean across electrode locations. Voltage measures were transformed into current density estimates by computing the second spatial derivative of the interpolated voltage distribution (Perrin et al., 1989, 1990), with maximum degree of Legendre polynomials set to 50, order of splines (m) equal to 4, and a smoothing parameter of 10−5. This way we obtained reference-free distribution maps of local current sources/sinks (radial current flow through the skull measured in mA/m3; Srinivasan, 2005). Four-way anovas with factors repetition, repetition probability, laterality (central vs. lateral) and side (left vs. right) were separately run for each temporal regularity condition on SP measures and SCD estimates. IBM SPSS Statistics for Windows, Version 20.0 (IBM; Armonk, NY, USA) was used for statistical analyses.
Brain electrical tomographic procedures were applied to detect the presence of differences in MMN generator location, using the distributed inverse solution VARETA approach (Variable Resolution Electrical Tomography; Bosch-Bayard et al., 2001). VARETA reconstructs brain sources by estimating the spatially smoothest intracranial primary current density (PCD) distribution that is compatible with the observed scalp voltages, and restricts the allowable solutions to the gray matter on the basis of probabilistic Montréal Neurological Institute (MNI) 3D brain tissue maps (Evans et al., 1993; Trujillo-Barreto et al., 2004). Statistical parametric maps (SPMs) of the PCD estimates were then constructed based on a voxel by voxel Hotelling T2 test against zero (threshold: P < 10−4) to determine the sources of the MMN component separately for each condition and for the relevant contrast between solutions. The PCD is a vector quantity, that is, at each voxel the three projections of the PCD vector onto the three orthogonal directions in the 3D Cartesian space are estimated. This asks for a multivariate T2 statistic at each voxel to test for changes in magnitude as well as orientation of the PCD vector. Significance threshold correction to account for spatial dependencies between voxels was calculated by means of random field theory (Worsley et al., 1996). Results are shown as 3D images.
Control experiment
To verify if indeed a slower stimulus rate (SOA = 600 ms, 1.67 Hz) is suboptimal to demonstrate the interaction of temporal and formal regularities, we conducted a separate experiment with 16 participants (seven of them having previously participated in the fast rate experiment, one excluded for excessive artifact rejection rates, resulting in a final pool of 15 participants). In this case, we used a 32-electrode set (10–20 system), and chose a common deviant probability value across blocks (16.67%), under the assumption that refractoriness issues are less relevant at larger SOA values (for an illustration of the effects of refractoriness on deviant N1 in rapid auditory trains, see the Supporting Information, section B). Anisochrony was limited to a ± 20% SOA jitter, as in the main experiment. Blocks comprised three different deviant repetition probability levels: 50%, 75% and 100%, administered in either ascending or descending order, counterbalanced between subjects. For the sake of the present analysis, only 50% and 100% blocks were considered (for the 75% probability level, see the Supporting Information, section A). EEG processing parameters and statistical analyses were unchanged, except that each ERP was individually baselined. The slow presentation rate yielded a more distinct N1, so that the N1 and MMN could be disentangled in time (at Fz, the N1 was analysed in a 90–130-ms window and the N2/MMN in a 150–190-ms window).
Results
First-order prediction error
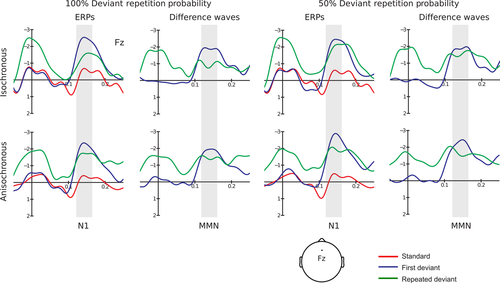
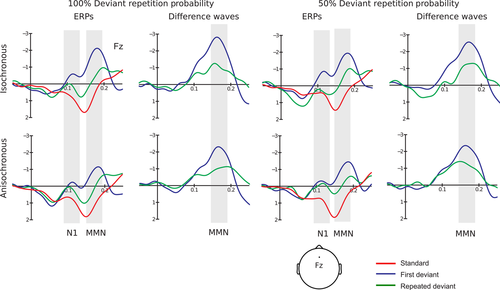
A significant effect of stimulus type was found for the N1 responses to both first and repeated deviant tones. First deviant tones significantly differed from standard tones: F1,14 = 45.386, P < 0.001, partial η2 = 0.764. The response to first deviant tones (mean = −2.368 μV, SE = 0.273 μV) was more negative than the standard tone response (mean = −0.386 μV, SE = 0.056 μV). Repeated deviant tones also significantly differed from standard tones: F1,14 = 20.911, P < 0.001, partial η2 = 0.599. Again, the response to deviant tones (mean = −1.747 μV, SE = 0.279 μV) was more negative than the standard tone response (see the main experiment section of Table 1 for the omnibus anova results. As there was no significant temporal regularity × stimulus type interaction, we infer that temporal information does not enter the computation of first-order prediction error in fast auditory sequences. Figure 2 displays the grand average standard, first and repeated deviant ERPs, overlaid for a direct comparison.
| Main experiment | N1 | |||
|---|---|---|---|---|
| First deviant tone | Repeated deviant tone | |||
| F value | P value | F value | P value | |
| N1 at Fz electrode | ||||
| Stimulus type × Repetition probability × Temporal regularity | 0.675 | 0.425 | 1.289 | 0.275 |
| Stimulus type × Repetition probability | 0.444 | 0.516 | 2.695 | 0.123 |
| Stimulus type × Temporal regularity | 0.330 | 0.575 | 1.693 | 0.214 |
| Temporal regularity × Repetition probability | 1.878 | 0.192 | 0.478 | 0.501 |
| Stimulus Type | 45.386 | < 0.001 | 20.911 | < 0.001 |
| Repetition Probability | 0.444 | 0.516 | 2.741 | 0.120 |
| Temporal regularity | 0.084 | 0.776 | 0.027 | 0.871 |
| N1 | N2 | |||||||
|---|---|---|---|---|---|---|---|---|
| Control experiment | First deviant tone | Repeated deviant tone | First deviant tone | Repeated deviant tone | ||||
| F value | P value | F value | P value | F value | P value | F value | P value | |
| N1 & N2 at Fz electrode | ||||||||
| Stimulus type × Repetition probability × Temporal regularity | 0.184 | 0.675 | 0.694 | 0.419 | 0.132 | 0.722 | 0.000 | 0.996 |
| Stimulus type × Repetition probability | 0.433 | 0.521 | 0.130 | 0.724 | 0.017 | 0.897 | 0.474 | 0.503 |
| Stimulus type × Temporal regularity | 0.063 | 0.806 | 1.471 | 0.245 | 4.093 | 0.063 | 0.038 | 0.848 |
| Temporal regularity × Repetition probability | 0.003 | 0.956 | 0.148 | 0.707 | 0.610 | 0.448 | 0.287 | 0.601 |
| Stimulus Type | 13.382 | < 0.01 | 8.085 | 0.013 | 75.760 | < 0.001 | 21.579 | < 0.001 |
| Repetition Probability | 0.568 | 0.463 | 0.029 | 0.866 | 0.048 | 0.830 | 0.555 | 0.468 |
| Temporal regularity | 3.248 | 0.093 | 0.445 | 0.516 | 30.533 | < 0.001 | 13.216 | < 0.01 |
Higher-order predictions
Table 2 (main experiment section) shows the relevant omnibus anova results on MMN amplitudes. Crucially, the repetition × repetition probability × temporal regularity interaction was significant: F1,14 = 5.859, P = 0.030, partial η2 = 0.295. Follow-up tests were conducted separately for the two temporal regularity levels. A significant repetition × repetition probability interaction emerged within isochronous sequences: F1,14 = 5.313, P = 0.037, partial η2 = 0.275. A significant difference between first deviant tones and highly probable deviant tone repetitions was shown using t-tests: t14 = −2.376, P = 0.032. The response to highly probable deviant repetitions (mean = −0.926 μV, SE = 0.377 μV) was largely attenuated compared with the first deviant tone response (mean = −1.893 μV, SE = 0.505 μV). No difference was found between first deviant tone and less probable deviant tone repetitions: t14 = −0.733, P = 0.475. The response to less probable deviant repetitions (mean = −1.548 μV, SE = 0.333 μV) was similar to the first deviant tone response (mean = −1.885 μV, SE = 0.363 μV). Within anisochronous sequences, the repetition × repetition probability interaction was not significant: F1,14 = 0.487, P = 0.497. The response to highly probable deviant repetitions (mean = −1.418 μV, SE = 0.430 μV) was similar to the first deviant tone response (mean = −1.896 μV, SE = 0.344 μV). Likewise, the response to less probable deviant repetitions (mean = −1.593 μV, SE = 0.250 μV) was similar to the first deviant tone response (mean = −2.294 μV, SE = 0.348 μV). The pattern of significant findings suggests that temporal information is required for the computation of higher-order predictions in audition based on deviant repetition probability (see Fig. 2).
| Main experiment | ||
|---|---|---|
| F value | P value | |
| MMN at Fz | ||
| Repetition × Repetition probability × Temporal regularity | 5.859 | 0.030 |
| Repetition × Repetition probability | 0.722 | 0.410 |
| Repetition × Temporal regularity | 0.039 | 0.846 |
| Temporal regularity × Repetition probability | 0.003 | 0.960 |
| Repetition | 3.820 | 0.071 |
| Repetition Probability | 1.518 | 0.238 |
| Temporal regularity | 0.930 | 0.351 |
| Isochronous sequences | Anisochronous sequences | |||
|---|---|---|---|---|
| F value | P value | F value | P value | |
| MMN: Scalp potential distribution | ||||
| Repetition × Repetition probability × Laterality × Side | 0.177 | 0.680 | 1.027 | 0.328 |
| Repetition × Repetition probability × Laterality | 4.605 | 0.050 | 0.532 | 0.478 |
| Repetition × Repetition probability × Side | 0.047 | 0.831 | 1.358 | 0.263 |
| Repetition × Laterality × Side | 0.646 | 0.507 | 6.355 | 0.024 |
| Repetition probability × Laterality × Side | 0.610 | 0.448 | 0.196 | 0.665 |
| Repetition × Side | 0.139 | 0.715 | 1.696 | 0.214 |
| Repetition × Laterality | 1.102 | 0.312 | 0.952 | 0.346 |
| Repetition × Repetition probability | 3.872 | 0.069 | 0.244 | 0.629 |
| Repetition probability × Side | 4.614 | 0.050 | 0.155 | 0.699 |
| Repetition probability × Laterality | 0.008 | 0.931 | 0.000 | 1.000 |
| Laterality × Side | 1.250 | 0.282 | 0.029 | 0.867 |
| Repetition | 3.651 | 0.077 | 4.454 | 0.053 |
| Repetition Probability | 0.077 | 0.786 | 1.854 | 0.195 |
| Laterality | 25.729 | < 0.001 | 29.819 | < 0.001 |
| Side | 1.209 | 0.290 | 0.128 | 0,726 |
| Isochronous sequences | Anisochronous sequences | |||
|---|---|---|---|---|
| F value | P value | F value | P value | |
| MMN: Scalp current density | ||||
| Repetition × Repetition probability × Laterality × Side | 0.690 | 0.420 | 2.004 | 0.179 |
| Repetition × Repetition probability × Laterality | 0.760 | 0.398 | 1.855 | 0.195 |
| Repetition × Repetition probability × Side | 0.096 | 0.761 | 0.207 | 0.656 |
| Repetition × Laterality × Side | 0.013 | 0.910 | 3.256 | 0.093 |
| Repetition probability × Laterality × Side | 0.123 | 0.731 | 0.074 | 0.789 |
| Repetition × Side | 0.049 | 0.828 | 1.279 | 0.277 |
| Repetition × Laterality | 0.572 | 0.462 | 3.502 | 0.082 |
| Repetition × Repetition probability | 5.477 | 0.035 | 1.958 | 0.184 |
| Repetition probability × Side | 0.919 | 0.354 | 0.222 | 0.645 |
| Repetition probability × Laterality | 0.798 | 0.387 | 0.010 | 0.922 |
| Laterality × Side | 0.411 | 0.532 | 0.033 | 0.859 |
| Repetition | 5.802 | 0.030 | 3.604 | 0.078 |
| Repetition Probability | 3.860 | 0.070 | 0.597 | 0.453 |
| Laterality | 1.958 | 0.184 | 0.053 | 0.821 |
| Side | 7.264 | 0.017 | 0.026 | 0.875 |
| Control experiment | ||
|---|---|---|
| F value | P value | |
| MMN at Fz | ||
| Repetition × Repetition probability × Temporal regularity | 0.128 | 0.726 |
| Repetition × Repetition probability | 0.350 | 0.563 |
| Repetition × Temporal regularity | 0.937 | 0.349 |
| Temporal regularity × Repetition probability | 0.058 | 0.813 |
| Repetition | 14.541 | < 0.01 |
| Repetition Probability | 0.169 | 0.721 |
| Temporal regularity | 1.198 | 0.298 |
SP distribution
The four-way interaction of repetition, repetition probability, laterality and side was not significant within either temporal regularity level (see the main experiment section of Table 2). However, within isochronous sequences a significant repetition × repetition probability × laterality interaction was found: F1,14 = 4.605, P = 0.05, partial η2 = 0.248. Follow-up tests were conducted separately for central and lateral electrode positions. A significant repetition × repetition probability interaction emerged for centrally located electrodes: F1,14 = 5.071, P = 0.041, partial η2 = 0.266. A significant difference between first deviant tones and highly probable deviant repetitions was shown using t-tests: t14 = −2.692, P = 0.018. Here too, the response to highly probable deviant repetitions (mean = −0.912 μV, SE = 0.362 μV) was largely attenuated compared with the first deviant tone response (mean = −1.878 μV, SE = 0.504 μV). And again, no difference was found between first deviant tones and less probable deviant repetitions: t14 = −0.893, P = 0.387. As for lateral electrodes, the repetition × repetition probability interaction was not significant: F1,14 = 2.274, P = 0.154. The error response attenuation effect reflecting higher-order predictions is thus localized at frontocentral electrode locations, irrespective of side. Additionally, the omnibus anova yielded a significant repetition probability × side interaction: F1,14 = 4.614, P = 0.05, partial η2 = 0.248. However, follow-up t-tests failed to reach statistical significance (all P ≥ 0.12).
Within anisochronous sequences, we further observed a significant repetition × laterality × side interaction: F1,14 = 6.355, P < 0.024, partial η2 = 0.312. Follow-up tests were conducted separately for central and lateral electrode positions. A main effect of repetition was found at central electrode locations: F1,14 = 4.620, P < 0.050, partial η2 = 0.248. First deviant tones (mean = −1.847 μV, SE = 0.274 μV) yielded a larger response than deviant tone repetitions (mean = −1.307 μV, SE = 0.303 μV). As for lateral electrode locations, the factor repetition as well as the repetition × side interaction only approached significance: F1,14 = 4.187 and 3.811, P = 0.060 and 0.071, respectively. Additionally, the omnibus anova showed a main effect of laterality: F1,14 = 29.819, P < 0.001, partial η2 = 0.681. Larger negative values were found at central (mean = −1.577 μV, SE = 0.260 μV) rather than at lateral electrode locations (mean = −1.092 μV, SE = 0.219 μV).
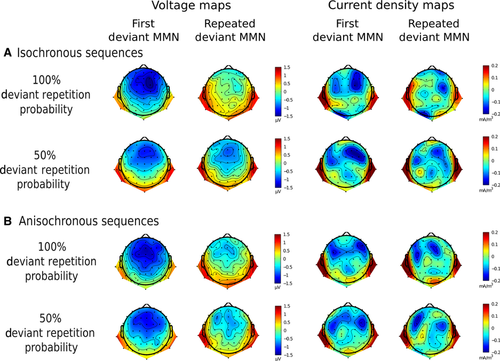
Figure 3A and B displays nose-referenced SP maps to evidence polarity inversion below the Sylvian fissure.
SCD
At visual inspection, SCD maps display two main source–sink configurations, one in each hemisphere, with current sources below the Sylvian fissure and current sinks at frontocentral leads (Fig. 3A). The omnibus anova (Table 2) showed a significant repetition × repetition probability interaction within isochronous sequences: F1,14 = 5.477, P = 0.035, partial η2 = 0.281. A significant difference between first deviant tones and highly probable deviant repetitions was documented using t-tests: t14 = −2.365, P = 0.033. The response to highly probable deviant repetitions (mean = −0.099 mA/m3, SE = 0.101 mA/m3) was attenuated compared with first deviant tone response (mean = −0.045 mA/m3, SE = 0.085 mA/m3). No significant difference was found between first deviant tone and less probable deviant tone repetitions: t14 = −1.227, P = 0.240. This suggests a marked attenuation of the frontocentral sinks underlying predictable repeated deviant MMN responses. Additionally, a main effect of side was found: F1,14 = 7.264, P = 0.017, partial η2 = 0.342. Larger current density values were found over the right hemisphere (mean = −0.078 mA/m3, SE = 0.019 mA/m3) than over the left hemisphere (mean = −0.040 mA/m3, SE = 0.013 mA/m3).
Source analysis
SPMs of the MMN component generator locations were computed for repeated deviant responses in all conditions (Fig. 4). Activation maxima were found in the left superior temporal gyrus (STG). Highly probable deviant repetitions in isochronous sequences activated the STG, bilaterally, frontally extending to the insula, precentral gyrus, inferior frontal gyrus, right lateral orbitofrontal gyrus and to the middle temporal gyrus (MTG). Less probable deviant repetitions in isochronous sequences showed bilateral activations within the STG and MTG, extending posteriorly to the left postcentral and supramarginal gyri. Highly probable deviant repetitions in anisochronous sequences activated the left STG, left postcentral and supramarginal gyri, but also the superior frontal and middle frontal gyri. Finally, less probable deviant repetitions in anisochronous sequences activated the STG, bilaterally, the supramarginal gyri and MTG.
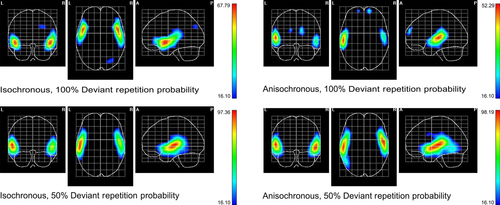
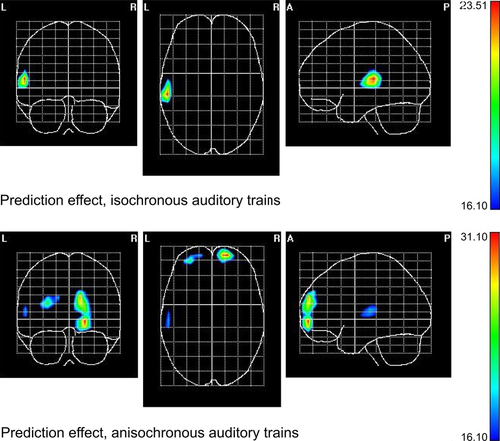
Figure 5 shows the SPMs for the deviant repetition probability contrasts (high vs. low) highlighting the regions of response attenuation to predictable deviant repetitions in both temporal regularity conditions. Within isochronous sequences, a maximum in the posterior regions of the left STG is evident, extending also to postcentral and supramarginal gyri. Within anisochronous sequences, the maximum is located in the right middle frontal gyrus. Table 3 displays the MNI coordinates for the maxima in all conditions, and for the selected contrasts.
| Talairach coordinates | Anatomical description | |
|---|---|---|
| Experimental condition | ||
| Isochronous, highly probable deviant repetition | X = −50, Y = 2, Z = −10 | Left superior temporal gyrus |
| Isochronous, less probable deviant repetition | X = −57, Y = −26, Z = 5 | Left superior temporal gyrus |
| Anisochronous, highly probable deviant repetition | X = −57, Y = −26, Z = 5 | Left superior temporal gyrus |
| Anisochronous, less probable deviant repetition | X = −57, Y = −33, Z = 12 | Left superior temporal gyrus |
| Deviant repetition probability contrasts | ||
| Isochronous contextual prediction | X = −57, Y = −26, Z = 12 | Left superior temporal gyrus |
| Anisochronous contextual prediction | X = 25, Y = 60, Z = 17 | Right middle frontal gyrus |
Control experiment
First-order prediction error
In the N1 window, a main effect of stimulus type was found for both first and repeated deviant tones. First deviant tones significantly differed from standard tones: F1,14 = 13.382, P < 0.01, η2 = 0.489. The response to standard tones (mean = 0.595 μV, SE = 0.281 μV) was more positive than the first deviant tone response (mean = −0.055 μV, SE = 0.333 μV). Repeated deviant tones also significantly differed from standard tones: F1,14 = 8.085, P = 0.013, partial η2 = 0.366. The response to standard tones was more positive than the repeated deviant tone response (mean = −0.162 μV, SE = 0.234 μV).
In the N2 window, the main effects of stimulus type and temporal regularity were found for both first and repeated deviant tones. First deviant tones significantly differed from standard tones: F1,14 = 75.760, P < 0.001, η2 = 0.844. The response to first deviant tones (mean = −1.258 μV, SE = 0.598 μV) was more negative than the standard tone response (mean = 1.012 μV, SE = 0.499 μV). Tones delivered within isochronous sequences significantly differed from those delivered within anisochronous sequences: F1,14 = 30.533, P < 0.001, η2 = 0.686. The responses recorded to temporally regular tones (mean = −0.406 μV, SE = 0.541 μV) were more negative than those recorded to temporally irregular tones (mean = 0.161 μV, SE = 0.534 μV). Repeated deviant tones significantly differed from standard tones: F1,14 = 21.579, P < 0.001, η2 = 0.607. The response to repeated deviant tones (mean = −0.098 μV, SE = 0.523 μV) was more negative than the standard tone response. Here too, tones delivered within isochronous sequences significantly differed from those delivered within anisochronous sequences: F1,14 = 13.216, P < 0.01, η2 = 0.486. The responses recorded to temporally regular tones (mean = 0.245 μV, SE = 0.491 μV) were less positive than those recorded to temporally irregular tones (mean = 0.669 μV, SE = 0.509 μV; see the control experiment section of Table 1 for the omnibus anova results). In slow stimulation sequences, temporal regularity appears to cause a shift of deviant and standard ERPs towards more negative values.
Higher-order predictions
Table 2 (control experiment section) shows the relevant omnibus anova results. Notably, the response to repeated deviant tones was not modulated by either temporal regularity or repetition probability. The comparison between first and repeated MMN yielded only a main effect of repetition: F1,14 = 14.541, P < 0.01, η2 = 0.509. The response to deviant repetitions (mean = −1.110, SE = 0.239) was always attenuated compared with first deviant tone response (mean = −2.270, SE = 0.261). We infer that slow sequences are indeed suboptimal for the preattentive computation of higher-order predictions (Fig. 6).
Discussion
We found that constancy in stimulus onset (i.e. temporal regularity) facilitates higher-order sensory predictions based on deviant repetition probability, in rapid tone sequences (Sussman & Winkler, 2001; Todd & Robinson, 2010). Neural response attenuation to highly probable and therefore predictable deviant repetitions thus reflects the contribution of both formal and temporal regularities in input. As the stimuli were presented outside the focus of attention, the build up of higher-order sensory predictions can be deemed automatic to a certain degree. Conversely, no significant MMN attenuation was found to less probable deviant repetitions in isochronous sequences, as well as no MMN attenuation regardless of deviant repetition probability in anisochronous sequences, suggesting similar surprise levels for both deviant events (Yaron et al., 2012). The absence of a main effect of temporal regularity in fast sequences excludes any artifactual low-pass filter effect that might derive from averaging jittered single-trial peak latencies (Spencer, 2005). Taken together, our findings corroborate and at the same time advance the sensory expectancy account of repetition suppression (Summerfield et al., 2008, 2011; Todorovic et al., 2011) by highlighting the relevance of temporal information for higher-order predictive processes.
We also found that temporal information is not required to elicit a prediction error response, i.e. the error response to a first-order prediction represented by standard repetition. We demonstrated this with both fast and slow stimulation sequences, confirming other studies using slow oddball sequences with a large onset time jitter (Schwartze et al., 2011). First-order prediction error appears to rely simply on stimulus feature mismatch. This makes sense from an ecological point of view, as conditioning the detection of feature changes upon the regularity of stimulus presentation would severely limit the adaptive efficiency of the deviance detection system in complex natural environments. In a recent work, Schwartze et al. (2013) reported on an impact of temporal regularity on the N1 deflection. In our control study, the N1 was not influenced by temporal regularity. This difference may stem from high-pass filter settings sensibly affecting the slow ERP components contributing to N1 deflection (for a discussion, see Widmann & Schröger, 2012). We opted for a conservative 0.5-Hz high-pass filter, as opposed to 5 Hz in Schwartze et al. (2013). Interestingly, in our control experiment temporal regularity appears to shift ERPs in the MMN/N2 latency range to more negative values, similarly to the effects of attention to sounds (negative difference, Näätänen, 1990; Alho et al., 1994). Speculatively, it could be argued that both temporal regularity and attention translate into sharpened neuronal responses (Neelon et al., 2011).
Our findings bear potential consequences for predictive neuronal accounts of MMN generation. Wacongne et al. (2012) feature the existence of an internal model of temporal dependencies linking the transition probabilities of successive stimuli within a short time window in sensory memory. According to this model, the amplitude of the peak of synaptic strength coincides with the (regular) temporal interval between successive sounds and is proportional to the conditional probability of observing a given stimulus at a given latency (higher for standard, lower for deviant). In this perspective, isochrony in stimulus presentation would favor sensory learning/storage of first-order regularities by facilitating synaptic plasticity (Masquelier et al., 2009). Our results suggest reformulating such stance, as first-order prediction error appears to predominantly depend on stimulus feature mismatch, with no significant contribution of temporal regularity. Instead, temporal information facilitates higher-order, contextual predictions. Thus, temporal regularity may help ‘memory neurons’ to evaluate the relevance of contextually valid sequential rules. One possible mechanism for this to happen is the unification of successive events. In their original work, Sussman & Winkler (2001) proposed that highly probable deviant tone pairs are unified into a single perceptual event (‘perceptual’ unification). In our experiment, highly probable deviant repetitions in isochronous sequences yielded a clear MMN, accounting for a perceptually distinct event. However, there is evidence that the brain did not process them as ‘separate’ events. Both the attenuation of current density sinks (Fig. 3) and the inverse solution results (Figs 4 and 5, left side panels) suggest that highly probable deviant repetitions activated a limited set of brain regions compared with less probable repetitions. More specifically, less probable repetitions included posterior STG structures, which are more likely to be devoted to low-level auditory processing (Brugge et al., 2003). For example, activity in the postcentral gyrus has been correlated with obligatory auditory N1 response peak amplitude (Mayhew et al., 2010), and the supramarginal gyrus is involved in auditory target detection tasks (Celsis et al., 1999), and short-term memory for pitch (change) information (Vines et al., 2006). If we assume that the successful extraction and application of temporal as well as formal regularities reduces the informativeness or surprise levels of predictable deviant repetitions, then it is reasonable to expect a concurrent diminution in the activity of brain structures deputy to low-level processing/short-term memory storage (Borst & Theunissen, 1999). This would favor the emergence of a more cognitive type of unification, linking individually perceived events into higher-order, two-tone units via predictive associations.
An important question pertains to how temporal jitter may affect predictive processing. If a fast tempo were necessary to extract contextual formal relationships, the auditory system would not be able to know ‘what next’ independently of ‘exactly when’. Alternatively, contextual formal relationships might be extracted regardless of a reference rhythm, but still require a regular onset to apply and influence neural responses. In this case, the brain would know ‘what next’ independently of ‘exactly when’. The experimental evidence we presented for fast sequences is compatible with both hypotheses, and thus further research is needed to disentangle them. One possible solution would be to jitter the onset of standard and first deviant while keeping a constant temporal distance between first and second deviant. If higher-order prediction effects were still obtained, they would be independent of rhythmic properties in the input sequence. Such a design could also help in clarifying how contextually relevant sensory predictions shape the perception of tone (and speech) sequences (Arnal & Giraud, 2012).
Overall, there were ambiguous lateralization effects with respect to the attenuation of the MMN to deviant repetitions. However, we obtained some hints from the voltage maps and the VARETA solutions towards a left-hemispheric preponderance of the attenuation effect. If this was a real effect, it could follow from the speeded presentation rates and/or brief stimulus duration, as both features tend to enhance left-hemispheric involvement in auditory processing (Tervaniemi & Hugdahl, 2003; Giraud et al., 2007). Notably, the stimulation rate (6.7 Hz) we used is proximal to average syllabic rate across languages (Pellegrino et al., 2011), and this very fact might indicate we tapped into a phenomenon relevant for language learning (Habermeyer et al., 2009). Also worth exploring in future research is the interesting possibility, suggested by the VARETA solutions (Figs 4 and 5), that searching for a pattern in anisochronous sequences might involve frontal structures (Huettel et al., 2002).
In conclusion, our study confirms and at the same time extends previous findings of a role for temporal information in creating predictive associations based on formal regularities (Friston, 2005). Temporal regularity does not modulate first-order prediction error at either fast or slow rates, but it facilitates the neural coding of higher-order predictions (knowing ‘what next’) driving the suppression of repeated deviant response in fast auditory sequences.
Acknowledgements
This work was supported by a DFG (German Research Foundation) Reinhart-Koselleck Project grant awarded to E. Schröger. Thanks to Nadin Greinert for help with data collection, to Dr Katja Saupe for discussion on inverse solution results, and to the anonymous reviewers for their helpful comments. Stimuli were presented using Cogent2000 v1.25 (University of London, UK), developed by the Cogent 2000 team at the FIL and ICN, University of London, UK. EEG/ERP data were analysed using routines from EEProbe, Release Version 3.3.148 (ANT Software BV, Enschede, the Netherlands, www.ant-neuro.com), Matlab 7 (The Mathworks, Natick, Massachusetts, USA) and the open source Matlab toolbox EEGLAB (Delorme & Makeig, 2004), Release Version 10.2.5.5a (www.sccn.ucsd.edu/eeglab). EEG filtering routines and SP/SCD map calculations were run with the aid of two EEGLab plugins written by Andreas Widmann, University of Leipzig, Germany.
Competing interests
The authors declare no competing financial interests.
Abbreviations
-
- EEG,
-
- electroencephalogram
-
- EOG,
-
- electrooculogram
-
- ERP,
-
- event-related potential
-
- MMN,
-
- Mismatch Negativity
-
- MNI,
-
- Montréal Neurological Institute
-
- MTG,
-
- middle temporal gyrus
-
- PCD,
-
- primary current density
-
- ROI,
-
- region of interest
-
- SCD,
-
- scalp current density
-
- SOA,
-
- stimulus-onset asynchrony
-
- SP,
-
- scalp potential
-
- SPM,
-
- statistical parametric map
-
- STG,
-
- superior temporal gyrus
-
- VARETA,
-
- Variable Resolution Electrical Tomography


