Predicting the potential establishment of two insect species using the simulation environment INSIM (INsect SIMulation)
Abstract
Degree-day models have long been used to predict events in the life cycle of insects and therewith the timing of outbreaks of insect pests and their natural enemies. This approach assumes, however, that the effect of temperature is linear, whereas developmental rates of insects are non-linearly related to temperature. Therefore, we have developed the simulation tool INSIM (INsect SIMulation) that can easily handle non-linear temperature relationships, because the program interpolates between measured growth, mortality, and reproduction parameter values given at two subsequent ambient temperatures. We use the tool for predicting the establishment of two insect species. For the application of the biological control agent Podisus maculiventris (Say) (Hemiptera: Pentatomidae) in The Netherlands, we compare a linear and a non-linear function for the development. The number of adult females increases six-fold in the course of a year for the non-linear case, suggesting that the Dutch climate might be warm enough for this beneficial insect to settle. The implementation of a linear development rate shows approximately the same increase. For the invasive pest Drosophila suzukii (Matsumura) (Diptera: Drosophilidae) in The Netherlands, we assessed that it is probably well-adapted to the current Dutch climate: it is predicted to establish easily in most of the simulated scenarios. However, if it were only to attack blueberries (and not cherries), its invasion success is predicted to be limited, because the reproduction in blueberries is low. The implementation of a linear development rate gives rise to 50% fewer adult females (on cherry) or even 95% fewer (on blueberry) after a year. More data are needed for both systems, specifically on overwintering survival for P. maculiventris and for D. suzukii on lifetime reproduction at various temperatures and in different fruit hosts. From the implementation of the linear rate model we can see that, depending on how well the linear approximation is, the results may differ considerably. We have demonstrated that the INSIM program is a useful tool that can easily be adapted to predict the success and individual variation for different insect species.
Introduction
Temperature of the environment has been reported as one of the most important factors for developmental rates in insects (e.g., Taylor, 1981; Beck, 1983). This has been known since de Réaumur (1735) reported the existence of ‘thermal’ time: each insect species has its own specific temperature range at which it performs best, and in that interval performance is best represented by an optimum curve. Entomologists have subsequently been using temperature calculations to describe at which particular value of the ‘temperature sum’ developmental events take place, namely hatching, moulting, pupation, and emergence. The temperature sum is defined as the accumulation of part of days (d) above a certain (species-specific) lower temperature threshold (Tcrit in °C) and below another upper temperature threshold (Tupp). Thus, the temperature sum is Σ (Tcurr − Tcrit)Δt, with summation over stage duration divided into time steps Δt times the current temperature Tcurr above the lower threshold temperature Tcrit (this only gives a contribution if Tcrit<Tcurr<Tupp). This temperature sum is given in degree days (°C d) [see review by Damos & Savopoulou-Soultani (2012) and an example of its use in Akers & Nielsen (1984)].
With degree-day models various goals can be achieved, among others the prediction of timing and intensity of pest species (Elliot et al., 2009), the suitability of areas for invasive species (Hemerik et al., 2004), the impact of biological control (Guttierez et al., 2011), and the effect of climate change on future appearances in the year of pests and natural enemies (Gebauer et al., 2015). Degree-day models assume a linear increase in developmental rate with temperature, starting with zero at the minimal temperature to a maximum at the highest temperature where development is possible (Moore & Remais, 2014). Moore & Remais (2014) stress that models with a non-linear response to temperature are better suited to representing the underlying development than are simple linear temperature responses. The beauty of degree-day models lies in their simplicity, and the basic linear temperature response can be adapted to approximate a non-linear temperature response. Although the individual variation in developmental rates within a population can be considerable and may be important for pest control (Howe, 1967), the degree-day method only gives average values. For this reason Mols & Diederik (1996) developed a general framework for a model of insect development of populations, called INSIM (INsect SIMulation, implemented in Quick Basic). This is done by directly using experimental results of the species’ developmental rates at various ambient temperatures. The effect of individual variation in developmental rates is evaluated as well. As INSIM is a dynamic simulation model, it has also much flexibility in incorporating additional processes in the model, such as the effect of pesticide application or predation.
In the high-level programming language and interactive, commercially available, environment, MATLAB, we have developed a new implementation of INSIM. This implementation allows straightforward temperature-dependent simulation of ecological or biological events. The tool INSIM aims to provide a modelling environment in which data generated by development time experiments at multiple temperatures is used to calculate the development of insects. The INSIM tool uses a ‘boxcar train’ approach (Goudriaan & van Roermund, 1989) to model the individual variation in individual development and survival rates to predict the variation in developmental rates in populations. Non-linearity in the temperature response is handled, because the program uses a piece-wise linearization (i.e., linear approximations between, for example, developmental data at two subsequent ambient temperatures). A first attempt of the new implementation of the INSIM model was published with the case study on the chrysomelid beetle Diabrotica virgifera virgifera LeConte (Hemerik & van Nes, 2008). More recently, the model was used by Gebauer et al. (2015) for a study on host and parasitoid development with respect to climate change.
One can argue that developmental models are already published as delay differential equations (Nisbet & Gurney, 1982). However, these models are age-dependent and do not model the development as a temperature-dependent process. Moreover, most experimentalists have problems to implement differential equations in a computer program. The tool INSIM is data-based, easy to use, the structure for temperature dependency is clearly and uniquely implemented, and the ambient temperature can be given as a mean value or as minimum and maximum temperatures on a specific day.
Here, we use this simulation tool to predict the establishment of a biological control agent and an invasive insect species. Moreover, we explain the use of the INSIM tool, because our Netherlands Entomological Society proceedings article (Hemerik & van Nes, 2008) appears not readily accessible via search engines. We could perform the simulation for various places around the world, but here we concentrate on The Netherlands to provide a proof of principle. For the biological control agent Podisus maculiventris (Say) (Hemiptera: Pentatomidae) we ask whether this polyphagous predator is likely to settle in The Netherlands to provide biological control on the various crops with pest insects that are part of its diet. An example of an invasive species is provided by the spotted fruit fly, Drosophila suzukii (Matsumura) (Diptera: Drosophilidae). Because this species is currently invading Europe we evaluate whether The Netherlands is likely to have a suitable climate for this nuisance species. We consider INSIM for MATLAB to be a useful tool for answering these questions about insect phenology.
Methods and materials
Input tables
For both examples below, we would have preferred to have developmental data for the various life stages in the insects’ life cycle. The level of detail of the life cycle we define depends on data availability. For both examples we assume an unbiased sex ratio and consider only female insects. In the electronic supplementary material (ESM1, a zipfile) we include the tables for the case studies (in tab-delimited text files, made with Excel with the option ‘save as’) that can be directly used by the software. We have downloaded the minimum and maximum daily temperatures in De Bilt, a town in the centre of The Netherlands, over the last 5 years (2010–2014) from the website of the Dutch meteorological institute (KNMI; http://www.knmi.nl/klimatologie/daggegevens/selectie.cgi). We use a sine function for temperatures over a 24-h time span, such that the minimum temperature occurs at midnight and the maximum temperature at noon [the details are to be found in Hemerik & van Nes, 2008, and electronic supplementary material file 2 (ESM2)]. An overview table with the connection between subsequent stages is necessary to define the life cycle. This means that the stage that reproduces is also denoted explicitly. For each of the stages defined in the overview table, one table with development times and standard deviations at different values of the ambient temperature should be defined (see the manual in ESM2). Ambient temperature is preferably given in °C, developmental time and standard deviation are both in days, and relative mortality rate should be on a per day scale (day−1).
The last table that has to be defined is the reproduction table for the reproductive state. First, the reproductive state is subdivided into certain classes (the number of classes is stated in the overview table). In each of these classes the number of eggs per day (when in this class) should be denoted on each row with the ambient temperature at which this occurs as the first element of this row. For details on the input for the tables and how to use INSIM, we refer to the web manual for INSIM (ESM2) and the text files for the case studies (in ESM1). In an appendix to the manual (ESM2, Appendix 2: Tests for temperature and development structure), we also provide an example showing the difference between the standard option (using the sine function between minimum and maximum temperatures and a non-linear temperature-dependent development) and the use of mean daily temperatures or the use of a linear temperature-dependent development. We have used two test examples.
The INSIM for MATLAB environment
The INSIM tool is programmed in MATLAB and is freely available as part of the package GRIND for MATLAB (http://www.sparcs-center.org/grind). It uses the temperature data to calculate the stage of development of populations of insects using the boxcar train approach (see below). At each time step, a fraction of the individuals moves to the next developmental stage depending on ambient temperature and there is temperature-dependent mortality. Reproduction takes place in some of the stages as defined in the overview table.
The distribution of individuals over various life stages is calculated in INSIM using a technique developed by Goudriaan & van Roermund (1989). Each life stage is divided into an optimal number of substages (in terms of the technique, all substages together is called the boxcar train) by the model in such a way that the variance in developmental stage is negligible within each substage. The individual variance in developmental rate is accounted for by the ‘fractional boxcar train’, which is a very efficient method for accounting individual variation (Goudriaan & van Roermund, 1989). The program needs tables with temperatures (either mean per day or minimum and maximum temperature per day) and data for reproduction, development, and mortality, which during the simulation are used to determine the current value by linear interpolation between the values given at temperatures just below and just above the current ambient temperature.
Case study 1: Podisus maculiventris
The spined soldier bug, P. maculiventris, is a polyphagous predatory stink bug that can occur in a large variety of crops including onion, tomato, sweet maize, bean, cucurbit, apple, and asparagus. This stink bug is deployed as a biological control agent against several insect pests, including diamondback moth, Plutella xylostella (L.), beet armyworm, Spodoptera exigua (Hübner), and European corn borer, Ostrinia nubilalis (Hübner) (De Clercq, 2008). This bug originates from North America. In Asia and Europe, the introduction of P. maculiventris has not yet led to settlement. In Florida and Maryland, USA [reported by Aldrich et al. (1984) and Herrick & Reitz (2004)], respectively) reproduction starts in March and April. The bug has normally two generations per year with adult activity from March to September. An important question is whether a biological control agent is able to develop in the field under local conditions. Therefore, we evaluate whether climatic conditions of The Netherlands are such that this biological control agent can successfully settle there.
Recently, Baek et al. (2014) reported temperature-dependent development and survival of P. maculiventris. These life-history characteristics were measured in the laboratory at eight constant temperatures. The egg, nymph, and adult stages were investigated and we named the stages in our program in the same way (note that we only used data from females). We used the threshold temperatures, the survival rates, and the rates of development as estimated by Baek et al. (2014) to determine the time of the year at which P. maculiventris will appear in the field. Because Baek et al. (2014) did not provide details on reproduction and the bug overwinters as an adult (De Clercq, 2008) we had to include temperature-dependent reproduction data to be able to begin a simulation with overwintering adults that directly reproduce. We used data provided by Legaspi & Legaspi (2005), who reported means and standard deviations for longevity of adult females at 18, 22, 26, and 30 °C as 90 ± 30, 50 ± 15, 40 ± 180, and 33 ± 9 days, respectively. The corresponding cumulative number of eggs that hatched [see figure 4 in Legaspi & Legaspi (2005)] was 50, 220, 280, and 130, respectively. It should be noted that at 30 °C females did not oviposit during the last quarter of their lifetime. At all other temperatures the egg-laying rate was approximately constant over the entire lifespan (‘Podisus_non-linear.txt’ in ESM1).
We also implemented a version where we assume a linear increase in development rate y of the three stages with temperature. The development times (1/rate) that we used were based on the following equations for the developmental rates: for the egg stage, y = 0.0102 × T − 0.0876 for T = 13.2–32.7 °C; for the nymph stage, y = 0.0026 × T − 0.0222 for T = 18.4–32.7 °C; and for the adult stage, y = 0.0016 × T − 0.0159 for T = 18–30 °C (‘Podisus_linear_rate.txt’ in ESM1).
Case study 2: Drosophila suzukii
The spotted fruit fly is an invasive pest that is present in most countries of mainland Asia [see Cini et al. (2012) for a more detailed description of its presumed origin]. This drosophilid is a polyphagous herbivore, attacking ripening small fruits by ovipositing in them (EPPO Fact Sheet, 2010). In 2012, this species had already invaded many Mediterranean countries and was spreading to the North and East of Europe (Cini et al., 2012). In October 2012 it was reported from The Netherlands (EPPO Reporting Service, 2012). However, no time series on the invasion is available. Here, we will investigate with data on temperature-dependent development, survival, and reproduction implemented in the INSIM for MATLAB program whether it can settle in The Netherlands. All life-history characteristics are taken from the recent study of Tochen et al. (2014).
Tochen et al. (2014) reported the development over two immature stages, namely eggs and larvae together (denoted in our program as ‘egglarv’) and pupa to adult emergence (denoted as ‘pupa’). We also included the adult stage (‘adultfem’) in the life-cycle table. In the range 10–28 °C, temperature had a significant impact on development reproduction and survival of D. suzukii on the important commercial hosts blueberry, Vaccinium corymbosum L. (Ericaceae) and cherry, Prunus avium (L.) L. (Rosaceae). For our example on D. suzukii, we used the development times of the developmental stages for females on blueberry and cherry separately. Because only the standard error of the mean and the number of sampled individuals (n) were given, we had to multiply these values with the square root of n to get the appropriate standard deviations. For these immature stages, mortality rates were not reported. Therefore, we set this to zero in our program. If the percentage of survival after each developmental stage had been given, the mortality could easily have been calculated (Hemerik & van Nes, 2008). For the adults, we can derive the median survival times at 14, 18, 22, 26, and 28 °C from their text as 34.3, 28.3, 13.8, 3.4, and 2.0 days on blueberry, and 40.7, 44.2, 14.9, 6.4, and 5.0 days on cherry, respectively. If we assume that these times stem from an exponential distribution which has median time to survival equal to ln(2) divided by the survival rate (that is easily shown by solving where the cumulative distribution function equals 0.5 – as a formula this gives 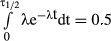 , thus
 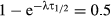 and
and  ), we can calculate the adult survival rate as ln(2) divided by the median time to survival. We also have used the median survival time and a standard deviation of 20% of the median in the table ‘adultfem’ for the adult (female). The threshold temperatures were 7.2 and 42.1 °C (Tochen et al., 2014). Drosophila suzukii females reared on blueberry had lower fecundity than when reared on cherry at all temperatures where reproduction occurred, namely at 14, 18, 22, 26, and 28 °C a total of 13, 16, 22, 28, and 40 eggs per female on blueberry, and 14, 15, 20, 44, and 56 eggs per female on cherry. The laying of these eggs occurred irregularly over time: most of the eggs are laid in the second part of their adult life. This information was transferred to the reproduction table(s) as daily rates in the last two of the four subsequent classes of the adult female's lifespan (‘Berries_Dsuzukii_2nd.txt’ and ‘Cherries_Dsuzukii_2nd.txt’ in ESM1). Moreover, we also provide a program in which lifetime fecundity is evenly spread over the adult female's lifespan (‘Berries_Dsuzukii_full.txt’ and ‘Cherries_Dsuzukii_full.txt’ in ESM1). As for the beetle P. maculiventris, we also implemented a version with a linearly increasing development rate with temperature (for the version with only reproduction in the second half of the adult life). For D. suzukii on berry, we used the following relationships for development rate y as function of temperature (T) for 10–28 °C: for the ‘egglarv’ stage, y = 0.0084 × T − 0.058; for the ‘pupa’ stage, y = 0.0135 × T − 0.1098; and for the ‘adultfem’ stage, y = 0.0318 × T − 0.501 (‘Berries_Dsuzukii_2nd_linrate.txt’ in ESM1). In the same way, we used for D. suzukii on cherry for 10–28 °C: for the ‘egglarv’ stage, y = 0.0079 × T − 0.0473; for the ‘pupa’ stage, y = 0.0156 × T − 0.1384; and for the ‘adultfem’ stage, y = 0.0132 × T − 0.1901 (‘Cherries_Dsuzukii_2nd_linrate.txt’ in ESM1).
Results
Podisus maculiventris
The cumulative degree days with base temperature 10 °C is always one of the output figures of INSIM (Figure ESM3.1). The combination of temperature-dependent survival and development (Baek et al., 2014) and reproduction (Legaspi & Legaspi, 2005) resulted in graphs of the time evolution of the considered stages for P. maculiventris (Figure 1A). Due to the assumed equal sex ratio, the program indicates that half of the eggs develop into female nymphs. In the current Dutch climate this beneficial insect can have three generations per year, as is reported for its place of origin (Florida and Massachusetts). From initially 10 adult females, ca. 50–70 adult females result at the end of the year in all five simulated years (Figure 1B) when the experimental results are directly implemented. Figures of all simulation results are given in ESM3.

In the linear rate case, 10 adult females result in ca. 40–60 adult females at the end of the year. This result illustrates that linear approximations can have a considerable effect on the simulation results. In this case ca. 15% fewer adult females are present in all simulated years (see ESM3).
Drosophila suzukii
Tochen et al. (2014) provided two data sets for D. suzukii. We implemented the data for the females on blueberry and cherry as two separate simulation models (figures of all simulation results are given in ESM3). Note that the equal sex ratio is implemented by letting half of the larvae develop into female pupae. The second half of a female's life contributed most to her lifetime reproduction. When we implemented this reproduction pattern, the resulting numbers of adult females were lower than when an even distribution of fecundity over the adult female's life was assumed (cf. Figure 2A with B on blueberry, and Figure 2C with D on cherry). These implementations led to a decrease and exponential increase, respectively, of the number of adult females during the year, suggesting that cherry provides a good habitat for the establishment of this invasive species. The linear rate model for D. suzukii on berry gives a decrease of ca. 95% compared to the non-linear model, whereas it results in a decrease of about 50% in the model on cherry.

Discussion
The tool INSIM provides an adaptable modelling environment in which degree-day accumulation is used for development over the various stages of an insect species. The form of the response to temperature is fully guided by the tables that are used for the input. As long as one makes sure that the lower and upper threshold (that may differ per stage) and the temperature at which development is fastest are included in the tables, the objections of Moore & Remais (2014) with respect to linear vs. non-linear relationships with temperature are circumvented. However, it should be noted that—depending on how well the linear rate model fits—the implementation of such models can have small to considerable effects, as illustrated in Appendix 2 of ESM2 and the linear rate simulations for P. maculiventris and D. suzukii on blueberry and cherry (Figures ESM3.3, ESM3.4, ESM3.9, ESM3.10, and ESM3.11).
Podisus maculiventris
For this beneficial insect the population of adult females at the start of the winter is ca. 6× larger than the initial 10 females that were assumed to have overwintered up to 1 January, that is, ca. 300 days previously. From the simulations we conclude that if this biological control agent has problems to overwinter in climates that are colder than the climate in its country of origin (Richman et al., 2010), then it might have problems to settle in The Netherlands. Winter survival in The Netherlands has not yet been quantified. Our results suggest that survival of adult females at low temperatures should be evaluated empirically.
Drosophila suzukii
Based on Tochen et al.'s (2014) results for specimens that used blueberry as the host, it is clear that the temperature profile of The Netherlands in 2010–2014 is disadvantageous: the spotted fruit fly will not be able to settle. However, if we look at the results for specimens that used cherry as a host, D. suzukii's invasion may be successful. Because we wanted to understand the extreme difference in behaviour in the two models, we did a modelling experiment in which reproduction only occurred in the second part of the adult female's life and another one where we interchanged the reproduction patterns on cherry and on blueberry, while survival values were from blueberry and cherry respectively. The simulation with reproduction of blueberry gave low numbers of adult females at the end of the year, whereas the population with reproduction of cherry grew exponentially—given the high reproduction value at low temperatures on cherry, this result is not surprising. Even reproduction that was set at the mean cumulative fitness for both cherry and blueberry—in this way the median fitness on different fruits was best approached—gave a growth in simulated number of adult females by the end of the year. We conclude that the spotted fruit fly can get established in the Dutch climate.
Conclusion
We demonstrated that our tool INSIM is data-based, easy to use, and that the structure for temperature dependency is implemented in a clear and unique manner. Moreover, it can be used for answering questions in the context of, for example, the establishment of biological control agents and invasive species. Although the simulation program needs much detailed temperature-dependent life-history characteristics, the straightforward way in which the program simulates the timing of developmental stages throughout one or more years makes it a valuable addition to freeware on the Internet. Of course, the commercially available programming environment MATLAB should be available to users of INSIM for MATLAB.
Acknowledgements
We dedicate this article to the memory of Mark Jervis who passed away unexpectedly in March 2014. LH really appreciated the discussions with, and contributions of, Mark in a joint grant application. Although Mark never explicitly considered temperature-dependent development, we are sure that he would have welcomed such an addition to models for the prediction of pest outbreaks and their biological control.
We thank the reviewers and editors for their valuable comments. We gratefully acknowledge all people that have tested earlier versions of INSIM: Elly Morriën, Koert van Geffen, Konnie Gebauer, and Maaike Wubs. They all contributed to make the current implementation better and more user-friendly. Dirk Diederik is thanked for explaining the main parts of the original Quick Basic program to us and for his enthusiasm in doing so. We also owe thanks to Joop van Lenteren from the Laboratory of Entomology at Wageningen University, who allowed us to develop a new version of the Quick Basic program in MATLAB.