Mitral Annular Plane Systolic Excursion–Derived Ejection Fraction: A Simple and Valid Tool in Adult Males With Left Ventricular Systolic Dysfunction
Abstract
Objectives
Validation of a mitral annular plane systolic excursion (MAPSE)–derived formula to calculate the ejection fraction where EF = 4.8 × MAPSE (mm) + 5.8 in adult males with left ventricular (LV) dysfunction.
Background
Echocardiographic assessment of LV function generally requires expert echocardiographer and is somewhat subjective and prone to reader discordance. MAPSE has been suggested as a surrogate measurement for LV function.
Methods
Prospective analysis of 170 male patients with systolic dysfunction by two-dimensional transthoracic echocardiography was carried out. MAPSE and ejection fraction measured by qualitative visual inspection, M-mode, and biplane modified Simpson's rule were measured. MAPSE-derived EF was compared against other conventional methods to measure EF using Bland–Altman analysis and independent t-test.
Results
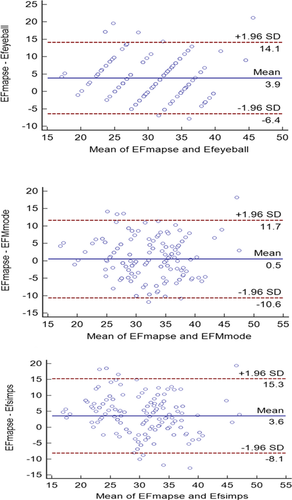
There was a significant positive correlation between average MAPSE and EF measured by M-mode (r = 0.554, P < 0.001), Simpson's rule (r = 0.585, P < 0.001), and visual inspection (r = 0.611, P < 0.001). An average MAPSE cutoff value <= 5 provided the best balanced sensitivity (67.1%) and specificity (76.5%) to predict EF < 30%. The mean difference between MAPSE-derived EF and EF measured by visual inspection and by Simpson's method was 3.86 ± 5.24% and 3.57 ± 5.97%, respectively. The least mean difference of 0.5 ± 5.69% was present between MAPSE-derived EF and M–mode-measured EF (P value 0.2).
Conclusion
MAPSE-derived EF using the equation EF = 4.8 × MAPSE (mm) + 5.8 is a valid technique in adult males with severely impaired LV EF.
Accurate quantification of left ventricular (LV) ejection fraction (EF) by echocardiography requires many factors, such as proper imaging plane position and appreciable endocardial definition. However, this is often difficult to achieve, as it has been reported that in about half of all patients with acute myocardial infarctions, LV EF by Simpson's rule cannot be precisely calculated, because of the inability to visualize the blood–tissue interface. Similarly, in elderly populations, almost one-third of the subjects have technically difficult images that preclude the accurate calculation of EF.1, 2
Over the years, different approaches have been tested using mitral annular displacement or systolic excursion as an estimate of LV function: from early studies using M-mode to the most recent studies using two-dimensional and even three-dimensional echocardiography.3, 4 Echo-derived mitral annular plane systolic excursion (MAPSE) offers an advantage as it can be performed in most patients because it does not rely on optimal endocardial definition or proper visualization of the LV apex and the mitral annulus can often be visualized and tracked even when there is poor LV image quality with inadequate endocardial visualization.5
Matos et al.6 in 2012 tried to use MAPSE as a surrogate of LV EF. They underwent retrospective analysis of 600 two-dimensional echocardiographic studies and used the first 300 studies to develop gender-specific MAPSE-derived EF and the second 300 studies as a verification cohort for this equation. They compared this MAPSE-derived EF with expert eyeballing EF, and most of their study group had normal EF. They also did not attempt to study the effect of specific disease entities on MAPSE measurements. This study tried to address most of these limitations to determine whether MAPSE-derived EF can be used as an alternative to the conventional echocardiographic measurements of EF in every day clinical practice.
Methods
The study was approved by our institutional review board, and informed consent was obtained from all patients enrolled in the study.
This was a prospective observational study which included all adult male patients who were referred to the echocardiography laboratory in Ain shams University Hospital within a 3-month period ending August 2014 and who had LV systolic dysfunction defined as EF < 50% by M-mode or modified Simpsons's rule for EF measurement. The technical quality of the study was graded into 4 grades: poor, fair, good, and excellent as determined by the expert echocardiographer supervising our echocardiography laboratory. The following patients were excluded from the study: (1) patients with mitral valve disease or prosthetic mitral valve, (2) patients with any form of arrhythmia, (3) patients with acute coronary syndrome, (4) patients with decompensated heart failure, and (5) patients with poor or fair technical quality of the study including but not limited to those with poorly defined endocardial border as identified by the expert echocardiographer opinion.
All patients enrolled in the study underwent full two-dimensional echocardiographic examination using GE vivid s5 machine, and measurements were obtained in accordance with the current American Society of Echocardiography guidelines.7
Two-dimensional imaging examination was performed in the standard fashion in parasternal long- and short-axis views and apical 4- and 2-chamber views. Pulsed Doppler spectral recordings were obtained in the apical 4-chamber view from a 4 mm sample volume placed at the tips of mitral valve. Echocardiograms were subjected to careful visual analysis to detect regional contractile abnormalities. LV systolic and diastolic volumes and ejection fraction were derived from biplane apical (2- and 4-chamber) views using the modified Simpson's rule algorithm and estimation of ejection fraction by M-mode in parasternal long and short axis.7
Displacement of the mitral annulus was measured in the apical four-chamber view; measurements were taken with M-mode beam positioned on the medial and lateral mitral annuli, in line with the left ventricular long axis. Maximum systolic plane excursion of the medial and lateral mitral annuli was measured in mm. The longitudinal motion of the mitral annulus is depicted over time as a sine wave. The nadir of the sine wave corresponds to the mitral annular position at end-diastole, and the peak occurs at end-systole. The height of the peak relative to the nadir is MAPSE (Fig. 1).6
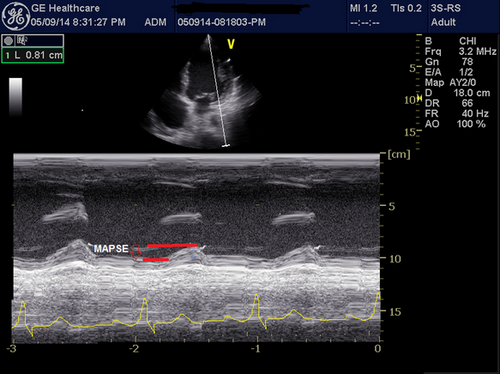
In the current study, medial and lateral MAPSE measurements were taken and averaged for each patient by 2 different operators blinded to the results of each other. The average MAPSE values were used in obtaining MAPSE-derived EF and in further analysis. Inter-observer and intra-observer variabilities in MAPSE measurements were then tested by comparing the results of the 2 operators, as well as remeasuring MAPSE by a single operator. Results obtained from MAPSE measurements were used to produce calculated ejection fraction on the basis of the formula previously generated by Matos et al. where EF equals for men = 4.8 × MAPSE (mm) + 5.8.6
Statistical Analysis
Data were coded and analyzed using the SPSS program (Statistical Package for Social Sciences, IBM, Armonk, NY, USA). Qualitative data were presented using the frequency and its related percentage, while quantitative data were presented using the mean and standard deviation.
Correlation between average MAPSE and LV EF measured by visual inspection, M–mode, and modified Simpson's rule was performed using the Pearson correlation coefficient. A receiver-operating characteristic (ROC) curve was used to identify the cutoff points, and the area under the curve was calculated. Average MAPSE cutoff points with the highest balanced sensitivity and specificity for the different EF measured by the modified Simpson's rule were obtained.
Inter- and intra-observer variabilities for MAPSE measurements were assessed using paired t-test and Bland–Altman analysis. A P-value of <0.05 was chosen as the level of significance.
To validate MAPSE-derived EF proposed by Matos et al.6 in our study group of adult males with LV systolic dysfunction, Bland–Altman graph (coefficient of repeatability)8 was used to evaluate the differences generated between the MAPSE-derived formula to measure the EF and conventional EF measurements. Unpaired sample t-test was used to confirm the data obtained by Bland–Altman graph by comparing the means of paired variables.
Results
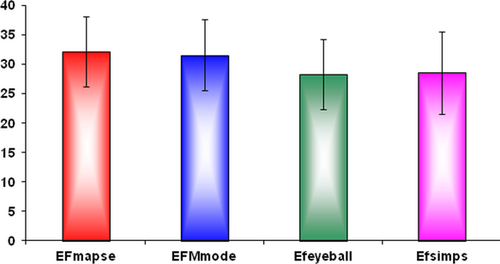
The study included 170 adult male patients with LV systolic dysfunction who were referred for elective echocardiographic study in the Cardiology Department in Ain Shams University Hospital. Of these patients, 104 (61.2%) had ischemic cardiomyopathy, while the remaining 66 (38.8%) had dilated cardiomyopathy. The mean age of the study group was 60.6 ± 9.8 years. The mean EF measured by M-mode was 31.6 ± 6.1% and that measured by modified Simpson's rule was 28.59 ± 7.01% and was nearly the same by visual inspection. Table 1 lists the demographic and echocardiographic variables of the study group.
| Variable | Study group | |
|---|---|---|
| Range | Mean ± SD | |
| Age | 37.0–87.0 | 60.6 ± 9.9 |
| Weight | 80.0–150.0 | 101.6 ± 14.4 |
| Height | 140.0–186.0 | 175.05 ± 5.9 |
| EDD | 41.0–97.0 | 64.4 ± 9.3 |
| EDV | 76.0–397.0 | 163.8 ± 63.65 |
| ESD | 36.0–81.0 | 54.4 ± 8.8 |
| ESV | 51.0–279.0 | 117.9 ± 50.0 |
| EF visual inspection | 15.0–40.0 | 28.3 ± 6.0 |
| EF M-mode | 15.0–46.0 | 31.6 ± 6.1 |
| EF Simpson's | 14.0–45.0 | 28.6 ± 7.0 |
The lateral and medial MAPSE as well as average MAPSE was measured for all patients (Table 2) by 2 different operators, and remeasuring MAPSE was made by the same operator twice to assess the inter- and intra-observer variability. There was strong positive correlation between average MAPSE measurements between the 2 different operators (r = 0.886, P value <0.0001) as well as between the 2 measurements measured by the same operator (r = 0.933, P value <0.0001). The inter- and intra-observer variabilities were also assessed by Bland–Altman analysis and paired t-test.
| Variable | Study Group | |
|---|---|---|
| Range | Mean ± SD | |
| Echocardiographer 1a | ||
| Lateral MAPSE | 3.5–11.0 | 7.2 ± 1.3 |
| Medial MAPSE | 1.0–10.0 | 3.8 ± 2.0 |
| Average MAPSE | 2.75–10.5 | 5.5 ± 1.2 |
| Echocardiographer 1b | ||
| Lateral MAPSE | 3.5–11.0 | 7.2 ± 1.3 |
| Medial MAPSE | 1.0–10.0 | 3.8 ± 1.9 |
| Average MAPSE | 2.75–10.0 | 5.5 ± 1.2 |
| Echocardiographer 2 | ||
| Lateral MAPSE | 4.0–11.0 | 7.3 ± 1.1 |
| Medial MAPSE | 1.0–9.0 | 3.7 ± 1.9 |
| Average MAPSE | 3.0–8.5 | 5.5 ± 1.1 |
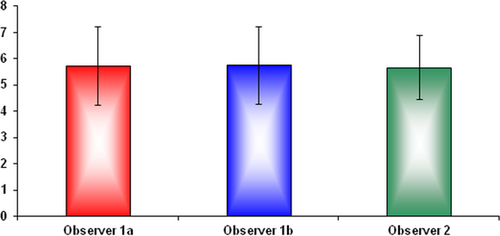
The mean difference between lateral MAPSE measured by observer 1 twice was 0.006, and the mean difference between observer 1 and observer 2 was 0.01. There was also no significant difference using paired t-test for both repeated measurements by the same observer and measurements between observer 1 and observer 2. Similar data were obtained when inter- and intra-observer variabilities were assessed for both the medial and average MAPSE (Table 3) (Fig. 2).
| Variable | MAPSE | |||
|---|---|---|---|---|
| Bland–Altman Analysis | Paired t-test | |||
| Mean Difference | Standard Deviation | t | P-Value | |
| Lateral MAPSE | ||||
| Intra-observer | 0.006 | 1.03 | 0.08 | 0.9 |
| Inter-observer | 0.010 | 1.06 | 0.13 | 0.9 |
| Medial MAPSE | ||||
| Intra-observer | −0.06 | 0.87 | −0.93 | 0.36 |
| Inter-observer | 0.09 | 0.82 | 1.56 | 0.12 |
| Average MAPSE | ||||
| Intra-observer | −0.03 | 0.47 | −0.86 | 0.39 |
| Inter-observer | 0.05 | 0.63 | 1.13 | 0.26 |
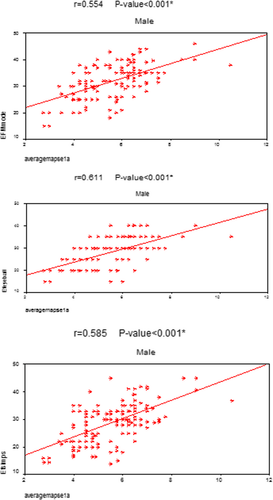
There was a significant positive correlation between average MAPSE and EF measured by M-mode (r = 0.554, P < 0.001), EF measured by Simpson's rule (r = 0.585, P < 0.001), and EF measured by visual inspection (r = 0.611, P < 0.001) (Fig. 3). The r value for the subgroup of patients with dilated cardiomyopathy was slightly higher than that of the whole study group and that of the ischemic subgroup, whereas r value between average MAPSE in this subgroup and EF measured by M-mode was 0.6, EF measured by Simpson's rule was 0.63, and EF measured by visual inspection was 0.66.
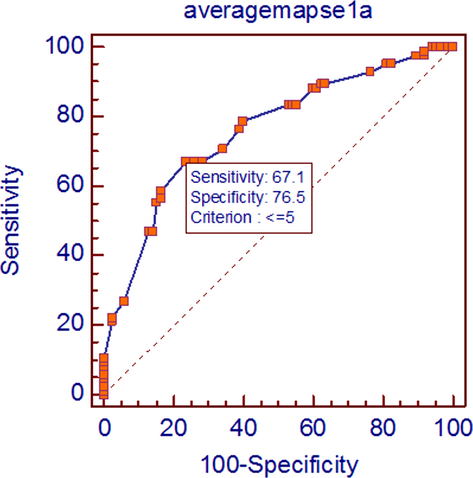
Receiver-operating characteristic curve analysis was used to generate MAPSE cutoff value with the highest balanced sensitivity and specificity to predict EF < 30% as assessed by the modified Simpson's rule. An average MAPSE cutoff value of less than or equal to 5 provided the best balanced sensitivity (67.1%) and specificity (76.5%) to predict EF < 30%. The area under the ROC curve for this cutoff point was 0.760. A cutoff value of less than or equal to 3.9 had 100% specificity to determine EF < 30%; that is, MAPSE less than or equal to 3.9 could determine EF < 30% in 100% of the patients (Fig. 4).
Mitral annular plane systolic excursion-derived EF using the equation postulated by Matos et al.6 compared favorably with other conventional methods to measure EF using Bland–Altman analysis (Fig. 5). The mean difference between MAPSE-derived EF and EF measured by visual inspection was 3.86 ± 5.24%. The mean difference between MAPSE-derived EF and EF measured by Simpson's method was 3.57 ± 5.97%. The least mean difference was present between MAPSE-derived EF and M-mode-measured EF; the mean difference was 0.5 ± 5.69% (P value 0.2) (Fig. 6).
Discussion
Although MAPSE and LV EF are related, they are not entirely interchangeable.9 MAPSE is suggested to be primarily representative of subendocardial, longitudinally oriented, myocardial fibers compared to the subepicardial, circumferential fibers measured by LV EF and is known to detect more subtle abnormalities of LV function.10 This is seen in patients with increasing age, myocardial hypertrophy, or diastolic dysfunction with preserved ejection fraction where long-axis function of the heart is already impaired, while the radial function can be preserved or even increased. Thus, using LV EF, the long-axis function of the heart is not necessarily considered.11
Nevertheless, the major advantage of MAPSE is the simplicity of its measurement. Being a simple one-dimensional measurement, it can be even performed by the novice practitioners, and as it is less dependent on endocardial border resolution, it can be reproducible with repeated measurements.6 This was demonstrated in the current study where MAPSE measurement showed no significant difference when the inter- and intra-observer variabilities were assessed.
The current study showed a significant positive correlation between average MAPSE and EF measured by M-mode (r = 0.554, P < 0.001), EF measured by Simpson's rule (r = 0.585, P < 0.001), and EF measured by visual inspection (r = 0.611, P < 0.001). Qin et al.12 demonstrated a significant correlation between MAPSE measurements and LV functions assessed by three-dimensional echocardiography and cardiac magnetic resonance imaging (MRI). Tsang et al.13 demonstrated the same correlation with MRI-derived EF.
The current study showed that an average MAPSE cutoff value of less than or equal to 5 provided the best balanced sensitivity (67.1%) and specificity (76.5%) to predict EF < 30%. A cutoff value of less than or equal to 3.9 could determine EF < 30% in 100% of the patients. Our results were consistent with those of Matos et al.6 who stated that a MAPSE cutoff point of <6 served as an appropriate cutoff point to predict severely depressed EF less than or equal to 30%. Elnoamany et al.14 demonstrated that a MAPSE value of <12 mm had 90% sensitivity and 88% specificity for the detection of EF <50%. Alam et al.15 demonstrated that a mean MAPSE < 7 mm could detect an EF < 30% with sensitivity of 92% and specificity of 67% in patients with dilated cardiomyopathy with severe congestive heart failure.
Matos et al.6 used regression analysis to produce an equation to determine MAPSE-derived EF. Two major limitations of this study were stated by the authors themselves who stated that they relied on comparison of MAPSE-derived values against the visually estimated EF and that they did not study patients with specific disease entities as ischemic heart disease.
In the current study, we tried to overcome these limitations and at the same time validated the equation derived by Matos et al. in another cohort of patients namely adult males with impaired LV functions secondary to ischemic heart disease or dilated myopathy. We studied 170 males with LV systolic dysfunction with a mean age of 60 years. LV function was measured by M-mode, Simpson's method as well as visual estimation using expert visual inspection. The mean EF of our study group was 31.6 ± 6.1%, 28.6 ± 7%, and 28.3 ± 6% for the three methods of measurements, respectively, compared to the visually estimated EF of 53 ± 15% and 54 ± 14% in the calibration and verification cohort of Matos et al.
We could demonstrate that MAPSE-derived EF using the equation EF = 4.8 × MAPSE (mm) + 5.8 compared favorably with other conventional methods to measure EF. The mean difference between the MAPSE-derived EF and EF measured by visual inspection was 3.86 ± 5.24%. The mean difference between MAPSE-derived EF and EF measured by Simpson's method was 3.57 ± 5.97%. The least mean difference was present between MAPSE-derived EF and M-mode-measured EF; the mean difference was 0.5 ± 5.69% (P value 0.2)
Study Limitations and Recommendations
This was a prospective observational study over a limited period of time, and the number of female patients with depressed LV function and normal mitral valve during the period of the study was not sufficient to confirm the gender-specific differences in MAPSE measurements postulated by Matos et al. or to validate the equation postulated by the authors to predict EF in females using MAPSE-derived measurements.
Whether or not diastolic dysfunction could affect MAPSE-derived measurements remains another area of future research.
Comparing MAPSE-derived EF with CMR or 3DTTE-derived LVEF by volumes should be considered in future studies as these modalities represent the gold standard for quantification of LV function and are sought to be much more accurate than the current 2D quantification methods.
Conclusions
Despite routine use of newer and more refined echocardiographic technologies nowadays, such as strain-rate imaging, speckle-tracking imaging, and 3D echocardiography, the use of MAPSE measurement is still especially helpful to evaluate LV systolic function in case of poor sonographic windows with minimal inter- and intra-observer variability. An average MAPSE cutoff value of less than or equal to 5 provided the best balanced sensitivity (67.1%) and specificity (76.5%) to predict EF < 30%. MAPSE-derived EF using the equation EF = 4.8 × MAPSE (mm) + 5.8 is a valid technique in adult males with severely impaired LV systolic function.


