Using Theory of Change to Support Participatory Visual Mapping in Urban Transformation Projects
Abstract
Theory of Change was created as a logic planning model to explore and represent a potential change in a way that reflects a complex and systemic understanding of development. Even though it is a familiar tool in the context of community initiatives and philanthropic projects, Theory of Change is under-applied in design as a problem-solving practice and underexplored within design research. Design projects that are looking for more comprehensive ways of negotiating change can greatly benefit from it to inform a deep understanding of the dynamics of change. This paper focuses on how a designerly approach to Theory of Change can support participatory visual mapping, thus creating some enabling conditions towards transformation in cities, namely: facilitating more granular communication, suggesting a multifaceted and systemic perspective, helping to navigate complexity by creating shared mental models among stakeholders, fostering thinking through different temporalities, and boosting creativity. The paper will examine a case of an urban transformation project that involves six European cities under regeneration.
Aims of the paper
Theory of Change was created as a logic planning model to explore and represent a potential change in a way that reflects a complex and systemic understanding of development. It emerged in the United States in the 1990s in the field of community initiatives, based on two streams of work: evaluation and informed social practice (Stein & Valters, 2012). A Theory of Change often identifies the current situation (in terms of needs and opportunities), the intended outcome and what needs to be done to move from one to the other (Rogers, 2014). Today, it is mostly used to define the connection between activities, outputs and outcomes of projects and programmes (Stein & Valters, 2012) and more specifically, to identify and address the critical factors that can lead to ‘an interpretation of how change comes about’ (Simeone et al., 2022).
Even though Theory of Change is a familiar tool in the context of community initiatives and philanthropic projects, it is under-applied in design as a problem-solving or rather problem-reframing practice, and underexplored within design research (Norman & Stappers, 2015; Simeone et al., 2021; Tonkinwise, 2015). More particularly, little has been written on the design features of Theory of Change maps and their lexicon is largely underdeveloped (Simeone et al., 2021). The non-designerly approach of many of the Theory of Change existing models is characterized by a linear sequence of boxes (e.g., actions, outputs, outcomes) and arrows connecting them, representing the expected causal connections between these events (Davies, 2018). Similarly to some data visualization techniques, such sequential representations suggest narratives of optimization, balance, and control (Gray et al., 2016). This spirit does not necessarily match neither the experimental, flexible, and open nature of design nor its participatory attributes. Yet, design projects that deal with contexts of interventions that are more and more uncertain, complex and ambiguous (Bennet & Lemoine, 2014; Norman & Stappers, 2015), and that try to ‘cope with complexity’ by finding more participatory and comprehensive ways of negotiating change (Flach, 2012; Tonkinwise, 2015) can greatly benefit from a Theory of Change framework to inform a deep understanding of the dynamics of change within the natural and social world (Irwin, 2018). Such projects will also profit from developing more tools for collaborative problem mapping in a workshop setting (ibid).
Based on the understanding that a) Theory of Change can strongly support participatory visual mapping in urban transformation projects and b) existing models of Theory of Change do not necessarily act as visual mapping that reflects a designerly approach, we are interested in exploring how Theory of Change can support the needs of urban transformation projects in the context of participatory visual mapping. To explore this, we are going to study the case of T-Factor, an urban transformation project that involved six European cities under regeneration. The project allowed us to bring together key city stakeholders and let them collaborate through continuous conversations - partly facilitated by design workshops (Alter et al., 2019). Our point of observation is the one of design, i.e. those practices undertaken to identify, frame and address problems by significantly relying on modelling and other visual and aesthetic representations (Conley, 2004; Morelli et al., 2021; Vink et al., 2021), on iterative and participatory processes (Morelli et al., 2021), and on user-, human- and life-centered perspectives.
This article is structured as follows: section two reviews the literature and particularly the context of participatory visual mapping. Section three presents the research approach based on a case study relying on participant observation, semi-structured interviews and a focus group. Section four provides an analytical description of the design intervention in T-Factor also in relation to the engagement of various city stakeholders. In section five, we reflect on the case and distill insights on participatory visual mapping.
Literature review
Participatory visual mapping
The idea that some problems can be more clearly addressed and communicated when displayed visually is not new, and was already formulated by many - including Albert Einstein, who once said: “If I can't picture it, I can't understand it” (Friendly & Wainer, 2021, p. 5). Indeed, the disciplines of design have historically developed visual representations and associated visual languages to frame and illustrate complex systemic problems (Jones & Bowes, 2017). A particular case is that of visual mapping, a tool to align stakeholders by providing them with an overview of complex processes, by creating shared mental models for analyses (Sevaldson, 2011), and by making abstract ideas tangible, thus supporting communication (Morelli et al., 2021). These qualities make visual mapping of high importance in the context of urban transformation in cities, where “complex situations that cannot be reduced and analyzed with the techniques of classical problem solving and decision making” (Jones, 2014, p. 95) are being tackled.
Various forms of visual mapping have been developed and deployed in design projects, including the following: (1) actor-network mapping, which gives an overall picture of the network of actors and components in the system, (2) use case diagrams, which visualise sequences of actions in a service, and (3) motivation matrices, which display the functional relation between all the actors participating in a production system (Morelli & Tollestrup, 2006). Other visual mapping methods aim at capturing a higher level of complexity, like in the case of giga maps, which often function as an 'information cloud' providing stakeholders with existing knowledge across multiple layers and scales, investigating relationships between categories and critically framing the system (Jones, 2014; Sevaldson, 2011), or in the case of synthesis maps, which integrate and render knowledge and present it using a narrative approach (Jones & Bowes, 2017). Such visual mapping also functions as 'problem mapping' (Irwin, 2018) and can be used, for example, in participatory workshops, by describing an existing situation in a synchronic fashion from a multistakeholder perspective, by articulating configurations of relationships and by amplifying plurality and elaborating complexity.
The specific visual mapping supported by Theory of Change
Theory of Change is generally used to envision some interventions aimed at changing the existing situation towards a desirable future. It identifies the current position in terms of needs and opportunities (What is the problem that you want to solve?), the intended situation (What is the change you expect?) and what needs to be done to move from one to the other (What steps are needed to bring change?) (Rogers, 2014; Simeone et al., 2022). As such, it mostly presents a logical linear narrative that combines answers to these questions. Even though Theory of Change does not follow a predefined and univocal format, it is often represented visually using charts and diagrams (Stein & Valters, 2012). However, these visual elements do not necessarily reflect a designerly approach as a participatory and user-centered process.
The first Theory of Change maps appeared similarly to logic models, with a left to right orientation and a linear tabular structure leaning on the aesthetics of natural science (Davies, 2018; Simeone et al., 2021). These maps followed the logic of engineering diagrams: a process starting with ‘inputs’ and continuing with ‘outputs’, described as a set of sequential instructions to be followed in order to accomplish a task. This structure implies a clear and well-defined problem, a desirable situation and a clear view of all the available resources. However, this is not always the case: stakeholders who are collectively using a Theory of Change framework to articulate a programme or identify and build agreement do not always hold a mutual view of the key components to be mobilized and, therefore, need to discuss and negotiate as a starting point (Davies, 2018; Stein & Valters, 2012). As argued by Irwin (2018, p. 157), “the importance of achieving a shared understanding of the problem among stakeholders cannot be stressed enough”. Even in cases where the problem area is mapped in advance, there is still a need to reframe it by prioritizing what to address. The stakeholders then need to choose the thematic focus that has a direct impact on the project's narrative (Jones & Bowes, 2017). It is only then that a plan of how to generate a change can be made.
It is our take that to fulfil these conditions, there is a need to shift from a process-centered ‘engineering’ Theory of Change to a user-centered ‘designerly’ Theory of Change that will match the context of participatory visual mapping and meet stakeholders where they are in terms of needs and perspectives. As such, our study intends to address this research question: How can Theory of Change support participatory visual mapping in urban transformation projects?
Research methods
This paper investigates the particular case of T-Factor, an urban transformation project funded by the European Commission and particularly geared towards the design of ‘meanwhile activities’. By ‘meanwhile activities’, we mean activities that are taking place in vacant buildings, plots and unused spaces in order to build shared public value and rewire the social, cultural and economic fabrics of the areas under regeneration (definition taken from www.t-factor.eu). As a case study, this project allowed the identification of key insights through the investigation of a number of examples and the elaboration of theory building processes (Eisenhardt & Graebner, 2007), in situations where ‘how’ or ‘why’ questions are being posed within a real-life context (Glaser & Strauss, 2010; Pettigrew, 1990; Yin, 2009). Consistently with what suggested by Yin (2009), a case study approach allows to gather useful and intermittent feedback, to adapt to the availability of different types of evidence and data, to assess outcomes and test theories, and to develop key learning points with the major themes within a field.
T-Factor is a four-year Horizon 2020 project that involves six pilots, i.e. specific districts or areas in Amsterdam, Bilbao, Kaunas, London, Lisbon and Milan. T-Factor intends to leverage the transformative potential of urban areas under regeneration. More specifically, T-Factor wants to foster mission-oriented initiatives aiming at tackling matters of social concerns and characterized by a high level of complexity.
Throughout the project, we conducted participant observation (Czarniawska, 2012) by developing the Theory of Change visual framework and observing through a period of ten months how the six pilots deployed it in relation to their own urban regeneration projects, culture and goals. We gained further insights by conducting six semi-structured interviews (Kumar et al., 1993) with both facilitators and stakeholders who actively used the framework. All interviewees were involved in the project to a high degree and held ‘expert knowledge’ in the areas of project management, urban regeneration or design, which implied a certain level of reflexivity about the process. The conversations were based on semi-structured schemas using a flexible approach that allowed gathering the informants' perspectives on specific issues and checking whether informants could confirm insights and information the researchers already held (Myers, 2019). Most of the interviews were done in two steps: first in a format of online conversations that lasted about half an hour. In one case the interviewee received written questions and replied by email. As a second step, some follow-up questions were sent and responded to by email. The first interviews took place a few days after using the framework. Later on, we conducted an online focus group with 22 participants from the project's consortium who actively interacted with the framework, to gather more data and validate some of the insights that came up from the participatory observation. During the session, the participants were guided through an online Miro board that included several questions, which they answered individually. The findings from both activities were clustered in topics. The insights that we extracted are presented in the next section.
Analytical description of the design intervention
Creation of the Theory of Change-based mapping framework
In T-Factor, each pilot had to develop a plan of activities to support urban transformation in their districts under regeneration. For example, the development of Amsterdam Science Park in its current science-oriented function initiated in 1946 and is now undergoing a ‘Development Vision’ phase that is supposed to run until 2028. The park holds the highest concentration of university science education and research organizations in the Netherlands. While the area now consists predominantly of ‘built’ infrastructures, with clear and easily recognisable public spaces, the site is of ecological relevance to the rest of Amsterdam and the province of North Holland. To support these ecological aspects, the stakeholders in the park (local citizens, representatives of the parks' administration, employees in the park, artists, activists and NGO representatives) created an activity plan to address the overall challenge of renewing the relationship with nature in the urban environment at the Science Park and its direct surroundings.
The creation of the activity plans was a collaborative process in which various city stakeholders were involved. The authors of this paper were part of a T-Factor team that co-created some design tools to be used in the context of participatory visual mapping across the six pilots, to interact, think visually and plan potential solutions resulting in a portfolio of activities. These design tools will be presented and discussed here under the title of ‘Visual Theory of Change framework’.
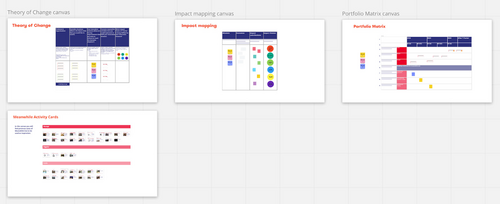
The framework (Figure 1) was designed and provided in a Miro digital platform, which enabled simultaneous work on visual boards in online workshop setup. It was centered around a Theory of Change model and included three other canvases that expand on some aspects presented in the Theory of Change model, namely the activities and their impact. By providing four separated canvases we intended to break down the complexity and support the users in looking at things from various perspectives and different levels of zoom. The different canvases were laid out side by side rather than in a chronological order to allow a flexible process. Given that most users had no previous experience using the provided canvases, special attention was brought to creating clear instructions, definitions and a training module of how to use the visual framework for the benefit of the facilitator and the city stakeholders involved in the workshops.
The Theory of Change model (Figure 2) provided stakeholders with a visual scheme in order for them to co-define the projects' scope: the point of departure (represented as challenges and opportunities summarised by an ‘overarching challenge’), the destination (desirable situations), the thematic focus (innovation missions), the concrete actions to be taken in order to reach the desired situation and the connection to the overall missions of the T-Factor project. The model was designed in the shape of a left-to-right table to demonstrate process logic. Each column included a headline and a definition of it, an example, and an empty field to accommodate multiple answers. Thus, stakeholders were not forced to converge into a single statement but could rather juggle multiple viewpoints throughout the process. To facilitate easy navigation in the various types of information, each category of answers was represented differently: problems and opportunities to be written on red and green cards, desirable situations on yellow cards, the concrete actions to be taken to reach the desirable situation on ‘activity cards’; each mission received a different post-it note color and the overall T-Factor missions were represented by colored circles. The visual coding was consistently kept throughout the entire framework.

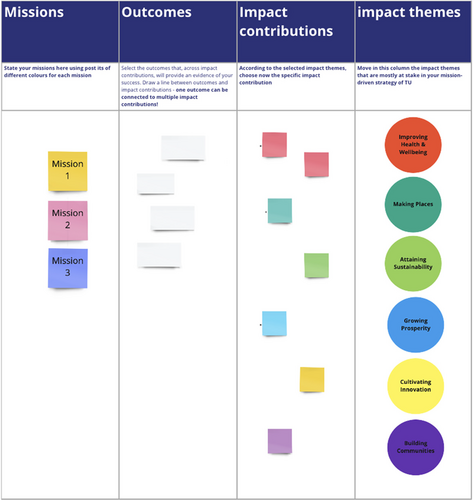
Once the stakeholders completed the Theory of Change table by agreeing on their city regeneration projects' scope, they moved towards the ‘impact framework’ canvas (Figure 3). Here, they took an extra step by envisioning what would be the evidence of the success of their actions (‘outcomes’) and by co-defining the expected impact contributions of their local activities. These exercises show how stakeholders had to think through different temporalities (present and future) and expand the local context by connecting the local missions to the general impact themes of T-Factor.
As a next step, the stakeholders were invited to co-design a set of interventions in order to transform the current situation into the desirable one, functioning as an interpretation of how change comes about (Simeone et al., 2022). In the case of the T-Factor project, these interventions are known as ‘meanwhile activities’. To provide some inspiration of what such activities may be, a set of ‘meanwhile activity cards’ (Figure 4, Figure 5) was created, showing examples of meanwhile activities already carried out by other cities in other contexts (some examples of meanwhile activities are a pop-up exhibition of local artists, a food festival, a guerrilla gardening initiative, etc.). These examples were presented on cards and included a headline, a short description, an image and a reference. This visual approach provided easy access to information, and enabled a modular, collaborative, and playful way of working (Figure 6). The cards provided a tangible representation of how a possible future would look and thus made it easier to envision (Henning Buehring & Liedtka, 2018).
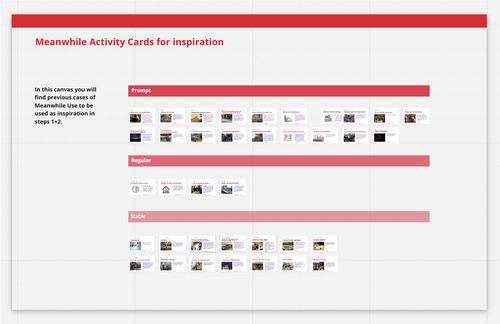
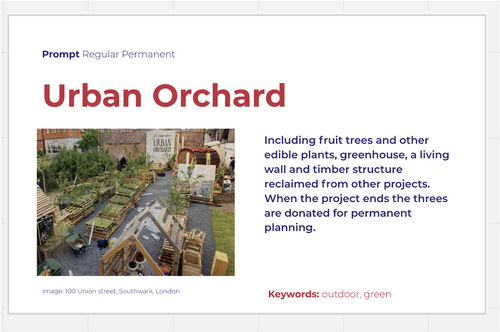
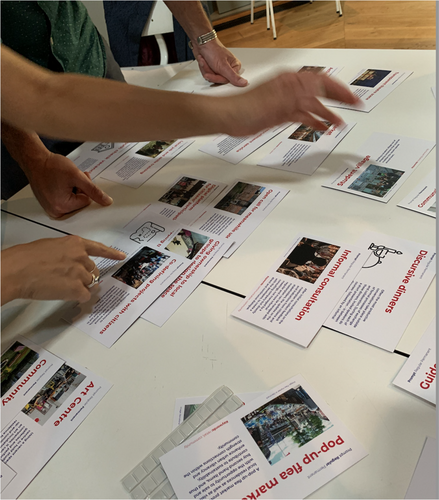
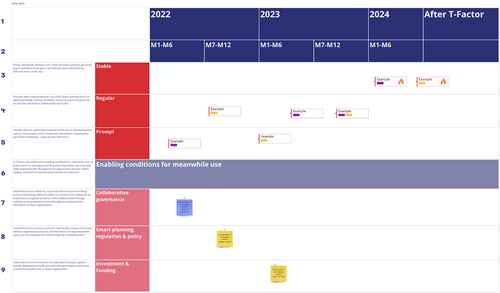
At this point, the stakeholders could populate the fourth column in the Theory of Change table: ‘Concrete meanwhile activities that you can implement to fulfil your innovation missions’ both by simply placing the ready-made cards in the canvas shown in Figure 4 or by developing new ideas, as to “progress by forming an idea of the ‘what’ (the value that could be produced) at the same time as the ‘how’ (the means of producing it)” (Drew et al., 2021, p. 26). Thus, the Theory of Change framework directed stakeholders towards a ‘portfolio approach’ where multiple ideas created an overall choreography, or rather a composition or an orchestration of actions (Sevaldson, 2017). These ideas were then plotted in the Portfolio Matrix (Figure 7), which was a way of presenting a specifying a range of different future options (Bühring & Liedtka, 2018). This allowed stakeholders to construct a portfolio of alternatives with an eye towards timing and different time horizons (ibid), working according to the projects' methodology, namely moving from activities that entail a prompt use of the space (e.g., a temporary fair or event) towards a future where activities are settled ‘permanently’ in the area (e.g., a garden, a community house or a Fablab). The upper horizontal column of the matrix presents the project's timeframe. The vertical column on the left contains two main sections. The upper part presents the three temporal categories: prompt, regular and stable. The stakeholders were asked to place their activities in regard to these three categories throughout the project's time span. Thus, they could explore how different interventions were connected to each other and led to a desirable impact. As we will show in the next section, this visual overview supported the internal alignment among stakeholders and helped them to reveal gaps in the plan (e.g., identifying a lack of interventions of a specific kind or a planned activity that made no sense when looked at from a broader, systemic perspective). The lower section of the left column contains essential areas that need to be considered to create a long-lasting impact (e.g., regulation, funding and policy support). Stakeholders were asked to think about them as enabling conditions behind their planned activities and mention in the table what needs to be done to address these aspects in regard to each activity.
The viewpoint of the people who used this framework in T-Factor
Findings from the participatory observation, interviews and focus group show that stakeholders found the Theory of Change framework valuable with regard to the aspects listed below.
Adopting a systemic perspective
Combining various elements under an overall structure that fostered different levels of zoom (e.g., zooming in by considering each specific activity and zooming out to see how each activity would interact with the others) supported the stakeholders in adopting a systemic view, as mentioned by a stakeholder from Milan: “the framework helped in organizing the different issues and bringing clarity around their scale (and possible impact if addressed), how they are related to each other and their priority in the project… it also helped us to bring different perspectives to the table”. A facilitator from Lisbon said that “using a visual framework was useful in order to easily navigate between complex dimensions and levels and see the links between them”; similarly, a stakeholder from Amsterdam mentioned that: “The visual framework helped us to break out, recompose and reframe things”. Stakeholders also noted that “The framework gives a useful series of lenses to reflect upon the aspects of the process”, that it provides “a good way to have a systematic view over all activities and question their relevance”, “It connects the what (strategy) with the why (impact)” and “having all activities in one place as activity cards, organized by time-frames, helped making further connections between them and visualize the scope of the work to date”. All in all, the Theory of Change framework was clearly used as a mapping tool to get an overview and process existing information.
Centring the conversation around critical and strategic aspects
The framework provided critical anchors to the discussion by presenting strategic aspects that needed to be addressed by the stakeholders. For example, a stakeholder from Milan mentioned that the framework helped them “to systematize the information and to define three main missions and desirable outcome”, while a stakeholder from Kaunas said they used it “mostly for specifying the main missions, which made us think through and define the main directions and goals Kaunas pilot wants to achieve during the project”. A stakeholder from Amsterdam stressed the importance of defining innovation missions anchored to the process. Thus, the Theory of Change visual framework did not only provide easier access to information but also helped stakeholders to look at their interventions through a strategic vocabulary (e.g., “inputs”, “outputs”, “outcomes”, “missions”, “impact themes”).
Supporting decision-making through divergent and convergent thinking
In order to move forward through the framework, stakeholders need not only to diverge by gathering and reviewing information and producing new ideas, but also to take decisions by converging the findings and prioritizing their focus area to match future trajectories. A stakeholder from Amsterdam mentioned: “We already had a lot of ideas so we were more in need of convergence”, while a stakeholder from Milan reported that the framework “helped us to filter ideas, ideate and choose activities that have impacts”. The framework helped stakeholders to use their creative capabilities to produce and consider multiple, divergent ideas (thus, giving the possibility for multiple voices to be heard) and then to converge towards a shared direction, which, rather than being univocal, was presenting multiple options that could be secured for the future. Thus, it brought together creativity and strategic decision making.
Creating clarity about the process
Navigating within a complex process such as the one described in this paper is easier when various elements are being structured visually to create an overview from a user's perspective. In this regard, the projects' coordinator reflected that “the framework helped [city] stakeholders to see a path that emerges…its biggest value was to help people to think through complexity and move from A to B", while a stakeholder from Milan noted that “working with a visual structure helped us to easily follow the steps and figure out what it is that we need to do… It helped us to remember what is needed.” The facilitators indicated that the framework helped stakeholders to grasp and navigate complexity while moving between the details of the specific task at hand and the broader structure of the T-Factor project. Due to this ‘memorable understanding’ (Friendly & Wainer, 2021), they managed to maintain a focus on what can potentially become a complicated and messy process.
Supporting communication
T-Factor holds a participatory and inclusive approach. Decisions in each pilot are taken by multiple stakeholders characterized by various expertise, backgrounds, experience and levels of involvement, as well as different perspectives in regard to the project and its desired outcomes. Therefore, one of the main roles of the framework was to align stakeholders and facilitate the internal discussions among pilot members. The mutual understanding of the problem, the agreement on a focus area and an overall shared vision were necessary in order to set measurements and enable the co-design of the activity plan. Moreover, as mentioned by a stakeholder from Milan, the framework helped introduce the overall logic also to stakeholders who were not fully engaged with the process: “It enabled us to communicate easily with people who are not part of the project [i.e. outside the T-Factor's consortium] and are not familiar with the details. It helped everyone to get on the same page”.
Discussion
Urban transformation projects often address complex domains such as climate adaptation, regeneration of entire districts, city unemployment, citizens' well-being and more. Designers who are involved in such projects can almost never design the intended change directly, rather, there is a need to involve local users and stakeholders, who hold relevant knowledge (Jones, 2014) and control, broker and can develop resources and capabilities (Abbasi et al., 2018) to drive change. Designers can support these city stakeholders by providing them with visual mapping tools to create enabling conditions for change to happen.
In this paper, we showed how the use of Theory of Change within a designerly approach can contribute to participatory visual mapping in urban transformation projects. Particularly, as a visual mapping tool, Theory of Change can help to build the enabling conditions for city transformation listed below.
More granular communication
In general, participatory visual mapping tools are used to support communication among stakeholders by getting a shared understanding of the problem (Irwin, 2018; Jones & Bowes, 2017) without necessarily simplifying and reducing complexity. When it comes to Theory of Change, many of the existing models represent expected causal connections between events (Davies, 2018) and the overall impression is that of an objective and controlled process, an approach that does not encourage a discussion. The Theory of Change framework presented in this paper takes a designerly approach by suggesting a visual layout that decapsulates and unfolds the city planning and decision-making processes by making them tangible and transparent, and therefore more open to being understood and discussed by city stakeholders.
Multifaceted and systemic perspective
The systemic perspective supported by participatory visual mapping (Sevaldson, 2011) allows stakeholders to address many aspects simultaneously and avoid ‘blind spots’ (Ramos et al., 2019) and leads them towards generating an integrated response. Our research shows that the Theory of Change framework provides a multifaceted overview of information and insights, which is a necessary step toward change since “change comes first from stepping outside the limited information that can be seen from any single place in the system and getting an overview” (Meadows & Wright, 2009, p. 108). Acknowledging the importance of this matter in the context of participatory visual mapping, the Theory of Change framework presented in this paper displays as broad information as possible, also integrating an array of visual models that invite the stakeholders to reason across multiple levels, scales and temporalities, by seeing linkages within the system from various perspectives.
Navigating complexity by creating shared mental models among stakeholders
Mental models have the power to improve our internal pictures of how the world works thus helping us to put new insights into practice (Senge, 1992). By providing stakeholders with a structured visual representation, the Theory of Change framework functions as a mental model not only as a basis for shared analysis (Sevaldson, 2011) but also for “guiding stakeholders on how to navigate complexity from A to B" (as mentioned in the interviews). As such, more than functioning as a map to represent an existing landscape, or ‘information cloud’ (ibid) to aggregate knowledge, the Theory of Change framework functions as a navigation tool pointing the way forward and providing the stakeholders with a clear pathway towards their destination. Thus, it is strongly connected to a ‘strategic intent’, which provides the focus to marshal and leverage energy, to focus attention, to resist distraction, and to concentrate to achieve a goal (Liedtka, 1998).
Thinking through different temporalities
Participatory visual mapping is often used during early stages of a design process to reflect upon the existing situation. Similarly to information visualization, it is mostly concerned with communication and less with processes (Sevaldson, 2011). The Theory of Change framework adds another dimension to participatory visual mapping by shifting the focal point from the present situation to thinking in time: what could happen in the future and how the change can occur. This ‘intent driven’ approach aims for the long term and conveys a sense of direction that implies a unique point of view about the future (Liedtka, 1998). Reframing the future connected to the problem enables stakeholders to co-create visions of a desired future (Irwin, 2018), an important key for generating a transformation. Beyond supporting a better understanding of the present in the form of inclusion and alignment of diverse stakeholders, and achieving deeper insight and alignment around current reality (Henning Buehring & Liedtka, 2018) future thinking can strongly support the transformation process and decision making (Ramos et al., 2019) by facilitating a conversation aid in specifying a portfolio of desirable futures (Henning Buehring & Liedtka, 2018; Simeone & D'Ippolito, 2022). In the Theory of Change framework, future thinking is being addressed by defining desirable futures, innovation missions and impact framework, and envisioning a future portfolio to address the missions over time.
Adaptive Creativity
A transformation process can not happen without an idea of how a change may occur. However, city transformation projects tend to take place over years and their course of action can not be completely anticipated in advance. Therefore, city stakeholders need to be constantly ready to activate their creativity to “invent solutions in real-time to problems that could not have been anticipated in advance” (Flach, 2012, p. 196). Creative capacities, e.g. the ability to generate many alternative solutions to a problem and to develop or identify unusual associations or patterns (Ford, 1996), which are articulated as core expertise of designers (Conley, 2004), are a key to overcoming these challenges (ibid). The Theory of Change framework presented here requires stakeholders not only to define the connection between activities and outcomes (Stein & Valters, 2012) but also to creatively think about what these activities could be.
Conclusions
As a single case study, the results of this research are limited to a specific context. In addition, this publication describes the first year and a half of a four-year project. By the time this paper was written, the activity plan reported here was not executed and measured. The authors do believe that reflecting upon the results of the full process could strongly contribute to analysing and improving the framework. Another angle to be considered is the role of facilitation. Interviews point out that the framework is not self-explanatory and therefore needs to be mediated by a facilitator. Facilitation adds another dimension of communication and interpretation that was not discussed in this work. Another area of interest would be to look a bit more closely into how, by working creatively through the design process, stakeholders came up with multiple ideas both for potential missions that could be addressed and for ‘meanwhile activities’ that could take place to address them. The process of converging towards specific ideas and actions was mostly done through discussions among the stakeholders based on the framework they were provided with. This process could be improved by introducing the stakeholders to the concept of leverage points e.g., identifying the most beneficial areas of intervention to drive a change. This can potentially lead to a more focused and efficient process and enhance the impact of each activity.
The limitations highlighted above qualify our study as preliminary. However, we still think that the study provides a contribution to those streams of design research that call for greater use of Theory of Change in design projects (Jones, 2014; Tonkinwise, 2015). When used within broader visual mapping processes and within a designerly approach, Theory of Change can expand its potential to represent, elaborate and navigate complexity and unleash future thinking and creativity.
Acknowledgements
The authors would like to acknowledge their partners in the T-Factor consortium, who engaged with the framework and contributed to its development by providing constant feedback and insights and who kindly participated in the interview and the focus group. A special thank you goes to the team of KPMG Belgium, which actively participated in developing the framework. The research leading to this contribution has received funding from the European Community's H2020 Programme under Grant Agreement No. 868887. This article reflects the authors' views. The European Commission is not liable for any use that may be made of the information contained therein.
Biographies

Hadas Zohar is a designer and design researcher. She is a PhD fellow at Aalborg University in Copenhagen, where she studies how participatory design mapping can help stakeholders think through multiple temporalities in urban regeneration projects.

Luca Simeone is an Associate Professor at Aalborg University in Denmark. His main interest is in the managerial, strategic and organizational aspects of design. Luca has carried out research, teaching and consulting activities in various universities (Harvard, Stanford, MIT, Milan Polytechnic, Malmö University, and University of the Arts London), (co)authoring 5 books and publications for outlets including Long Range Planning, CoDesign, Journal of Business Research, Journal of Knowledge Management, Technovation, and R&D Management.

Nicola Morelli is a Professor at Aalborg University in Copenhagen, where founded the master's in Service Systems Design. He coordinates research projects that focus on public services and social innovation. He extensively published on service design methodologies, social innovation and sustainability.
Laura Martelloni is a strategic designer with +15 years of experience in international R&I projects dealing with complex systems' innovation. She has been working for public and private organisations across Europe, including Universities, NGOs, and international design studios. Her main interest is in systems thinking and systemic design practices for societal change.

Dario Marmo is an associate of LAMA social enterprise. Dario has carried out research, project management evaluation and consulting activities in various extra-European international cooperation projects and research and innovation European projects. He also co-curated content developed within the Manifattura Tabacchi urban regeneration process in Florence (Italy).


