Longitudinal analysis of the neurological features of ataxia-telangiectasia
Abstract
Aim
To assess the relationship between genotype and neurological progression in ataxia-telangiectasia (A-T).
Methods
Clinical and laboratory data were extracted retrospectively from the records of patients attending the UK National Ataxia-Telangiectasia Clinic. Neurological assessments were performed using the A-T Index (Crawford Score) and the A-T Neurological Examination Scale Toolkit (A-T NEST). Variables influencing phenotype were identified by using an information-theoretic approach starting from a maximal model to generate estimates of coefficients for each variable. Per-individual progression was assessed for patients with three or more clinic attendances.
Results
The genotype could be determined for 125/135 patients. Crawford and A-T NEST scores were well correlated. For both scoring systems the estimated coefficients were significantly positive for Age x kinase activity but not Age x protein expression. Unlike the per–genotype analysis, the individual progression of neurological scores in the 34 patients that attended on three or more occasions was not smooth and linear (and in some cases improved over time).
Interpretation
Residual kinase activity confers a milder phenotype but there is no difference between kinase-dead and protein-null genotypes. The non-linear progression of individual patients’ neurological scores may reflect biological complexity, day-to-day variability, limitations of the assessment methods or a combination of all three.
What this paper adds
- The Ataxia-Telangiectasia Neurological Examination Scale Toolkit scoring system is well correlated with the validated Ataxia-Telangiectasia Index
- The longitudinal progression of neurological scores in individual patients is typically not smooth and linear.
Video Podcast: https://youtu.be/Zn7bQmTmzwo
Ataxia-telangiectasia (A-T) is an incurable autosomal recessive condition associated with the loss of ATM function. Incidence is estimated to be 1:300 000 live births in the UK.1, 2 The clinical features include neurological disability from progressive movement disorders, dystonia, ataxia, oculomotor abnormalities, communication difficulties, immunodeficiencies, and increased cancer susceptibility; other systemic associations include chronic respiratory disease, growth retardation, and diabetes mellitus.3 The median life expectancy of patients with A-T is 19 to 25 years.4
ATM is a serine/threonine kinase involved in DNA double-strand break repair and cell cycle arrest.3 There are over 450 documented mutations in the ATM gene that have been associated with A-T, most of which are truncating mutations (Human Gene Mutation Database5). This is significant as the kinase domain is close to the C-terminus, so truncating mutations are likely to result in loss of ATM kinase activity. Classical A-T is associated with the absence of ATM kinase activity and a severe phenotype, but the severity of A-T shows a wide degree of variation.6 The presence of residual kinase activity is associated with later onset disease, with a milder neurological phenotype and fewer systemic features.7 Of the patients with Classical A-T, some have no detectable ATM protein, whereas others express a kinase-dead protein. A cross-sectional study found no difference in neurological severity between these two groups, but that the kinase-dead genotype does have better immunological features.7 However, the clinical significance of the differences in immunological profile is uncertain, particularly as the immunological component of the disease is not progressive.8 Finally, whilst neurological impairment is worse in older Classical patients9 the nature of disease progression is currently unclear as no longitudinal studies have been published.
Two scoring systems have been developed specifically for the assessment of the neurological features of A-T. The first of these, the A-T Index (Crawford Score), consists of a 39-point scale derived from 10 items.9 The A-T Neurological Examination Scale Toolkit (A-T NEST) is a more comprehensive assessment, comprising 64 items of which 53 are purely neurological, and also has a communication domain. Both scales are used to assess patients who attend the National A-T Clinic, a multi-disciplinary clinic for patients with A-T or A-T-like disorders (ataxia telangiectasia-like disorder and ataxia with oculomotor apraxia type 1), based in Nottingham, United Kingdom (UK). It historically saw patients of all ages, but now sees only children and young people up to 16 years of age. Adults with A-T are seen in a Specialist Clinic in Papworth Hospital, Cambridgeshire, UK.
In this paper, a series of patients from this clinic is presented with investigations of genotype–phenotype correlations. The series is considerably larger than those previously published and for the first time includes longitudinal analysis of the neurological features of A-T.
Methods
Compilation of the database
Clinical and laboratory data were collected retrospectively from the medical records of patients attending the National A-T Clinic from December 2001 to March 2014. Each patient was assigned a unique ID number to allow for the creation of an anonymized database (Table SI). ATM mutations were identified in all patients with A-T, by the Taylor laboratory. ATM protein expression was assessed as either present (irrespective of the relative amount compared with normal) or absent in lymphoblastoid cell lines derived from patients by western blotting. Some cell lines expressed a ‘trace’ while others expressed a normal level for one allele. In addition, the kinase activity of any ATM protein present was also assessed by the Taylor laboratory, as described previously,10 using the same patient-derived lymphoblastoid cell lines. The types of ATM mutation and whether these are associated with retained kinase activity was discussed in Reiman et al.,10 and these same criteria have been used to ascribe the presence or absence of activity associated with expression of ATM from some common ATM mutations. For the present study kinase activity was also scored as either absent (0) or present (1), or left blank where the status was unknown. If the protein expression was recorded as absent, the kinase activity was also assumed to be absent. Radiosensitivity was scored based on the total chromosome damage (number of mainly chromatid gaps, breaks and interchanges) scored in whole blood cultures (PHA stimulated T cells) after exposure of blood to 1Gy gamma rays (137Cs) 4 hours before harvest at 72 hours (cells in G2 phase of the cell cycle).
At each visit a neurological assessment was performed using the A-T Index (giving a Crawford Score). For visits made after 2006, an additional assessment using the A-T NEST (Table SII) was performed. To account for slight revisions to the A-T NEST as it has been developed, the scores for each domain were calculated as a percentage of the maximum for the version used. The total neurological score and total score for the A-T NEST were calculated as the weighted average of the relevant domain as described in Table SII. Where data were missing from domains in either scoring system, the total score was calculated from the non-missing elements with the relative proportions between each preserved.
Statistical analyses
For longitudinal regression analysis, mixed linear models were fitted to the data using the lme4 package.11 A maximum model was specified with Neurological Score as the dependent variable and fixed effect terms for age, kinase activity, protein expression and sex, fixed effects interaction terms between age and each of the other covariates, and random effects for the intercepts, age, kinase activity, and protein expression of each participant. A complete subset of all possible models were fitted to the data and assessed for performance using corrected Akaike Information Criterion (AICc) using the MuMIn package.12 Each model was ranked by AICc and estimated coefficients and confidence intervals were calculated for each variable by model averaging with weighting determined by the relative AICc. Variables with coefficients with confidence intervals that did not span 0 were selected to create a single explanatory model. This was assessed for deviances from normality, heteroskedasticity and non-linearity using Q-Q and Tukey-Anscombe plots. Descriptive longitudinal analyses were performed on patients with neurological scores from three or more visits. To compare the two main assessors, ANCOVA was performed with Neurological Score as the dependent variable, age as the dependent variable and the assessors as the covariate. All analyses were performed using a custom script in the R statistical environment that can be shared on request. Plots were generated using the ggplot2 package.13
Ethical considerations
This was a non-intervention observational study involving retrospective review of patients’ medical records. Data was reviewed by the clinical team running the clinic, and had been routinely collected for clinical not research purposes. This gave an opportunity for quality control of the documentation and reliability of our clinical assessments. This routine clinical review is required of our clinical assessments and is an integral part of the clinical service. We hoped the study would inform and support not only our practice in the UK but also at other A-T clinics. Research Ethics Committee approval was not required.
Results
Composition of the database
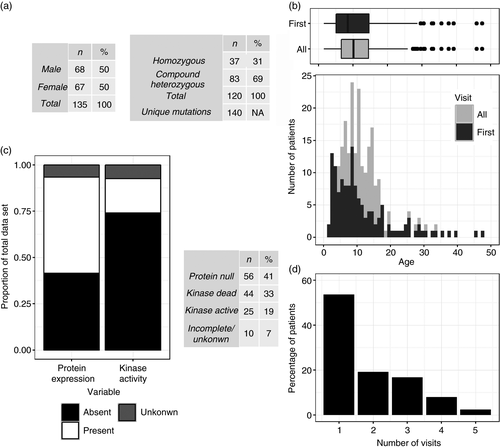
Of the 144 patients in the database, 135 had a diagnosis of A-T. 68 (50%) were male and 67 (50%) female. Genetic analysis was available for 120 (a further seven patients had only one allele characterized). Thirty-seven were homozygotes and 83 were compound heterozygotes (31% and 69% respectively). In total, 140 unique mutations are represented in the database (Fig. 1a). The median age at first presentation was 8 years 6 months, and for all visits was 10 years 1 month, with the interquartile ranges 9 years 4 months and 7 years 9 months respectively (Fig. 1b). The molecular phenotype of 125 patients (92%) was determined by western blotting of patient-derived lymphoblastoid cell lines and/or identification of previously characterized mutations. Sixty-nine patients (55% of those with data) had at least some ATM expression; however, the majority of the ATM expressed by these patients was kinase-dead (Fig. 1c). In total, 56 patients (41%) expressed no ATM protein (protein null), 44 (33%) expressed some ATM protein without kinase active (kinase dead), 25 (19%) had both ATM protein expression and kinase activity (kinase active) and 10 (7%) had incomplete or absent data. 34/125 (27%) patients had visited the clinic three times or more (Fig. 1d). Nine neurologists performed at least one of the assessments. Of the 92% where the assessor was identifiable from the notes, 85% were performed by either WPW or GC. Six of the 258 A-T Index total scores had missing data for at least one domain. In five of these cases the weight score was not recorded and in one the neuropathy was missing. For the 130 A-T NEST scores, 30 had missing data compared to the current version of the scoring system. The domains with absent data were growth (18), power (7), bradykinesia (4), neuropathy (3), nutrition (3), hyperkinesia, (1) and posture (1).
Comparison of A-T NEST and A-T Index (Crawford scores)
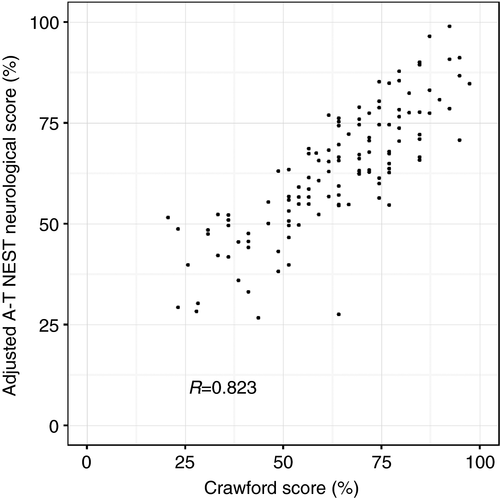
A positive correlation was observed between A-T NEST neurological scores and Crawford scores performed on the same visit (R=0.82) (Fig. 2). The A-T NEST contains many more items for each domain than the Crawford Score and so is more discriminating (Fig. S1). The A-T NEST also includes some items not affected by A-T in childhood and not included in the A-T Index, notably ‘power’. It is therefore not surprising that there is not a perfect correlation between the two scoring systems.
Longitudinal genotype–phenotype analysis
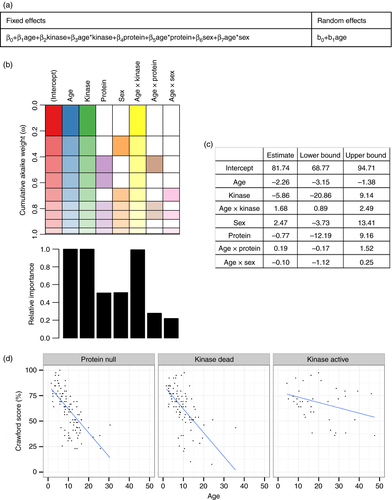
To assess the neurological progression longitudinally a mixed model approach was used with random effects accounting for per-individual variation and fixed effects based on characteristics of interest. Random effects were initially specified for intercepts and slopes; however, the latter could not be computed due to the fact that many patients had only one clinic visit. Having specified a maximal model (Fig. 3a), a complete subset of all possible models were fitted to the data and assessed for performance using cumulative AICc (Fig. 3b, upper panel). Age (Age), kinase activity (kinase) and an interaction between age and kinase activity (Age x Kinase) were the most important terms derived from this hypothesis neutral model selection approach (Fig. 3b, lower panel). The mean weighted coefficients and confidence intervals for all terms were derived (Fig. 3c). The coefficient for Age x Kinase of 1.68 [0.89–2.49, 95% confidence interval] suggests a protective effect of residual kinase activity on progression. That the confidence intervals for Age x Sex and Age x Protein span both negative and positive estimates and that inclusion of these terms into a model containing Age, Kinase and Age x Kinase does not reduce AICc means there is no evidence that Sex or Protein expression affect progression of neurological score. A model with Age, Kinase and Age x Kinase terms (i.e. the best performing model) visually appears to fit the data well (Fig. 3d).
When this modelling approach was repeated on the A-T NEST scores protein expression independent of kinase activity (protein) was also found to have a high relative importance (Fig. S2). Introducing a term for protein expression to a model containing Age, Kinase and Age x Kinase reduced the AICc (942.5 vs 946.0), but including Age x protein (i.e. that protein expression affected disease progression independent of the kinase status) did not reduce AICc (943.9 vs 942.5). Model diagnostic plots generated for the best performing model for each scoring system showed no significant violation of the assumptions required for linear modelling (Fig. S3a, b).
Descriptive longitudinal analysis
Of the 35 patients who had visited the clinic three or more times, 33 had at least three Crawford scores (one had received only an A-T NEST on one occasion, the age of the other at the time of assessment could not be determined from the medical notes). Strikingly, the majority of patients’ scores did not follow a smooth progression (Fig. 4). This was a feature of all genotype groups and was not accounted for by different assessors scoring on different occasions (Fig. S4).
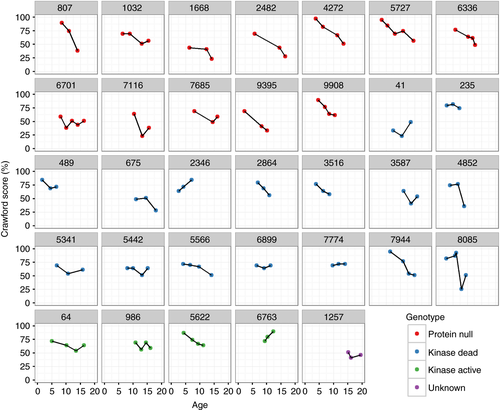
There were eight patients who had three A-T NEST scores. The progression of A-T NEST scores was similar to the Crawford scores for each patient (Fig. S5a). All of the major domains of the A-T NEST (communication, eyes, ataxia, and movement disorder) showed considerable variation in trend (Fig. S5b). The ataxia and movement domains showed the most consistent trend to decrease over time. In cases where the overall score was broadly unchanged across a 5-year series, there was much variation in the individual domains (see patients 5442 and 7774 in Fig. 4 and Fig. S5).
Discussion
With 135 patients, our cohort is larger than previous studies of the clinical features of A-T.7, 14 This paper is the first to use a longitudinal approach to compare 125 patients based on their molecular phenotype and to characterize disease progression.
The A-T Index and A-T NEST were used to quantitatively assess neurological phenotype. Unlike other ataxia assessments, both these scoring systems are designed to capture the specific features associated with A-T. A good correlation was found between A-T NEST and Crawford Scores performed on the same day, but we speculate the A-T NEST may offer discrimination of a wider range of clinical severities. A further potential benefit of the A-T NEST it that it is more discriminating within each domain. For example, the neuro-ophthalmology of A-T is assessed in the A-T Index through a single item with a range of 0–4, whereas the current version of the A-T NEST has 15 items and a range of 0–30. A prospective study directly comparing the A-T NEST and A-T Index is needed to assess the validity of the above speculations.
Mixed model analysis is a well-recognized method of dealing with longitudinal data with variable time-intervals and missing data. Consistent with previous reports, we found that the disease is, in general, progressive and that the presence of ATM kinase activity is associated with a milder phenotype. No significant interaction between age and protein expression was found, meaning that there is on average no difference in neurological progression between the protein null and kinase dead genotypes. We also find no evidence for a difference in progression between the sexes.
In a preliminary analysis of this database, we were surprised to find a slightly slower neurological progression in the kinase dead group compared to the protein null.15 In that analysis biochemical data was available for only 114 patients, rather than the 125 presented in this paper. The data for patients over the age of 20 are sparse (in part because the founding of the Papworth adult clinic coincided with our study period so new admissions to this service were not included in our cohort). Consequently in the original analysis a few data points from older patients were highly influential. The inclusion of the additional 11 patients increased the representation of older patients and consequently no significant difference between the neurological progression of the protein null and kinase dead groups remained.
The clinical findings are mirrored in the mean radiosensitivity of patient derived fresh blood lymphocytes. There was no difference between the kinase-dead and protein null groups, but there were significantly fewer foci of chromosomal damage in the kinase-active patients (Fig. S6). This further supports the idea that the clinical features of A-T are primarily a consequence of loss of ATM kinase activity.
However, in our current analysis the best performing model for the A-T NEST data did include protein as a term (i.e. that the intercepts were different between protein null and kinase dead patients). This would suggest that the onset of neurological impairment is later in the kinase-dead group compared to the protein null, but that the progression of impairment once established is the same. In contrast, inclusion of protein when modelling the Crawford Scores did not reduce the AICc and thus is not significant. The difference between the two systems may be due to having more clinic visits in which the Crawford scores were obtained and so the population variance is better reflected than for the A-T NEST scores. It will be important to repeat these analyses in the future when there is more follow-up data using the A-T NEST system to see if an effect of protein expression remains, separate from kinase activity.
There are some noteworthy limitations to even the analysis we present here. First, this was a retrospective study and so prone to confounders that we have not thought to control for. Second, there were some missing data for some domains, with the total score calculated from the non-missing elements. This is in part a reflection of the addition of new domains to the A-T NEST in subsequent revisions, but also includes a failure of the clinician to fully complete their assessments. Although this does represent a limitation of the study we note that one of the three domains most frequently affected in the A-T NEST (growth) did not form part of the neurological score with the other two (power and neuropathy) contributing only 6% and 4% each to the total score, and that just 2% of Crawford scores had a domain incomplete. Third, there were insufficient data to introduce per-individual slopes, limiting the utility of the mixed model approach. Fourth, in the first few years that the clinic was run attendances were not at fixed intervals, and even after this remain at the discretion of the families, who often have to travel great distances to attend. Consequently, there were relatively few repeated measures for each patient, reducing the accuracy of fixed-effects modelling. Finally, the data is skewed towards the paediatric population and so we cannot exclude the possibility of subtle differences in adulthood. Future work following patients described in this work into adulthood would be valuable.
In addition to the mixed model approach, descriptive analyses were performed. Whilst in general neurological scores are worse in older patients, the scores of individual patients do not decrease linearly over time. This non-linearity was seen in all three groups. This was true for both of the scoring systems used. Although we acknowledge the limitations of only having eight patients who had three or more A-T NEST scores, all of the major domains in the A-T NEST also showed considerable variability within patients over time. The key question is whether the neurological features of A-T are genuinely fluctuant or have our assessments not captured the true clinical picture? Most of the patients are children, so fatigue and emotional state could be important confounders (especially so as the data are collected in the context of a day-long multidisciplinary clinic). It is also possible that there is significant inter-observer variability. This is less likely for three reasons. First the A-T Index has been shown to have good interobserver reliability in most domains9 (a validation study for the A-T NEST is currently in progress). Second, the fluctuations in scores were not associated with any particular assessors (Fig. S4). Third, when looking at the whole data set (where the patients were not allocated to specific assessors) there was no significant difference in the regression slopes or intercepts between the two main assessors, WPW and GC (Fig. S7). It seems likely that the non-linear progression seen may simply be due to their day-to-day and hour-to-hour variation associated with fatigue and fluctuations in mood, which are commonly reported by parents/guardians. However, until we have completed the interobserver validation of the A-T NEST, and the non-linear progression of the neurological function is better understood, we will continue to use both in clinical assessments, with the addition of a parent/guardian score of the child's fatigue/performance at the time of testing.
Ultimately, determining the natural history of A-T through longitudinal studies is important to be able to provide education to patients and their families as well as potentially helping understand the pathophysiology of the disease. Despite this paper being the largest study of the neurological features of A-T, a still-larger data set with more visits for each patient and assessment of other systems affected by the disease would be necessary to produce a more robust predictive model. This may be possible in future as existing patients are now invited for bi-annual follow-up and funding for an international registry of patient data has been sought. However, our work clearly highlights the need for a critical evaluation of the assessment tools currently used, in addition to multi-centre collaboration to better characterize the disease and its natural history.
Acknowledgements
The authors would like to acknowledge the Ataxia-Telangiectasia Society for co-ordinating the National Ataxia-Telangiectasia Clinic and supporting the families of the patients, Jayesh Batt, Elizabeth McDermott, Graham Davies, Lucy Cliffe, Janet Corderoy, Sarah Jessop, Jane Flint, Anette Browne, Nicola McNarry, Alison Cooke, and Sara Pasalodos in the Ataxia-Telangiectasia Clinic. Mehluli Ndlovu and Andrea Venn for their statistical advice, and the Department of Health for commissioning and funding the National Ataxia-Telangiectasia Clinic in Nottingham.
Competing Interests
The authors declare no competing interests.
Author Contributions
TJJ compiled the database, analysed the data and drafted the manuscript, GC and WPW designed the project and revised the manuscript, MRT and PB reviewed the mutational data. All authors read and approved the final manuscript.


