The role of artificial light at night and road density in predicting the seasonal occurrence of nocturnally migrating birds
Funding information
The Leon Levy Foundation; The Wolf Creek Charitable Foundation; Lyda Hill Philanthropies; Amon G. Carter Foundation; National Science Foundation, Grant/Award Number: ABI sustaining DBI-1939187 and ICER-1927743. Computing support was provided by the National Science Foundation, Grant/Award Number: CNS-1059284 and CCF-1522054, and the Extreme Science and Engineering Discovery Environment (XSEDE), National Science Foundation, Grant/Award Number: ACI-1548562, through allocation TG-DEB200010 run on Bridges at the Pittsburgh Supercomputing Center
Abstract
Aim
Artificial light at night (ALAN) and roads are known threats to nocturnally migrating birds. How associations with ALAN and roads are defined in combination for these species at the population level across the full annual cycle has not been explored.
Location
Western Hemisphere.
Methods
We estimated range-wide exposure, predictor importance and the prevalence of positive associations with ALAN and roads at a weekly temporal resolution for 166 nocturnally migrating bird species in three orders: Passeriformes (n = 104), Anseriformes (n = 27) and Charadriiformes (n = 35). We clustered Passeriformes based on the prevalence of positive associations.
Results
Positive associations with ALAN and roads were more prevalent for Passeriformes during migration when exposure and importance were highest. Positive associations with ALAN and roads were more prevalent for Anseriformes and Charadriiformes during the breeding season when exposure was lowest. Importance was uniform for Anseriformes and highest during migration for Charadriiformes. Our cluster analysis identified three groups of Passeriformes, each having similar associations with ALAN and roads. The first occurred in eastern North America during migration where exposure, prevalence, and importance were highest. The second wintered in Mexico and Central America where exposure, prevalence and importance were highest. The third occurred throughout North America where prevalence was low, and exposure and importance were uniform. The first and second were comprised of dense habitat specialists and long-distance migrants. The third was comprised of open habitat specialists and short distance migrants.
Main conclusions
Our findings suggest ALAN and roads pose the greatest risk during migration for Passeriformes and during the breeding season for Anseriformes and Charadriiformes. Our results emphasise the close relationship between ALAN and roads, the diversity of associations dictated by taxonomy, exposure, migration strategy and habitat and the need for more informed and comprehensive mitigation strategies where ALAN and roads are treated as interconnected threats.
1 INTRODUCTION
Approximately 20% of the world's bird species display seasonal migratory behaviour (Sheard et al., 2020), which can be divided into two broad categories. The first comprises species that migrate during the day, many of which rely on soaring flight during migration, such as raptors and vultures, while others rely on powered flight, such as swallows. The second comprises species that migrate at night, which consist primarily of songbirds, waterfowl and shorebirds that rely almost exclusively on powered flight during migration. Among the most pervasive challenges that human activities have created for nocturnally migrating birds are artificial light at night (ALAN) and roads. ALAN adversely affects the behaviour and physiology of organisms worldwide (Rich & Longcore, 2013; Sanders et al., 2020), with consequences often scaling up to populations, communities and ecosystems (Falcón et al., 2020; Gaston et al., 2015; Sanders & Gaston, 2018). For nocturnally migrating passerine bird species, ALAN interferes with orientation during migratory flight (Gauthreaux & Belser, 2006), increasing time and energy expenditures as individuals are drawn away from their intended migration routes (Bruderer et al., 1999; Larkin & Frase, 1988; Van Doren et al., 2017). Encountering ALAN also enhances the risk of colliding with illuminated structures such as buildings or communications towers (Gehring et al., 2009; Lao et al., 2020; Loss et al., 2014; Van Doren et al., 2021). Urban areas are the strongest source of ALAN (Falchi et al., 2016) and the diurnal abundance (La Sorte et al., 2017) and species richness (La Sorte & Horton, 2021) of nocturnally migrating birds are higher in urban areas with higher ALAN levels.
Roads represent an additional hazard for nocturnally migrating birds. Roads can be a major source of ALAN (Cheon & Kim, 2020) and roads usually occur at greater densities in regions with higher ALAN (Meijer et al., 2018). In addition to being a source of ALAN, roads can adversely affect birds in other ways. For example, roads contribute to noise pollution (Shannon et al., 2016), air pollution (Leonard & Hochuli, 2017), habitat fragmentation (Fahrig, 2003) and edge effects (Murcia, 1995; Stirnemann et al., 2015), all of which can negatively affect bird populations (Kociolek et al., 2011). Populations of passerine bird species that do not avoid roads or are disturbed by traffic are more likely to be adversely affected by road exposure (Rytwinski & Fahrig, 2012). For example, common and widespread species (Cooke et al., 2020) and migratory species (Cooke et al., 2020) exposed to major roads in Great Britain tend to display decreased abundance. For birds, traffic noise is a primary disturbance along roads that can interfere with acoustic signals, mask predator activity and increase physiological stress (Slabbekoorn & Ripmeester, 2008). Traffic noise has been associated with decreased abundance of some breeding passerine species (Goodwin & Shriver, 2011; Proppe et al., 2013; Rheindt, 2003) and the abundance, body condition and stopover efficiency of migrating passerine species have been found to decline with increasing traffic noise (McClure et al., 2013, 2017; Ware et al., 2015). A more immediate threat than traffic noise for birds are collisions with vehicles (Summers et al., 2011). Vehicular collisions represent a significant source of mortality for birds in North America (Bishop & Brogan, 2013; Loss et al., 2014) and Europe (Grilo et al., 2020; Morelli et al., 2020).
The combined effects of ALAN and roads on nocturnally migrating bird populations across the full annual cycle remain poorly understood. An initial expectation is that the attractive influence of ALAN during nocturnal migration should result in stronger diurnal associations with both ALAN and roads, especially in high exposure regions. Our objective in this study is to document how diurnal associations with ALAN and roads are defined range wide across the annual cycle for a diverse collection of nocturnally migratory bird species, and how these associations differ among Passeriformes and the traits that underlie these differences. Here, we estimate within the Western Hemisphere the importance of ALAN and roads in predicting the weekly occurrence of nocturnally migrating bird species and the prevalence of positive associations with ALAN and roads within the weekly distributions of nocturnally migrating bird species. We use diurnal observations from the eBird community-science programme over a 16-year period (Sullivan et al., 2014) to generate weekly estimates of relative abundance at a 2.96 × 2.96 km spatial resolution for 166 nocturnally migrating bird species in three taxonomic orders: Passeriformes (song birds; n = 104), Anseriformes (waterfowl; n = 27) and Charadriiformes (shorebirds; n = 35). We use predictor importance (PI) and partial dependence (PD) statistics to quantify associations between species' occurrence and ALAN and road density using four functional road types (highways, primary roads, secondary roads and local roads). To provide a baseline for interpretation, we also measure species' weekly exposure to ALAN and roads. Because Passeriformes have been the primary focus of ALAN and road research and contain the largest sample size in our analysis, we apply additional analyses to Passeriformes. We first identify clusters of Passeriformes that share similar relationships based on the prevalence of positive associations with ALAN and road density across the annual cycle. We then examine differences among species in each cluster using four traits: range size, migration distance, body mass and primary habitat association. The trait analysis allows us to examine how geography, morphology and behaviour differ among species in the clusters.
Based on findings from the ALAN and road studies outlined above, we can generate predictions on how associations with ALAN and road density are likely to be defined across the annual cycle for Passeriformes. Because most Passeriformes breed and winter outside of highly developed areas, we expect exposure and the prevalence of positive associations with ALAN and roads to be lower during the breeding and non-breeding seasons, especially with major road types where traffic noise and other disturbances are likely to be more extreme. During spring and autumn migration, we expect exposure and the prevalence of positive associations with ALAN and roads to increase, especially with minor road types where traffic noise and other disturbances are likely to be less extreme.
How Anseriformes and Charadriiformes associate with ALAN and roads across the annual cycle has received far less attention. Unlike Passeriformes, the reliance on aquatic habitats by most Anseriformes and Charadriiformes limits where these species can occur across the annual cycle. Due to the low occurrence of roads within most aquatic habitats, we would expect exposure and the prevalence of positive associations with roads to be lower across the annual cycle compared to Passeriformes. This is supported based on evidence that Anseriformes and Charadriiformes are rarely killed through vehicular collisions (Bishop & Brogan, 2013). During the non-breeding season, there is evidence that Anseriformes do not avoid roads (Ringelman et al., 2015) and there is evidence that Charadriiformes do avoid roads (Burton et al., 2002), suggesting contrasting associations with roads may occur outside of migration between these two groups. Urban areas, a significant source of ALAN, often occur near major aquatic features (e.g., rivers, lakes, estuaries or bays) and, unlike roads, the effects of urban sources of ALAN can extend out over aquatic features. We would therefore expect exposure and the prevalence of positive associations with ALAN to be higher across the annual cycle than that for roads and potentially higher than that for Passeriformes during the breeding and non-breeding seasons. During migration, based on evidence that Anseriformes and Charadriiformes rarely collide during nocturnal migration with buildings (Loss, Will, Loss, et al., 2014; Van Doren et al., 2021) or communication towers (Shire et al., 2020), we would expect lower exposure and a lower prevalence of positive associations with ALAN during migration when compared to Passeriformes.
2 MATERIALS AND METHODS
2.1 Bird data and models
We acquired weekly estimates of bird occurrence and relative abundance across the Western Hemisphere from Adaptive Spatio-Temporal Exploratory Models (AdaSTEM) (Fink, Auer, Johnston, Ruiz-Gutierrez, et al., 2020; Fink et al., 2013) using diurnal observations from the eBird community-science programme (Sullivan et al., 2014). See Figure 1 for summary of the AdaSTEM analytical workflow. AdaSTEM estimates occurrence and relative abundance using an ensemble of tens of thousands of local regression models, and averages over 100 local regression models for each prediction in a given location and week. The local regression models are two-step zero-inflated boosted regression trees, run with a total of 88 predictors in three classes: six observation-process predictors that account for variation in detection rates, three temporal predictors at different scales and 79 environmental descriptors including ALAN and road density (Fink, Auer, Johnston, Ruiz-Gutierrez, et al., 2020; Johnston et al., 2015). Estimates across the ensemble of locally resampled regression models capture sampling variation within and between models. Averaging ensemble estimates controls for overfitting (Efron, 2014) while naturally adapting to the non-stationary relationships between species and their environments (Fink et al., 2010). For each ensemble run, eBird data are independently subsampled using a randomised spatial and temporal location and orientation (Fink, Auer, Johnston, Ruiz-Gutierrez, et al., 2020). This starts by specifying the temporal dimension of the partitions to be 366 days divided by 12 temporal partitions using a random starting date, equaling 30.5 contiguous days. The 30.5-day window is considered small enough to capture a wide variety of migration patterns across a diverse set of terrestrial species (Fink, Auer, Johnston, Ruiz-Gutierrez, et al., 2020; Johnston et al., 2015). This is followed by a randomly located and oriented grid whose area is adaptively sized based on data density. These spatiotemporal partitions (stixels) are smaller in data rich regions and larger in data poor regions, resulting in a similar level of uncertainty across the study area (Fink, Auer, Johnston, Ruiz-Gutierrez, et al., 2020).
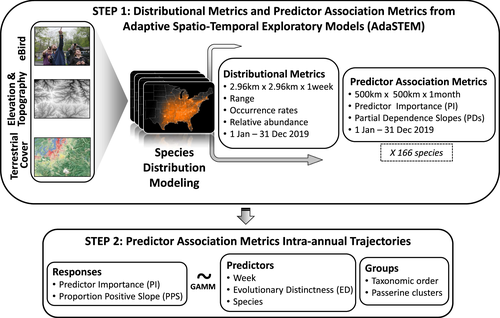
We used modelled products from the 2020 release of AdaSTEM, which predicts weekly occurrence and relative abundance for the year 2019 across the Western Hemisphere (Fink, Auer, Johnston, Strimas-Mackey, et al., 2020). We used the AdaSTEM variable abundance_median in our analysis and two AdaSTEM occurrence-based statistics, PI and PD, which we define below, for two environmental descriptors in the model, ALAN and road density. AdaSTEM controls for variation in detectability associated with search effort by standardising the relative abundance estimates as the expected occurrence rate and count of the species on a search conducted for a fixed time period and distance at the optimal time of day for detection of that species by a skilled birdwatcher (Fink, Auer, Johnston, Ruiz-Gutierrez, et al., 2020; Fink et al., 2013). Weekly estimates of relative abundance were available for 807 species and rendered at a 2.96 × 2.96 km spatial resolution for the year 2019 using bird observations submitted from 1 January 2005 through 10 April 2020 (Fink, Auer, Johnston, Strimas-Mackey, et al., 2020). The year 2019 was selected because it was the most recent year that contained a full set of bird observations, and the volume of bird observations in eBird was greatest during this year. We used the 5% quantile applied to the weekly relative abundance estimates to remove 2.96 × 2.96 km cells for each species and week that contained unusually small values. This procedure removed data from the peripheries of species' distributions where the relative abundance estimates were closest to zero. We applied this procedure because it generated more consistent results in the PI and PD statistics, described below.
2.2 ALAN and road density
The ALAN predictor in AdaSTEM (Figure S1) was based on data from the Visible and Infrared Imaging Suite (VIIRS) Day Night Band (DNB) on board the Joint Polar-orbiting Satellite System satellites (Miller et al., 2012). From the VIIRS-DNB, we used the VCM-ORM-NTL (VIIRS Cloud Mask – Outlier Removed – Nighttime Lights) annual composite for 2016 at a 15 arc-second (~500 m at the equator) spatial resolution (Elvidge et al., 2017). The road density predictor in AdaSTEM was based on the vector data from the Global Roads Inventory Project, which was generated using 66 geospatial datasets compiled from 1997 to 2015 (Meijer et al., 2018), and used here to calculate road densities within each 2.96 × 2.96 km cell. We considered road density estimates for four commonly applied functional road types: highways, primary roads, secondary roads and local roads (Figure S2). Within the Western Hemisphere, the highest density for all four functional road types occurred in North America, primarily within the contiguous US (Figure S2). We excluded a fifth functional road type from our analysis, tertiary roads, because the category was not applied uniformly across our study area (Figure S2). The correlation between ALAN (Figure S1) and road density (Figure S2) within the Western Hemisphere was generally low: highways (ρ = 0.17), primary roads (ρ = 0.12), secondary roads (ρ = 0.24) and local roads (ρ = 0.37).
We summarised each species' weekly range-wide exposure to ALAN and road density using the following procedure. First, we resampled the gridded ALAN and road density data to match the AdaSTEM 2.96 × 2.96 km spatial resolution using bilinear interpolation. We then calculated the weighted average ALAN and the weighted average road density across the 2.96 × 2.96 km cells for each species and week using relative abundance as a weighting factor after applying the 5% threshold. We log10 transformed road density to improve its distributional properties before calculating the weighted average.
2.3 Predictor Importance and Partial Dependence
We summarised weekly range-wide associations between species occurrence and each of the individual predictors (ALAN, highways, primary roads, secondary roads and local roads) using two primary statistics. The first, PI, measures the relative contribution of each predictor to each of the regional ensemble models. PI is defined as the change in predictive performance between the model that includes all predictors and the same model with permuted values of the given predictor (Breiman, 2001). PI is indifferent to direction of the effect, so captures both positive and negative effects arising from both additive and interacting model components. The second, PD, describes the functional form of the additive association of each predictor by averaging out the effects of all the remaining predictors (Hastie et al., 2009). PD is estimated for each of the regional ensemble models. PD measures the change in the logit of the probability of occurrence per one percent increase in ALAN or road density for each stixel. PD is only calculated for the top 30 predictors based on PI, and the lack of a PD estimate for a stixel is interpreted as no association. We extracted information about the direction of association in the PD statistic (positive or negative) for each stixel using simple linear regression to estimate the PD slope.
We generated weekly range-wide summaries of PI by averaging PI values across the local regression models in the AdaSTEM ensemble whose centroids fell within that week. This procedure was implemented after the 2.96 × 2.96 km cells that contained unusually small relative abundance estimates were removed based on the 5% quantile. We summarised the weekly range-wide distribution of PD slopes for each species using the proportion of positive slope (PPS), defined as the proportion of stixels where the PD slope was positive. Here, PPS estimates the geographic prevalence of positive associations with ALAN and road density for each week. PPS close to zero provides evidence that negative associations are more prevalent, PPS close to one provides evidence that positive associations are more prevalent and PPS close to 0.5 provides evidence for an equal combination of positive and negative associations. The magnitude of PPS associations for ALAN and road density can be loosely inferred based on the PI statistics and the consistency in effect directions across the ensemble of local models measured by PPS.
From the 452 North American terrestrial bird species classified as migratory, 308 are identified as exclusively nocturnal migrants (Horton et al., 2019). From the 308 species of nocturnal migrants, 300 were modelled by AdaSTEM. From these, we selected 194 species for analysis whose breeding and non-breeding ranges intersected <20% using range maps from BirdLife International and Handbook of the Birds of the World (2019). We estimated the percent overlap by dividing the area of the resident polygon by the sum of the areas of the resident, breeding season and non-breeding season polygons. This step increased the quality of the migration signal in our analysis by providing regions of passage where species only occurred during migration. We further restricted our sample to species that occurred in taxonomic orders whose PI and PPS estimates were available for all 52 weeks of the annual cycle. This final step resulted in 166 species for analysis in three orders: Anseriformes (n = 27), Charadriiformes (n = 35) and Passeriformes (n = 104; Table S1). The 166 species represented 53.9% of the nocturnally migrating bird species in North America and 64.3% of the nocturnally migrating Anseriformes, 71.4% of the nocturnally migrating Charadriiformes and 61.5% of the nocturnally migrating Passeriformes. The 166 species included a broad range of migration distances from 384 to 13,017 km based on the great circle distance measured between the breeding and non-breeding range centroids.
We modelled the average change across weeks in exposure, PI and PPS for species in each taxonomic order using generalised additive mixed models (GAMM) with the intercept for species included as a random effect (Wood, 2017). This resulted in a total of nine GAMMs for ALAN and 45 GAMMs for road density across the four functional road types. We used a cyclic penalised cubic regression spline to smoothly join the first week and last week of each year. We included estimates of evolutionary distinctness (ED) from Jetz et al. (2014) as a weighting factor in the GAMM fits to account for phylogenetic non-independence among species. We used the median ED values calculated across 10,000 phylogenies (Jetz et al., 2014) based primarily on the backbone tree from Hackett et al. (2008). Four species had scientific names in the eBird database that did not occur in the ED taxonomy. To support our analysis, we used the ED estimates from species whose scientific names were synonyms or the most closely related species if the species had been split. Specifically, we used the ED estimates for the species Ammodramus leconteii, Amphispiza belli, Gallinago gallinago and Dendroica nigrescens for the following species identified in the eBird database, Ammospiza leconteii, Artemisiospiza nevadensis, Gallinago delicata and Setophaga nigrescens, respectively.
2.4 Migration phenology
To support our interpretation, we summarised migration phenology for the 166 species by calculating each species' weekly geographic centre of occurrence weighted by relative abundance using the n-vector framework for geographical position calculations (Gade, 2010). This framework uses the normal vector to the Earth ellipsoid (the n-vector) as a non-singular positive representation. We first extracted the latitude and longitude of the centre of the 2.96 × 2.96 km cells that contained relative abundance estimates that were >0. We converted these two-dimensional geodetic coordinates into three-dimensional n-vectors. We then calculated the weighted average n-vector for each week using the relative abundance estimates as a weighting factor. We then converted the n-vector back to latitude and longitude. To estimate migration speed, we measured the great-circle distance between sequential pairs of weekly centroids. We summarised population-level migration speed (km week−1) for species in each order by applying GAMMs to the migration speed estimates using a cyclic penalised cubic regression spline, ED as a weighting factor and species as a random intercept (Figure S3a). Lastly, we identified the peak spring and autumn migration periods for the 104 passerine species using the instantaneous rate of change (first derivative) of GAMM estimate of migration speed. We first extracted the predicted values from the GAMM fit (see Figure S3a). We then identified the weeks in the spring containing the maximum and minimum instantaneous rate of change and the weeks in the autumn containing the maximum and minimum instantaneous rate of change (Figure S3b). The period that fell between these weeks that straddled the seasonal maximum migration speeds defined the peak migration periods (Figure S3b).
2.5 Hierarchical cluster analysis
We used the following approach to cluster the 104 passerine species based on their weekly PPS estimates for ALAN and their weekly PPS estimates for road density. We averaged the PPS estimates across the four functional road types to support the road cluster analysis. First, we applied a hierarchical cluster analysis separately to the 104 PPS vectors (vector length = 52 weeks) for ALAN and road density to identify groups of species that shared similar PPS associations across the annual cycle. We used the Euclidean distance between the 104 vectors with the Ward's minimum variance method to implement the hierarchical cluster analysis (Murtagh & Legendre, 2014). We identified prominent clusters of species using an adaptive branch pruning technique, which detects clusters based on the structure of the branches within the dendrogram and is a more flexible approach compared to the constant or static height method (Langfelder et al., 2008). We used the ‘Dynamic Hybrid’ method with a minimum cluster size of 10 species (Langfelder et al., 2016). We summarised exposure, PPS and PI associations for species in each cluster using GAMM with a cyclic penalised cubic regression spline, ED as a weighting factor and species as a random intercept. For the road cluster analysis, we applied a GAMM to each of the four road functional types.
We summarised characteristics of the Passeriformes species identified in each cluster using four common avian traits (see Table S2). The first was the size of each species' breeding range, acquired from BirdLife International and Handbook of the Birds of the World (2019). The second was migration distance estimated using the great circle distance calculated between the geographic centroids of the each species' breeding and non-breeding ranges acquired from BirdLife International and Handbook of the Birds of the World (2019). The third was body mass acquired from Sheard et al. (2020). The fourth was primary habitat association based on three habitat scores (dense, semi-open and open) acquired from Tobias et al. (2016). We log10 transformed migration distance and body mass to improve their distributional properties for analysis.
We tested for significant differences in the four traits among species in each cluster using the following approach. For the three continuous traits (range size, migration distance and body size) we used bootstrap heteroscedastic one-way ANOVA and post hoc tests for trimmed means with a 20% trim level and 99,999 bootstrap samples (Wilcox, 2017). For the one categorical trait (primary habitat association), we first calculated the proportion of species with each trait value. We then applied permutation tests to identify proportions that were less than or greater than expected by chance. The permutation procedure involved sampling cluster identification across the 104 species 10,000 times without replacement. Each observed proportion was then contrasted with the distribution of 10,000 sampled proportions to generate p-values.
We implemented our analysis using the statistical software package R, version 4.0.5 (R Development Core Team, 2021). In the ebirdst library (version 1.0.0), we used the ebirdst_download function to acquire AdaSTEM data products and we used the ebirdst_habitat function to extract weekly PI and PD estimates (Auer et al., 2020). We conducted the n-vector calculations using the nvctr library (Spinielli, 2021). We calculated great-circle distances using the distVincentyEllipsoid function in the geosphere library (Hijmans, 2021). We extracted first derivatives using the features library (Varadhan, 2015). We used the gamm4 library to implement GAMM (Wood & Scheipl, 2020). We implemented the hierarchical cluster analysis using the hclust function in the stats library and the adaptive branch pruning technique using the dynamicTreeCut library with the deepSplit option set to one (Langfelder et al., 2016). We implemented the bootstrap heteroscedastic one-way ANOVA and post hoc tests using the t1waybt and mcppb20 functions in the WSR2 library (Mair & Wilcox, 2020).
3 RESULTS
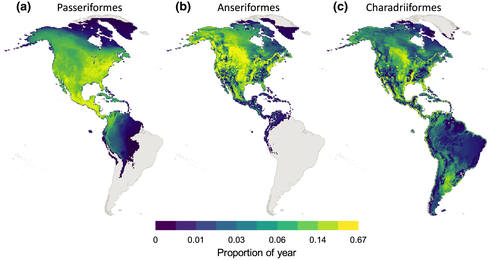
Across the annual cycle, the geographic distributions of species in the three taxonomic orders within the Western Hemisphere differed. The 104 species of Passeriformes occurred across North America, Central America and northern South America and spent most of the annual cycle within eastern North America and Central America (Figure 2a). The 27 species of Anseriformes occurred across North America and Central America and spent most of the annual cycle within the central portion of North America (Figure 2b). The 35 species of Charadriiformes occurred across the entire Western Hemisphere and spent most of the annual cycle within the central portion of North America (Figure 2c).
3.1 Exposure
Seasonal variation in ALAN exposure differed on average among species in the three taxonomic orders (Figure 3a; Table S3). ALAN exposure was highest on average for Passeriformes during migration and lowest on average during the breeding and non-breeding seasons (Figure 3a). ALAN exposure was highest on average for Anseriformes and Charadriiformes during the non-breeding season and lowest during the breeding season (Figure 3a).
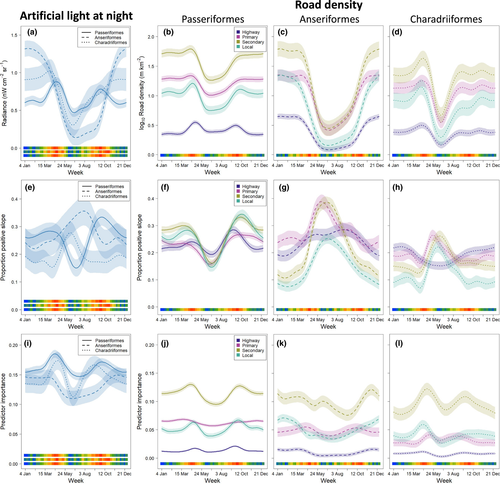
Seasonal variation in road exposure across the four functional road types differed on average among species in the three taxonomic orders (Figure 3b–d; Table S3) and broadly followed the patterns documented for ALAN (Figure 3a). For Passeriformes, road exposure was highest on average for secondary roads and lowest on average for highways (Figure 3b). For secondary roads, the highest levels occurred during the non-breeding season and lowest during the breeding season (Figure 3b). There was evidence for small increases in exposure during migration on average for local roads and highways (Figure 3b).
For Anseriformes, road exposure was highest on average across the four functional road types during the non-breeding season, especially with secondary roads, primary roads and local roads, and lowest on average during the breeding season, especially with local roads and highways (Figure 3c). There was no evidence that migration resulted in higher or lower road exposure for Anseriformes (Figure 3c).
For Charadriiformes, road exposure across the four functional road types was highest on average during spring migration and the non-breeding season and lowest on average during the breeding season (Figure 3d). Seasonal variation in road exposure was strongest with secondary roads, which had the highest overall levels, and weakest with highways, which had the lowest overall levels (Figure 3d).
3.2 Proportion of positive slope
Proportion of positive slope for ALAN was less than 0.5 on average across the annual cycle for all three taxonomic orders, indicating a greater prevalence of negative associations within species' weekly distributions (Figure 3e; Table S3). PPS for ALAN reached its highest levels on average for Passeriformes during autumn migration and lowest levels on average during the breeding season (Figure 3e). PPS for ALAN reached its highest levels on average for Anseriformes during the end of the breeding season and during the beginning of the breeding season for Charadriiformes (Figure 3e).
Proportion of positive slope for road density was less than 0.5 on average across the annual cycle for all three taxonomic orders and for all four functional road types, indicating a greater prevalence of negative associations within species' weekly distributions (Figure 3f–h; Table S3). For Passeriformes, PPS reached its lowest levels across the four functional road types during the breeding season and its highest levels during migration, especially in the autumn with secondary roads and local roads having the highest overall levels (Figure 3f). For Anseriformes, PPS for primary roads, secondary roads and local roads was highest on average during the breeding season, especially for primary and secondary roads, and lowest on average during the non-breeding season, especially for secondary roads and local roads (Figure 3g). Highways displayed intermediate levels on average for Anseriformes that were highest during the breeding season and autumn migration (Figure 3g). For Charadriiformes, PPS reached its highest levels on average during the breeding season and lowest levels on average during the non-breeding season for primary roads, secondary roads and local roads (Figure 3h). Highways showed the opposite pattern, with intermediate levels on average for Charadriiformes that were lowest during the breeding season (Figure 3h).
3.3 Predictor importance
Predictor importance for ALAN was between 0.1 and 0.2 on average across the annual cycle for all three taxonomic orders, suggesting ALAN is a consistently important predictor (Figure 3i; Table S3). PI for ALAN differed on average among species in the three taxonomic orders, primarily outside the non-breeding season (Figure 3i). PI for ALAN reached its highest levels on average for Passeriformes and Charadriiformes during migration, especially in the spring (Figure 3i). PI for ALAN reached its highest levels on average for Anseriformes during the non-breeding season and lowest during the breeding season (Figure 3i).
Predictor importance for road density was between 0 and 0.15 on average across the annual cycle for all three taxonomic orders (Figure 3j–l; Table S3), suggesting road density is a less important predictor compared to ALAN (Figure 3i). PI for road density for all three taxonomic orders displayed on average the same sequence with secondary roads having the highest levels and highways having the lowest levels (Figure 3j–l). For Passeriformes, PI for road density showed limited seasonal variation on average except for secondary roads and local roads where the highest levels occurred during migration and lowest levels during the breeding season (Figure 3j). For Anseriformes, PI for road density showed limited seasonal variation on average except for secondary roads and local roads where the highest levels occurred during the non-breeding season (Figure 3k). For Charadriiformes, PI for road density reached its highest levels on average during migration for secondary roads and local roads (Figure 3l).
3.4 ALAN hierarchical cluster analysis
Our PPS cluster analysis for ALAN identified three prominent clusters of passerine species (Figure S4a; Table S2). Exposure to ALAN was greatest on average during migration for species in all three clusters, although there was variation in the precise timing and magnitude of these peaks (Figure 4a; Table S3). Exposure to ALAN for species in cluster one was greatest on average during both spring and autumn migration and lowest during the breeding and non-breeding seasons (Figure 4a). Exposure to ALAN for species in cluster two was greatest on average during the beginning of spring migration, which was the highest level achieved on average across all three clusters, and exposure was lowest on average during the breeding season (Figure 4a). Exposure to ALAN for species in cluster three showed limited seasonal variation on average with a minor peak occurring during spring migration (Figure 4a).
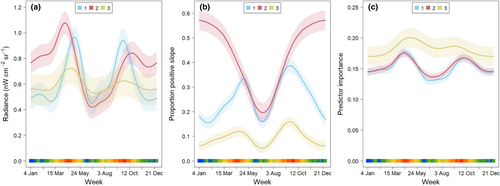
In contrast to exposure, PPS presented strong seasonal differences among species in the three clusters (Figure 4b; Table S3), which is expected given these values were used to construct the clusters. PPS for ALAN for species in cluster one reached its highest levels on average during migration, especially in the autumn where it approached 0.4 (Figure 4b). PPS for ALAN for species in cluster two approached 0.6 on average during the non-breeding season, the highest level overall, and dropped to 0.2 on average during the breeding season (Figure 4b). PPS for ALAN for species in cluster three was lowest overall on average with the highest levels occurring during migration, especially in the autumn (Figure 4b). PI for ALAN reached its highest levels on average during migration for all three clusters, especially in the spring (Figure 4c; Table S3).
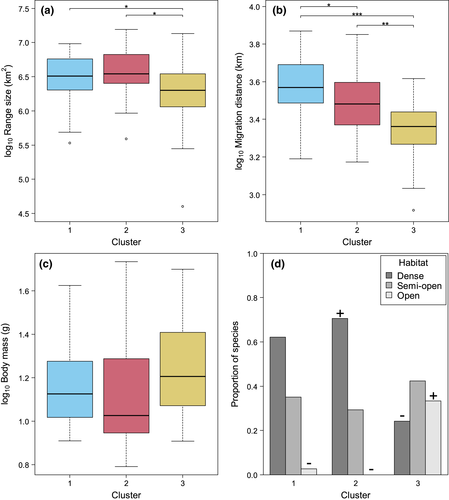
Breeding range size differed significantly on average among species in the three clusters (Test statistic = 3.40, p = .045; Figure 5a). Breeding range size was lower on average for species in cluster three compared to species in cluster one (p = .030) and cluster two (p = .010; Figure 5a). Migration distance differed significantly on average among species in the three clusters (Test statistic = 19.89, p < .001; Figure 5b). Migration distances were longer on average for species in cluster one compared to species in cluster two (p = .026), were longer on average for species in cluster one compared to species in cluster three (p < .001) and were longer on average for species in cluster two compared to species in cluster three (p = .002; Figure 5b). Body size did not differ significantly on average among species in the three clusters (test statistic = 2.10, p = .149; Figure 5c). Open habitat had lower representation in cluster one, dense habitat had higher representation and open habitat had lower representation in cluster two, dense habitat had lower representation and open habitat had higher representation in cluster three (Figure 5d).
3.5 Road density hierarchical cluster analysis
Our PPS cluster analysis for average road density identified three prominent clusters of passerine species (Figure S4b; Table S2). We labelled the three road density clusters based on similarities in species composition with the clusters identified by the ALAN hierarchical cluster analysis (Figure S4a–b). Exposure to roads for species in all three clusters was greatest overall for secondary roads and lowest overall for highways (Figure 6a–c; Table S3). Exposure to roads for species in cluster one was highest on average during migration for all four functional road types (Figure 6a). Exposure to roads for species in cluster two displayed a similar arrangement to that documented for cluster one with a weaker increase on average during migration and stronger decline on average during the breeding season (Figure 6b). Exposure to roads for species in cluster three displayed a similar arrangement to those documented for clusters one and two with substantially lower seasonal variation (Figure 6c).
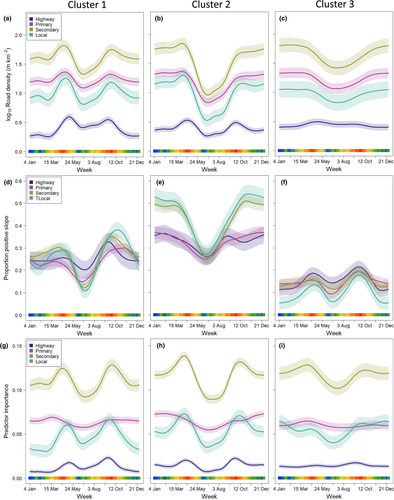
Proportion of positive slope for species in cluster one was highest on average during migration, especially in the autumn with levels approaching 0.4 and was lowest on average during the breeding season (Figure 6d; Table S3). PPS for species in cluster two was highest on average for secondary and local roads during the non-breeding season, with levels approaching 0.55, and lowest on average during the breeding season with levels approaching 0.3 (Figure 6e; Table S3). PPS for species in cluster three had the lowest levels overall on average, below 0.2, with the highest levels occurring during migration, especially in the autumn (Figure 6f; Table S3). In general, PPS for road density (Figure 6d–f) was similar to PPS for ALAN within the same clusters (Figure 4b).
Predictor importance for species in cluster one was highest overall on average for secondary roads and lowest overall for highways (Figure 6g; Table S3). PI for species in cluster one was highest on average during migration for secondary roads, local roads and highways (Figure 6g; Table S3). PI for species in cluster two displayed nearly identical patterns to those documented for cluster one (Figure 6h; Table S3). PI for species in cluster three displayed weaker seasonal variation on average compared to clusters one and two and with only secondary roads displaying a seasonal peak during spring migration (Figure 6i; Table S3).
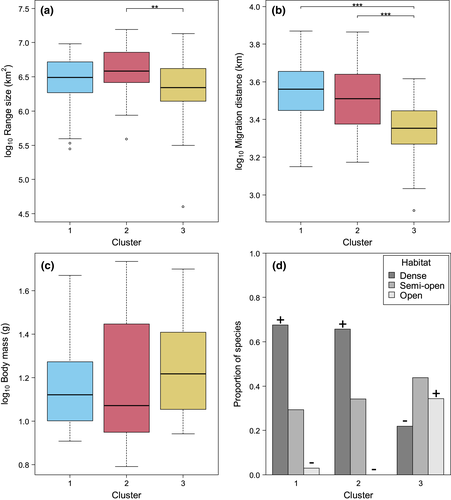
Breeding range size differed significantly on average across species in the three clusters (test statistic = 3.52, p = .042; Figure 7a). Breeding range size was lower on average for species in cluster three compared to species in cluster two (p = .009; Figure 7a). Migration distance differed significantly on average among species in the three clusters (test statistic = 15.13, p < .001; Figure 7b). Migration distance was longer on average for species in cluster one compared to species in cluster two (p < .001) and was longer on average for species in cluster two compared to species in cluster three (p < .001; Figure 7b). Body size did not differ significantly on average among species in the three clusters (test statistic = 1.27, p = .288; Figure 7c). Dense habitat had higher representation and open habitat had lower representation in clusters one and two, and dense habitat had lower and open habitat had higher representation in cluster three (Figure 7d).
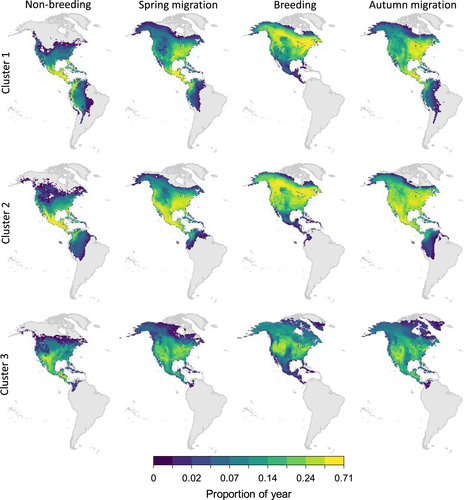
The frequency distribution of the 104 passerine species (Table 1) based on their classifications from the ALAN hierarchical cluster analysis (Figure S4a) and the road density hierarchical cluster analysis (Figure S4b) were not independent (χ2 = 106.79, df = 4, p < .001). The majority of species (79.8%) shared similar PPS associations across the annual cycle between the two cluster analyses (Table 1). Maps displaying the proportion of each of the four seasons for species with identical cluster classifications presented different seasonal distributions (Figure 8). Species in cluster one occurred from northern South America to southern North America during the non-breeding season with the highest proportions located in Central America (Figure 8). Species in cluster two occurred further north during the non-breeding season with the highest proportions located in Central America and southern Mexico (Figure 8). Species in cluster three occurred further north during the non-breeding season with the highest proportions located in Central America and northern Mexico (Figure 8). Species in cluster one migrated primarily through eastern North America in the spring and autumn, species in cluster two migrated across North America in the spring and autumn, and species in cluster three migrated across North America in the spring and autumn (Figure 8). Species in cluster one and two occurred in northern North America during the breeding season and species in cluster three occurred throughout North America during the breeding season (Figure 8).
| ALAN | Road density | Total | ||
|---|---|---|---|---|
| 1 | 2 | 3 | ||
| 1 | 25 | 7 | 5 | 37 |
| 2 | 3 | 31 | 0 | 34 |
| 3 | 6 | 0 | 27 | 33 |
| Total | 34 | 38 | 32 | 104 |
4 DISCUSSION
Our study documented how ALAN and road density affected the occurrence of a diverse collection of nocturnally migrating bird species across the annual cycle within the Western Hemisphere. The overall low prevalence (<50%) of positive associations with ALAN and roads suggests negative associations with ALAN and roads are dominant features of these species' seasonal distributions. This pattern is likely related to species' primary habitat associations, which largely do not include developed or urbanised areas where ALAN and road density are highest. ALAN and road density tended to present similar results across the annual cycle based on our summary statistics. The primary exception was highways, which tended to show more uniform associations across seasons compared to those documented for ALAN and the other three functional road types. These findings suggest that, even though ALAN and road density are weakly correlated across space within our study area, associations with ALAN and roads affected species' occurrence across seasons in a similar fashion.
For Passeriformes, the most pervasive positive association with ALAN and road density occurred during migration when exposure and PI were at their highest levels. Thus, Passeriformes were exposed to high levels of ALAN and road density during migration, and this was associated with more prevalent positive associations. These findings follow those from previous work examining the effects of ALAN on the diurnal occurrence of Passeriformes migrating in North America (La Sorte et al., 2017; La Sorte & Horton, 2021) and evidence that nocturnally migrating birds in the Western Hemisphere tend to migrate in regions with higher ALAN exposure (Cabrera-Cruz et al., 2018). Our results generally align with our expectation on how association with different functional road types would vary for Passeriformes. Positive associations were more pervasive with minor functional road types (secondary roads and local roads) during migration where traffic noise and other disturbance are likely lower. The prevalence of positive associations with major functional road types (primary roads and highways) also increased during migration, but these increases were not matched by a similar increase in PI. These results suggest ALAN has the potential to enhance diurnal associations with roads for nocturnally migrating Passeriformes, with minor roads having potentially greater relevance through the absence of extreme traffic noise and other disturbances.
In contrast, the most pervasive positive associations with ALAN and road density for Anseriformes occurred during the breeding season when exposure was at its lowest levels. The strong seasonal differences in the prevalence of positive associations, however, were not reflected in PI, which showed little seasonal variation and tended to be lowest during the breeding season. These results suggest a limited role for ALAN and roads in determining the diurnal occurrence of Anseriformes. These species are strongly reliant on aquatic habitats, primarily freshwater, during all seasons of the year. These associations may naturally limit exposure to ALAN and roads. With evidence that anthropogenic disturbance can adversely affect breeding populations (Singer et al., 2020), our findings suggest additional work is needed to determine how the combination of low exposure and high prevalence of positive associations effects survival and fitness during the breeding season. The strongest exposure to ALAN and roads occurred during the non-breeding season when the prevalence of positive associations was lowest, suggesting Anseriformes largely avoid ALAN and roads on their wintering grounds. However, there is evidence that some species do not avoid roads or urban areas during the non-breeding season (Ringelman et al., 2015), indicating avoidance may not apply to all species.
For Charadriiformes, ALAN and road exposure was lowest during the breeding season and highest during the non-breeding season, with evidence that exposure increased during spring migration. The prevalence of positive associations with ALAN and road density declined slightly during spring migration and increase substantially during the breeding season. Like Passeriformes, PI for ALAN and roads was highest during migration. These findings suggest Charadriiformes have slightly more dynamic associations with ALAN and roads in the spring compared to the autumn. The annual distributions for Charadriiformes encompass most of the Western Hemisphere (see Figure 2), and these seasonal differences could reflect the use of looped migration strategies (La Sorte et al., 2016), which place these species in regions in the spring with higher ALAN and road exposure. Unlike Anseriformes, which occur primarily in freshwater habitats, Charadriiformes occur in habitats that border freshwater and marine features. The presence of ALAN in these habitats can generate a broad range of ecological effects (Zapata et al., 2019). For Charadriiformes, ALAN can adversely affect the quality of their food resources (Garratt et al., 2019; Luarte et al., 2016), increase opportunities for sight-based foraging (Dwyer et al., 2013; Santos et al., 2010), attract Charadriiformes to degraded habitats near anthropogenic hazards such as buildings and roads (Santos et al., 2010) and increase the nocturnal activities of diurnal predators (McNeil & Rodríguez, 1996). In total, our findings suggest the need for more extensive regional studies to determine how Charadriiformes are affected by ALAN and roads across their geographically extensive annual distributions, and if the similarities documented with Passeriformes translates to additional challenges or hazards for Charadriiformes during migration.
Our examination of Passeriformes revealed three categories of species that presented contrasting associations with ALAN and road density across the annual cycle. The first contained species that migrated through eastern North America where exposure to ALAN and roads was high and positive associations with ALAN and roads were more pervasive. The second group contained species that wintered in Mexico and Central America where exposure to ALAN and roads was high and positive associations with ALAN and roads were considerably more pervasive, especially with ALAN. The breeding grounds for species in this group were located at the higher latitudes of North America where exposure to ALAN and roads was low and negative relationships with ALAN and roads were dominant. The third group contained species that occurred throughout North America during the annual cycle where exposure to ALAN and roads contained little seasonal variation and positive associations with ALAN and roads were largely absent, indicating consistent and strong negative associations.
Species in the first and second groups were composed mostly of warblers (Parulidae, see Tables S1 and S2). These species occurred primarily in dense habitats, tended to have slightly larger breeding ranges, and migrated longer distances. Species in the third group were composed mostly of sparrows (Passerellidae, see Tables S1 and S2). These species occurred primarily in semi-open and open habitats, tended to have slightly smaller breeding ranges, and migrated shorter distances.
Our findings for Passeriformes indicate that the most pervasive negative associations with ALAN and road density occurred for species that were primarily open and semi-open habitat specialists. In contrast, the two groups of Passeriformes that shared strong affinities with dense habitats displayed the most pervasive positive associations with ALAN and road density that differed substantially between seasons. Our findings suggest that these seasonal differences were dictated by how the geographic locations of migration routes and wintering grounds intersected the geography of human activities.
Passeriformes in the second group, where exposure and positive associations with ALAN and roads were strongest on their wintering grounds in Mexico and Central America, may be at increased risk of population declines relative to Passeriformes in the other two groups. There is evidence that increasing anthropogenic activities on neotropical wintering grounds is leading to population declines for Passeriformes (Albert et al., 2020; Paxton et al., 2017; Rockwell et al., 2017; Sillett & Holmes, 2002; Wilson et al., 2018). There is also evidence that the migration strategies for these species are dependent on higher survivorship on their non-breeding grounds (Dokter et al., 2018). Human activities on these species' wintering grounds may therefore create significant challenges that could lead to broad and persistent population declines.
Our findings for Passeriformes in cluster one that migrated through eastern North America also identified differences between spring and autumn migration. Species in this group displayed similarly high levels of exposure and PI with ALAN and road density during spring and autumn migration, but autumn migration presented more pervasive positive associations. Previous work has found a stronger effect during autumn migration of ALAN on the abundance and species richness of some passerine bird species in eastern North America (La Sorte et al., 2017; La Sorte & Horton, 2021). There is also evidence that ALAN interferes with the ability of these species to select appropriate stopover habitat during autumn migration (McLaren et al., 2018), with more species occurring in urban habitats in the autumn (Zuckerberg et al., 2016). These seasonal differences are likely due to the occurrence of a large numbers of migrating juveniles in the autumn (Dokter et al., 2018). Juveniles undertake their first migratory flight in the autumn and, as a group, tend to be more erratic in their migratory behaviour (Ellegren, 1993; Hake et al., 2003; Thorup et al., 2003) and more susceptible to the disorienting influence of ALAN (Gauthreaux, 1982). Our findings emphasise the enhanced risk juvenile Passeriformes face during autumn migration within eastern North America through the combined hazards of ALAN and roads.
One limitation of our analysis is that the data used for ALAN and road density did not always correspond temporally with the bird observations. ALAN has both increased and decreased across the Western Hemisphere (Li et al., 2020), whereas the density of roads has largely increased (Meijer et al., 2018). These temporal inconsistencies likely increased the variance of our estimates, but these inconsistencies are unlikely to systematically bias our results or conclusions. Nevertheless, as the temporal breadth and detail of these datasets increases, the longitudinal connections between environmental change and bird occurrence can be studied in greater detail, providing mechanistic insights into the patterns documented in this study. Another potential limitation of our analysis is the presence of spatial heterogeneity in the density of bird observations. AdaSTEM accounts for variation in data density at regional scales using adaptively constructed model ensembles that balance training data and accounts for heterogeneity across larger spatial scales (Fink, Auer, Johnston, Ruiz-Gutierrez, et al., 2020; Fink et al., 2013). Thus, our broad-scale, multi-species assessment likely captures a consistent measure of central tendency, but applying species-specific, local-scale assessments within data poor regions could be problematic. Efforts to expand the coverage of eBird within data poor regions of the globe would be valuable in refining the spatial quality of these kinds of analyses. A final constraint of our analysis is that we only considered linear relationships when estimating PPS. To determine if this simplification obscures important aspects of the associations documented in this study will require more refined population-level analyses.
Collectively, our findings showed that the effects of ALAN and road density on species' occurrence differed based on taxonomy, habitat, migration strategy and exposure. The implications for nocturnally migrating birds therefore contain regional and species-specific components that must be considered when developing mitigation strategies. In this case, our findings emphasise the need for more informed and comprehensive mitigation strategies for Passeriformes within eastern North America during migration, especially in the autumn, and within Mexico and Central America during the non-breeding season. For Anseriformes, the lack of evidence that ALAN or roads effected the occurrence of these species during migration suggests ALAN and roads do not represent significant range-wide threats, even in high exposure regions. For Charadriiformes, our findings suggest the greatest risks originating from ALAN and roads occur during the breeding season, with evidence that unique associations may develop during migration. Additional work is needed to determine how our findings for Anseriformes and especially Charadriiformes are represented at regional scales across the annual cycle. A key objective should be to determine under what conditions during each season exposure to ALAN and roads adversely effects survival and fitness.
5 CONCLUSIONS
We show that associations between the weekly occurrence of nocturnally migrating bird populations and two defining attributes of human-dominated landscapes – ALAN and roads – are shaped by taxonomy, habitat association, migration strategy and exposure. Our findings underscore the need to customise mitigation strategies and to consider ALAN and roads as interconnected threats. Our results suggest special consideration should be given to Charadriiformes during the breeding season, warblers that use dense habitats and migrate within high ALAN and road exposure regions of eastern North America and warblers that winter in high ALAN and road exposure regions of Mexico and Central America. In total, with evidence that bird populations are declining in North America (Rosenberg et al., 2019), exploring how ALAN and roads act in combination to affect survival and fitness of nocturnally migrating birds across the annual cycle needs greater attention.
ACKNOWLEDGEMENTS
This research would not be possible without the contributions of the eBird participants, expert reviewers and the many other individuals whose work and engagement make the eBird project successful. We thank J. Buler and three anonymous reviewers for constructive suggestions on an earlier draft.
CONFLICT OF INTEREST
The authors declare no conflicts of interest.
Open Research
DATA AVAILABILITY STATEMENT
The AdaSTEM data products can be acquired using the R package ebirdst (Auer et al., 2020). The weekly predictor importance and probability of positive slope estimates generated by AdaSTEM for each of the 166 bird species are available in the Supporting Information (Table S4). The artificial light at night data was acquired from the Earth Observation Group (https://eogdata.mines.edu/nighttime_light/annual/v10/2016/). The road density data were acquired from the Global Roads Inventory Project (https://www.globio.info/download-grip-dataset).
REFERENCES
BIOSKETCH
Our research team uses eBird community-science data to model and study broad-scale patterns of bird occurrence across the annual cycle with a special focus on exploring the implications of global change for migratory bird populations.
Author contributions: F.A.L., A.J., A.D.R., D.F. conceived the study. D.F., A.J. designed the species distribution models. D.F., A.J., T.A., M.E.S. developed the software and implemented the species distribution models. T.A., M.E.S curated the data. F.A.L. designed and implemented the analysis. F.A.L. wrote the first draft of the manuscript. A.J., A.D.R., A.F., B.M.V. contributed edits, suggestions and text to subsequent drafts.


