Tiger abundance and gene flow in Central India are driven by disparate combinations of topography and land cover
Abstract
Aim
Effective conservation of the endangered tiger depends upon reliable knowledge of factors driving genetic differentiation and population connectivity. Connectivity models frequently use resistance surfaces not optimized with actual movement or genetic data which limits reliability. Our aim is to use empirical data on genetic diversity of tiger populations to optimize landscape resistance to gene flow and identify factors that predict local population abundance across Central India.
Location
The study area covers 697,000 km2 across Madhya Pradesh and parts of Rajasthan, Jharkhand and Maharashtra.
Methods
We used genetic data of 309 tigers and restricted multivariate optimization of correlation between landscape variables and genetic distance in a reciprocal causal modelling framework to parameterize a resistance surface for gene flow. We further evaluated the association between effective population size and landscape connectivity using all-subsets logistic regression with model averaging based on AICc.
Results
Gene flow is primarily related to topographic roughness and slope position and secondarily to human footprint and land cover. It is much higher in areas of rough topography and ridge tops and is facilitated by forest cover in areas with low human footprint. In contrast, effective population size in protected areas is primarily driven by extent of protected areas and surrounding forest cover, and is not significantly related to resistant kernel connectivity value.
Main Conclusions
This is the first study to use a rigorous multivariate optimization approach to identify factors which limit gene flow of tigers. Tiger movement is highly affected by landscape features, and dispersing tigers move through rough terrain along forested ridges, avoiding non-forest areas with high human footprint, while local tiger population density is driven primarily by the extent of protected forested habitat. These results have important implications for tiger conservation and can be used to develop empirically supported prioritization of core areas and corridors.
1 INTRODUCTION
Identifying factors influencing population connectivity is essential to delineate core areas, corridors and barriers to population connectivity, which, in turn, are central to effective conservation planning of threatened species (Cushman, Shirk, & Landguth, 2012). However, most landscape connectivity analyses have been based on expert opinion rather than empirical data (Zeller et al., 2014). Expert opinion-based estimates of landscape resistance are of unknown quality, and when tested have often been found to be inferior to predictions from empirical data (Mateo-Sánchez, Cushman, & Saura, 2014; Shirk, Wallin, Cushman, Rice, & Warheit, 2010). Thus, it is advantageous to use empirical data directly related to movement (Cushman & Lewis, 2010; Elliot, Cushman, Loveridge, Mtare, & MacDonald, 2014; Krishnamurthy et al., 2016) or genetic differentiation (Castillo, Epps, Davis, & Cushman, 2014; Cushman, McKelvey, Hayden, & Schwartz, 2006; Shirk et al., 2010; Wasserman, Cushman, Schwartz, & Wallin, 2010) to optimize resistance to movement or gene flow as a function of landscape features.
Landscape genetics provides a robust framework for evaluating hypotheses relating landscape patterns to genetic structure (Balkenhol, Cushman, Storfer & Waits 2016), including addressing questions about the relative influence of different landscape features on dispersal, population isolation and ultimately population vulnerability (Balkenhol et al., 2016; Balkenhol, Gugerli, et al., 2009; Manel, Schwartz, Luikart, & Taberlet, 2003; Segelbacher et al., 2010). While there are many approaches to estimating resistance using landscape genetics (Balkenhol et al., 2016; Manel & Holderegger, 2013), the predominant methodology involves relating matrices of pairwise population or individual genetic distances with cost distances among all pairs of individuals with Mantel tests (Cushman, Shirk, & Landguth, 2013; Cushman et al., 2006; McRae, 2006).
There has been controversy over the use of Mantel tests in landscape genetics (Balkenhol, Waits, & Dezanni, 2009; Graves, Beier, & Royle, 2013; Graves et al., 2012; Guillot & Rousset, 2011, 2013), but a preferable alternative has yet to be identified that does not also suffer drawbacks. Shirk et al. (2010) proposed a restricted multivariate optimization approach that uses Mantel r value as the objective function being optimized across combinations of resistance parameterizations. Castillo et al. (2014) showed using simulations that the Shirk et al. (2010) multivariate optimization using the reciprocal causal modelling approach proposed by Cushman, Wasserman, Landguth, and Shirk (2013) was highly successful in correctly identifying true drivers of genetic differentiation and estimating useful resistance surfaces. The approach is based on relative support of each candidate model in competition with all other candidate models at each step of a restricted multivariate optimization. Recently, Zeller et al. (2016) found that restricted multivariate optimization with reciprocal causal modelling provided better identification of factors driving gene flow than several other approaches.
The objective of this study was to use restricted optimization with reciprocal causal modelling to identify the relationship between landscape factors and gene flow for tigers in Central India to guide future work to develop effective conservation and management solutions for this endangered species. A secondary objective was to determine the factors that are correlated with local tiger population size and assess how and why they may differ from the factors affecting gene flow.
2 METHODS
2.1 Study area
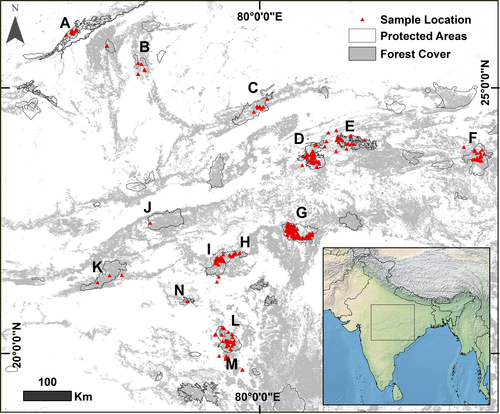
Our study area covers approximately 697,000 km2 in Central India encompassing Madhya Pradesh and parts of Rajasthan, Jharkhand and Maharashtra (Figure 1). Extensive mountain ranges, such as the Aravallis to the north-west, Satpura in the south and Chota Nagpur plateau in the north-east, traverse the boundaries of the study area, with several hill ranges such as Vindhyas, Mahadeo Hills and Maikal Range with elevations ranging between 200 m and 1,000 m lying in between. Approximately 25% of this study area is forested (Forest Survey of India, 2013). The relatively extensive remaining forest areas in Central India owe their presence to hills and plateaus with patches of shallow infertile soils which greatly limit cultivation (Jhala, Qureshi, Gopal, & Sinha, 2011). Forest vegetation here is dominated by tropical moist deciduous and tropical dry deciduous forests. The climate is hot and humid, with temperatures falling to 1°C in winters and rising to 48°C in summers. The mean annual precipitation in this region is 1,160 mm, most of which falls between months of June and October during the south-west monsoon. This area includes several protected areas and is the landscape with the most extensive occupancy by tigers in India (Jhala et al., 2011). Major threats to this iconic landscape such as mining, construction of railways and highways, irrigation and thermal projects are increasing, with expanding demand for energy and natural resources to support India's rapidly growing economy and exploding human population (Jhala et al., 2011).
2.2 Sample collection
Samples used in this study were obtained from thirteen tiger subpopulations in Central India—Ranthambore, Madhav-Shivpuri, Panna, Bandhavgarh, Sanjay-Dubri, Palamau, Kanha, Pench, Satpura, Melghat, Tadoba-Andhari, Chandrapur and Brahmapuri (Figure 1). Study samples include tiger faecal samples collected from 2006 to 2013 and forensics samples which came to our laboratory for species and individual identification from 2009 to 2015. We surveyed and collected large carnivore faecal samples along forest roads, pathways and near water bodies in core protected areas, in zip-lock covers with silica beads and with all collection details duly noted.
2.3 DNA extraction and genotyping
We extracted DNA from faecal samples by a modified guanidinium thiocyanate-silica procedure (Reed, Tollit, Thompson, & Amos, 1997) and from soft tissue and bones samples by phenol-chloroform method (Sambrook, Fritsch, & Maniatis, 1989). We did this in a dedicated room free of PCR products to minimize contamination. We extracted DNA from sets of ten samples along with an extraction control to monitor for contamination at the time of isolation. We screened all DNA extracts with a tiger-specific PCR assay (Bhagavatula & Singh, 2006) and further analysed only tiger-positive samples. As faecal samples yield unpredictable amounts of low-quality DNA, which can lead to subsequent genotyping errors, we quantified the amount of DNA in each tiger-positive sample by qPCR (Reddy, Bhavanishankar et al., 2012). We amplified selected samples at 13 microsatellite loci; ten tetranucleotide loci—F37, F42, F53, F115, F124, F141, F146, Fca391, Fca441, Fca424; one trinucleotide locus—E6; and two dinucleotide microsatellite loci—Fca96 and E7 (Bhagavatula & Singh, 2006; Menotti-Raymond et al., 1999), and electrophoresed and analysed PCR products as described in Reddy, Bhavanishankar et al. (2012). We performed all PCR steps, except addition of template DNA, in a UV-irradiated hood to avoid contamination and included positive and negative controls with each reaction. We electrophoresed PCR products in an ABI 3730 Genetic Analyser and sized alleles relative to an internal control (500LIZTM; Applied Biosystems) using GeneMapper software version 3.7 (Applied Biosystems). We identified sex of putative individuals by typing X-Y homologous zinc finger and amelogenin loci (Pilgrim, McKelvey, Riddle, & Schwartz, 2005). We used allele frequency and identity tests in cervus 3.0 to find matching pairs of genotypes. Number of loci required to distinguish individuals depends on the variability of each locus and number of loci used. We used population allelic frequencies from cervus 3.0 (Kalinowski & Marshall, 2007) to determine probability of identity (individual and sibling) and subsequently restricted the minimum number of loci required to match a pair of genotypes at eight. We allowed for mismatches in up to three loci in order to rule out misidentification of genotypes as a result of genotyping errors, and manually re-examined mismatching genotypes to rule out scoring or entry errors. In ambiguous cases, we again genotyped the concerned loci.
2.4 Genetic distance, migration rate and effective population estimates
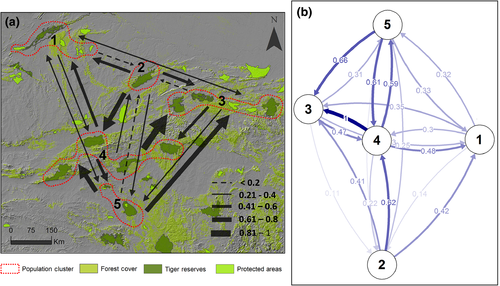
We calculated pairwise, individual-by-individual (N × N) genetic distance based on proportion of alleles shared between individuals, with co-dominant genotype data of 309 tigers in GenAlEx 6.501 (Peakall & Smouse, 2012). The genetic distance matrix was summed over all loci under assumption of independence (Table S1). Based on observed forest connectivity (Jhala et al., 2011; Reddy, Gour et al., 2012; Sharma et al., 2013; Yumnam et al., 2014), we grouped the subpopulations into five major clusters—Ranthambore—Madhav Shivpuri; Panna; Bandhavgarh—Sanjay Dubri—Palamau; Kanha—Pench—Satpura—Melghat; Tadoba-Andhari—Chandrapur—Brahmapuri (Figure 2). We used individual genetic distances to estimate the amount of migration between populations—the number of migrants per generation in an island model, Nm (Alcala, Goudet, & Vuilleumier, 2014; Keenan, McGinnity, Cross, Crozier, & Prodöhl, 2013; Sundqvist, Zackrisson, & Kleinhans, 2016). We used NeEstimator 2.01 (Do et al., 2014) to estimate contemporary effective population size (Ne) based on the linkage disequilibrium model of random mating with critical value or the lowest allele frequency at 0.050 and 0.010 to screen for rare alleles in our data (Table 1). Rare-allele screening using critical values helps evaluate effects of low-frequency alleles on estimates of effective size (Waples, 2006).
| Protected areas | Estimated Ne | |
|---|---|---|
| Critical value (0.050) | Critical value (0.010) | |
| Ranthambore | 25.2 | 31.7 |
| Bandhavgarh-Sanjay | 86.0 | 101.5 |
| Palamau | 90.0 | 61.9 |
| Kanha | 60.1 | 61.1 |
| Pench | 79.4 | 31.6 |
| Tadoba-Chandrapur-Brahampuri | 28.0 | 39.5 |
2.5 Landscape variables
We selected land cover, topography and human footprint as landscape variables for analysis based on available knowledge of tiger–habitat associations (Schaller, 2009; Smith, 1993) and their importance in predicting tiger movement (Krishnamurthy et al., 2016). We used the land cover map produced by the Forest Survey of India (2013) which is updated every 2 years at 1:50,000 scale. We derived topographical roughness and relative slope position from the Shuttle Radar Topography Mission (SRTM) digital elevation model (Jarvis, Reuter, Nelson, & Guevara, 2006). Topographical roughness measures topographical complexity of the landscape within a defined focal extent (Blaszczynski, 1997; Riley, DeGloria, & Elliot, 1999). Relative slope position measures the relative position of the focal pixel within a defined extent on a gradient from valley bottom to ridge top. Both topographical roughness and relative slope position were calculated using Geomorphometry and Gradient Metrics Toolbox in ArcGIS 10.0 (Evans, Oakleaf, Cushman, & Theobald, 2014) at a focal radius of 450 m. We also evaluated the influence of human footprint, derived largely from a combination of road density and remote sensing analysis of night lights (WCS and CIESIN 2005).
2.6 Landscape genetic modelling approach
2.6.1 Overview
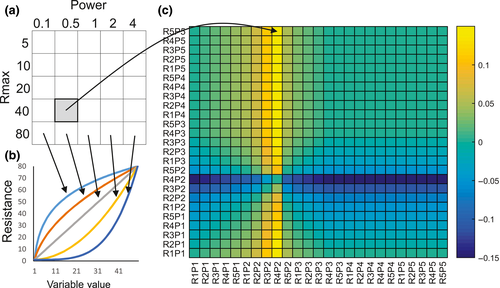
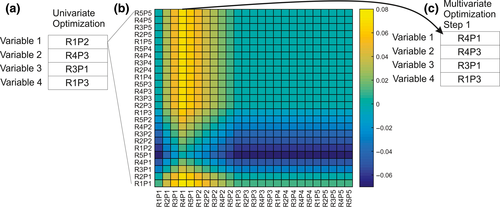
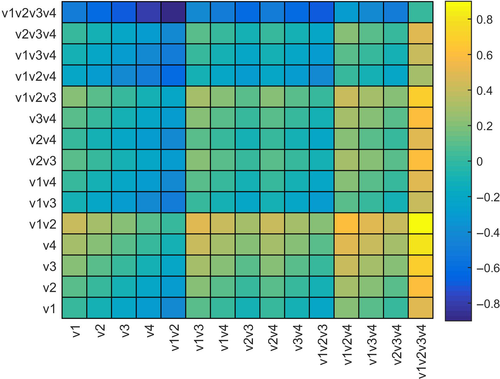
We used a restricted multivariate optimization approach to parameterize landscape resistance values and select a final resistance surface (Castillo et al., 2014; Shirk et al., 2010). The approach is based on the idea that each landscape variable might be most strongly related to gene flow at a particular thematic resolution (e.g., combination of functional shape and maximum resistance) and that in multivariate combination, landscape variables may have a different optimal thematic resolution than they would in isolation. The optimization works in three steps. First, we evaluate the relationship between genetic differentiation and each landscape variable across all of its candidate thematic resolutions and select the thematic resolution parameters for each that produce the strongest correlation between genetic differentiation and cost distance (Figure 3). Second, we perform a restricted multivariate optimization to optimize the thematic resolution parameterization of each landscape variable in the context of the influence of all other variables (Figure 4). Finally, we determine which variables are included in the final resistance model by running an all-subsets analysis of all combinations of the optimized landscape variables and determining which subset of variables produces the most strongly supported correlation with genetic differentiation (Figure 5).
2.6.2 Thematic resolution
The thematic resolution at which landscape variables are analysed can have dramatic influences on their apparent relationships with gene flow (Cushman & Lewis, 2010; Shirk et al., 2010). To address this, we evaluated a range of functional forms and maximum resistance values for each variable (Table 2), both of which are important attributes of thematic resolution that affect landscape genetic analyses (Shirk et al., 2010). Specifically, for each variable, we evaluated five levels of maximum resistance (RMax = 5, 10, 20, 40, 80) in which resistance was scaled from 1 to RMax. In addition, we evaluated a range of power functions (Shirk et al., 2010) that control the shape of the functional response between the landscape variable and resistance to gene flow, ranging from highly convex (power = 0.1) to highly concave (power = 4).
| Variable | Univariate optimization | Multivariate optimization |
|---|---|---|
| Human footprint | 1st Power, 5 max; 0.07723; p = .006 | 4th Power, 10 max |
| Land cover | 4th Power, 5 max; 0.07311; p = .0130 | 4th Power, 5 max |
| Slope position | 4th Power, 80 max; 0.0779; p = .0050 | ½ Power, 80 max |
| Topographical roughness | 4th Power, 80 max; 0.114724; p < .001 | 4th Power, 80 max |
| Combined | 0.0943; p < 0.001 | 0.1286; p < .001 |
We modelled resistance as a function of roughness according to two alternative hypotheses (1) that tiger dispersal may be impeded by rough terrain such that tigers prefer to disperse through flat topography or (2) that tigers seek to avoid risk of human encounters while dispersing and so select areas with high topographical roughness. To test whether topographical roughness influences gene flow, we produced two “families” of resistance surfaces as a function of roughness, one in which resistance increased with roughness and one in which it decreased. For each of these, we calculated all combinations of the five RMax and five exponents of the power function (0.1, 0.5, 1.0, 2.0 and 4.0).
Similarly we modelled resistance as a function of slope position according to two alternative hypotheses (1) that tigers may select low-elevation valleys for dispersal to reduce energetic costs or (2) that tigers seek to avoid risk of human encounters while dispersing and so select ridge tops. We produced two “families” of resistance surfaces as a function of slope position, one in which resistance increased with slope position and one in which it decreased and calculated all combinations of the five RMax and five exponents of the power function (0.1, 0.5, 1.0, 2.0, 4.0).
We modelled resistance due to land cover according to the hypothesis that tiger dispersal should be facilitated by forest and other natural vegetation types and impeded by agricultural and other human-dominated land cover types. We reclassified the land cover map into five classes hypothesized to increase in relative resistance from (1) closed canopy forest, (2) scrub forest, (3) agricultural village mosaic, (4) urban areas, and (5) water bodies such as reservoirs. We produced resistance layers for land cover across all combinations of the five RMax and five exponents of the power function (0.1, 0.5, 1.0, 2.0 and 4.0).
We calculated resistance layers for human footprint under the hypothesis that landscape resistance to gene flow would increase with increasing human footprint. We calculated 25 human footprint resistance hypotheses across all combinations of the five RMax and five exponents of the power function (0.1, 0.5, 1.0, 2.0 and 4.0).
2.6.3 Univariate optimization
Following the method of Shirk et al. (2010), we evaluated the strength of support for each landscape variable across the full suite of thematic resolutions. We used costmat function in sGD (Shirk, Cushman, & Landguth, 2012) to model isolation by resistance and construct a pairwise resistance matrix for each landscape resistance surface. For each landscape variable, we identified the top candidate model by a unimodal peak of support in partial Mantel values of correlation between genetic distance and cost distance for that variable (Shirk et al., 2010). In the cases where there was a plateau rather than a peak of support, we chose the model corresponding to the point at which values began to plateau.
2.6.4 Multivariate optimization
We used the restricted optimization method of Shirk et al. (2010) as refined by Castillo et al. (2014) to optimize the Rmax and shape parameters of each variable in the context of influence of all other variables in a multivariate model. Specifically, the multivariate optimization started with the landscape variable with highest partial Mantel correlation between genetic distance and cost distance, partialling out geographic distance (GD~RD|IBD) and then created a series of alternative models by varying model parameters for that variable, while holding the parameters of all other variables constant at their univariate optima.
We identified the best supported model parameters for the focal variable based on the relative support criterion developed by Cushman, Wasserman et al. (2013) and as implemented by Castillo et al. (2014) in which a matrix of partial Mantel correlations is produced in which each row is an alternative model being partialled out and each column is a focal model being correlated with genetic differentiation. A fully supported model would have positive values down its column and near zero or negative values across its row, indicating that model is supported independent of all other candidate models and no candidate models are supported independently of it.
Next, we varied parameters for the variable with the second largest univariate partial Mantel r, while holding the others at their univariate optima, and the first landscape variable at the new optimum identified in the first step and identified a new set of optimal parameters for that variable based on the relative support criterion. We repeated this process for each variable in turn, competing each of its parameterizations against each other in the context of the influence of the other variables, until the parameterization of each variable stabilized.
The final step of the multivariate optimization was an all-subsets analysis of all combinations of landscape variables at their multivariate optima to determine which variables to include in the final resistance surface. Candidate models in this pool were competed against each other using the relative support criterion to determine which combination of variables was supported independently of all other combinations.
2.7 Association between genetic diversity and landscape connectivity
We evaluated the association between effective population size and landscape connectivity of tigers in Central India using all subsets generalized linear model regression. A priori we hypothesized that genetic effective population size could be related to several factors, including the following: (1) proportion of the local landscape covered by protected areas, (2) local extent of forest cover, (3) local average human footprint, (4) local landscape resistance as predicted by the landscape genetic optimization, and (5) cumulative resistant kernel value of connectivity across the resistance layer produced by landscape genetic optimization. Following Cushman, Lewis, and Landguth (2014), we expected that cumulative resistant kernel value would out-predict other measures, because it measures functional connectivity of the region surrounding each population centre and is an index of rates of movement across the local landscape, which is the primary driver of genetic diversity within populations. We also predicted that effective population size would be positively related to extent of the local landscape covered by protected areas and forest cover, given that these provide habitat and lower anthropogenic mortality risk.
We produced each of these landscape predictor variables at 18 spatial scales, corresponding to focal mean values taken at the centroid of each of the population areas. These scales are radii of 2,500–45,000 m by steps of 2,500 m and were chosen to evaluate how the association between landscape features and genetic diversity changes as a function of scale (Krishnamurthy et al., 2016; McGarigal, Wan, Zeller, Timm, & Cushman, 2016). We expected that local effective population size would be associated with landscape features at relatively broad extents. We standardized all predictor variables to unit standard deviation and zero mean. We conducted univariate scaling (Cushman, Elliot, MacDonald, & Loveridge, 2015) to identify the best scale for each predictor variable using linear regression (Table 3, Figs S1–S5). We then used an all-subsets model averaging to identify the model-averaged parameter values that best predicted genetic diversity among populations and evaluated variable importance based on magnitude of standardized regression coefficients (Smith, Koper, Francis, & Fahrig, 2009) and AICc variable importance value, including only variables that had univariate models with p-value <.2 (Krishnamurthy et al., 2016).
| Estimate | SE | Z | Pr(>|z|) | |
|---|---|---|---|---|
| (Intercept) | 61.45 | 11.48 | 15.18 | 5.13E-05 |
| Proportion of landscape within 45-km radius covered by protected areas | 20.91 | 9.97 | 14.12 | 0.139 |
| Mean landscape resistance with a 42.5-km radius | −20.27 | 10.3 | 14.59 | 0.165 |
| Mean forest cover within a 45-km radius | 20.06 | 10.4 | 14.73 | 0.173 |
3 RESULTS
3.1 Sample collection and genotyping
We collected 1,646 carnivore faecal samples from protected areas in Central India from 2006 to 2013, out of which 970 samples were found to be tiger-positive. We genotyped 787 faecal DNA samples at eight to thirteen loci. Probability of two siblings sharing the same genotype, or PID(sib), for eight least variable loci and for all thirteen loci was 2.17 × 10⁻³ and 1.99 × 10⁻⁵, and the probability of identity for two unrelated individuals (PID) was 4.79 × 10⁻⁷ and 2.8 × 10⁻¹², respectively. After microsatellite genotyping, we identified 274 individuals each of which was recaptured in our data set 0–9 times. We also received 10 faecal samples from Wildlife Institute of India, Dehradun, which were collected from Panna Tiger Reserve, Madhya Pradesh, in 2006. All 10 of these samples were tiger-positive and represented 10 individuals. We received and analysed 25 forensic cases from our study area from 2009 to 2015, pertaining to tiger deaths where carcasses were found in respective forest areas.
3.2 Univariate model optimization
Topographic roughness had the strongest univariate correlation with genetic distance, after partialling out the IBD model, followed by slope position, human footprint and land cover (Table 2). Partial Mantel correlation was significant for all variables at optimal univariate thematic resolutions. Both slope position and topographical roughness had optimal univariate thematic resolutions with RMax values of 80 and power exponents of 4, indicating high effect on resistance and that resistance increases in a highly convex manner. Both human footprint and land cover had univariate RMax values of 5, indicating much weaker effects than topography on resistance to gene flow. Land cover had a power exponent of 4 indicating a highly convex response of resistance to land cover, while human footprint had a power exponent of 1 indicating the resistance increased linearly with increasing human footprint.
3.3 Multivariate model optimization
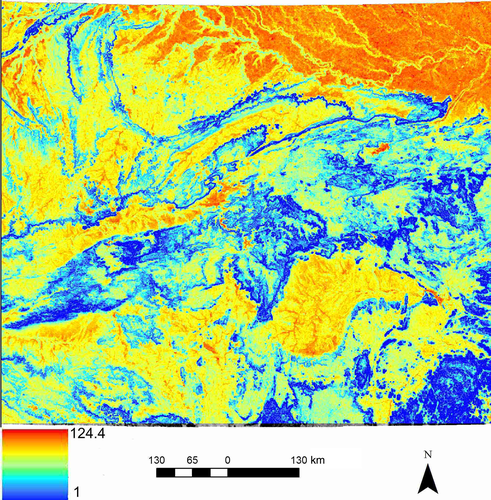
The best multivariate model based on optimization with partial Mantel correlation included all four variables (topographical roughness, slope position, land cover and human footprint). This optimized multivariate model included the same thematic resolutions for roughness and slope position as the univariate optimization (RMax = 80; power exponent = 4) and for land cover (RMax = 5, power exponent = 4). In contrast, optimal thematic resolution for human footprint changed from RMax = 5 exponent = 1 to RMax = 10 exponent = 4 (Table 2). Partial mantel R value, controlling for geographical distance, was higher for multivariate optimized combination than the combination at their univariate optimized resistance values (r = .1286 vs. r = .0943, respectively). The final optimized resistance surface shown in Figure 6 indicates that resistance to tiger gene flow is low along topographically rough mountain ranges, particularly along ridge tops, and is much higher in flat valley settings, especially those with high human footprint and low forest cover, with topographical effects dominating.
3.4 Effective population size—Univariate scaling
Univariate scaling analysis of the association between effective population size and landscape connectivity found significant univariate relationships for all four predictor variables. Percentage of forest cover in the focal landscape had the strongest relationship at the broadest scale of 45 km radius, where the standardized coefficient reached its maximum of 20.06 (Fig. S1). Percentage of the focal landscape in protected areas also showed strongest prediction of effective population size at the broadest scale analysed, with a standardized regression coefficient of 20.91 at 45,000 m focal radius extent (Fig. S2). Human footprint had strongest relationship with effective population size at the second to broadest scale of 42.5 km focal radius extent, with standardized coefficient reaching its largest magnitude of −16.41 (Fig. S3). Focal mean of landscape resistance also had strongest relationship with tiger effective population size at the second broadest scale analysed, reaching a maximum standardized coefficient value of −20.27 (Fig. S4). Cumulative resistant kernel value had strongest relationship with tiger effective population size at the second broadest scale analysed with an AICc value of 61.33 and standardized coefficient of 11.17 (Fig. S5). Based on relative magnitudes of standardized variable coefficients, extent of protected areas, focal mean of landscape resistance and extent of forest cover all had nearly equal effect size, with coefficients ranging from 20.90 to 20.06, with protected areas having slightly greater effect size than the others. Human footprint and cumulative resistant kernel values were the least influential variables based on magnitude of standardized coefficient, and neither were statistically significant at any scale.
3.5 Multivariate analysis
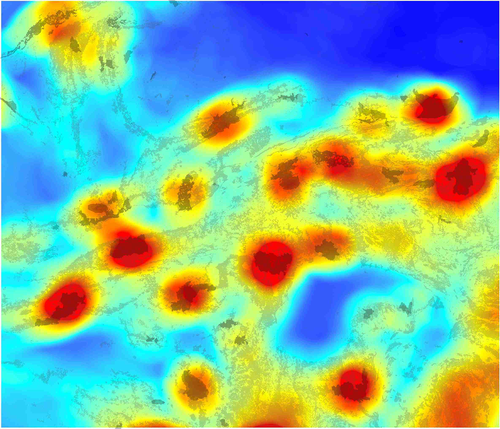
We ran all subsets linear regression with model averaging on the three variables with significant univariate relationships with local tiger effective population size (area of protected areas at 45-km radius, forest cover at 45-km radius and local landscape resistance at 42.5-km radius) to obtain model-averaged coefficients to predict local effective population size across the landscape. The predicted map of effective population size of tigers across the Central Indian study area clearly shows a dominant effect of size and proximity of protected areas in the local landscape, with all areas of very high predicted effective population size centred on protected areas (Figure 7). The map also shows considerable additional influence of forest areas outside of protected areas in predicting moderate effective population sizes.
4 DISCUSSION
4.1 Model optimization and reciprocal causal modelling
The results of univariate model optimization suggested that topographical roughness was the factor most strongly correlated with gene flow of tigers in Central India, followed by slope position, with human footprint and land cover having statistically weaker relationships to genetic differentiation based both on the strength of correlation and effect size, as indicated by RMax values. We had two alternative hypotheses for topographical roughness and slope position. The first was that tiger dispersal would be highest in areas with low topographical roughness and in valley locations, reflecting the increased energy efficiency of moving through flat terrain at valley bottoms. The second was that tigers would select dispersal paths to minimize risk of human conflict by selecting topographically rough terrain and ridge tops where cover is higher and human activities are lower. Our results provide unequivocal support for the latter hypothesis, with clear facilitation of gene flow by landscape conditions with high topographical roughness and on ridge tops.
It is somewhat surprising that we found such weak relationships between human footprint and land cover and genetic differentiation, given that land cover is often a dominant predictor of resistance to gene flow for carnivores (Cushman et al., 2006; Mateo-Sánchez et al., 2015). In addition, Krishnamurthy et al. (2016) recently identified forest and scrub-forest cover (using the same classifications as in this paper) as the strongest predictors of tiger dispersal movements using conditional logistic regression analysis of telemetry data. The weak effect of land cover and human footprint observed here could be the result of several not mutually exclusive processes. For example, Reding, Bronikowski, Johnson, and Clark (2012) found that land cover was a strong predictor of movement path selection of bobcats but a poor predictor of genetic differentiation in the same landscape. They proposed a combined effect of insufficient broad-scale heterogeneity in land cover to limit gene flow (Cushman, Shirk et al., 2013) and a time-lag effect (Landguth et al., 2010) given the recent expansion of bobcat into the study area. In our case, we do not believe that landscape heterogeneity is insufficient to affect gene flow, given the very high contrast and fragmentation of forest cover by human-dominated land uses in the study area. Likewise, we do not face a situation where there is an expanding tiger population that may be out of genetic equilibrium with the current landscape. In this case, we suspect that the driver of topographical dominance of landscape resistance estimates we produced are likely due to patterns of dispersal behaviour that are less risk averse than movement behaviour within home ranges. Krishnamurthy et al. (2016) found that relocated tigers that were naïve to their new landscapes did indeed select forest cover and avoid human-dominated landscapes to a high degree, while also selecting topographically rough terrain and ridge tops for movement, in agreement with this study. That study found a relatively much larger effect of land cover than we found here, probably due to the newness of the terrain to the translocated animals.
A possible explanation of the weaker land cover effect in this study than seen in Krishnamurthy et al. (2016) could be related to time-lag effects. Specifically, the Krishnamurthy et al. (2016) study focused on real-time patterns of movement of dispersing tigers in the current landscape. These tigers experience topography and land cover as they currently exist. In contrast, gene flow is known to take time to equilibrate genetic structure in response to landscape change (e.g., Landguth et al., 2010). Land cover in Central India has changed rapidly over the past 100 years, with very large decreases in forest cover and increases in human footprint, particularly in valley locations. Therefore, there may be a disequilibrium between the genetic structure of the population, which may reflect land cover conditions of past decades, and the current extent and pattern of forest cover. Conversely, as topography has been stable for thousands of years, there is no time-lag effect, which could lead to stronger apparent relationships with topography even if tigers are equally or more strongly responding to land cover. It would be interesting to test this hypothesis by evaluating relationships between genetic structure and historical land cover as it existed in prior decades. Unfortunately, we did not have access to accurate historic land cover data and cannot test this hypothesis.
Another possible explanation for the dominance of topography over land cover effects was provided by Wasserman et al. (2010) for American marten. Specifically, Wasserman et al. (2010) found that gene flow of American marten was driven by elevation and not by land cover, even though land cover was a strong predictor of marten occurrence across the landscape. Their explanation was that dispersal behaviours driving gene flow are much less restricted than behaviours driving habitat use within established home ranges, and therefore, it should not be surprising that gene flow is less restricted by habitat quality than is home range selection. These findings have been subsequently confirmed by Elliot et al. (2014) and Mateo-Sánchez et al. (2015) in African lions and European brown bears, respectively. Elliot et al. (2014) found that dispersing lions were far less risk averse and avoided human-dominated land cover types and areas of high human footprint far less than territorial adults of either sex. Similarly, Mateo-Sánchez et al. (2015) found that landscape resistance predicted from genetic data, using the same optimization methods as in this paper, indicated far weaker avoidance of human land cover types and high human footprint than a resistance model developed from a habitat suitability map.
Our results also show, as seen in other species (Mateo-Sánchez et al., 2015; Shirk et al., 2010; Wasserman et al., 2010), that the factors that drive local patterns of occurrence and abundance are not the same as the factors that compel gene flow. Tiger effective population size is primarily driven by extent of protected areas and surrounding forest cover and was not significantly related to resistant kernel connectivity value. Cushman et al. (2014) found that cumulative resistant kernel value was a very strong predictor of locations of American black bear movement in a forested landscape in North America. The strong difference in the patterns of resistant kernel connectivity and predicted effective population size indicate that dispersal and local abundance of tigers in Central India are driven by different factors. As discussed in Wasserman et al. (2010) and Mateo-Sánchez et al. (2015), this should not be surprising, as local population size of tigers in Central India is likely most limited by the extent of protected land and forest cover to support sufficient prey populations and provide sufficiently reduced anthropogenic mortality. In contrast, dispersal patterns of tigers seem to be driven primarily by topographical features (ridge tops) that have low human footprint and relatively high cover of natural forest. These areas facilitate movement by providing topographically low cost routes that are relatively low risk, but may not provide quality habitat for supporting resident tiger populations.
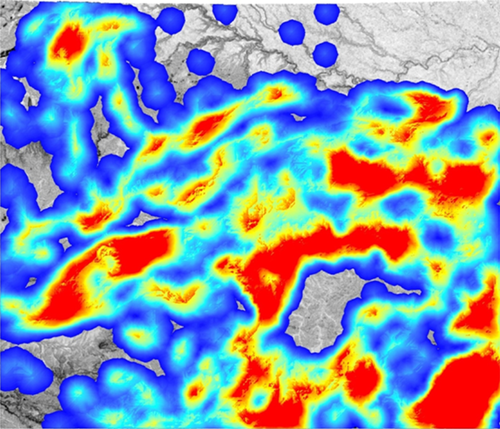
We illustrate the pattern of population connectivity for tigers across Central India predicted by applying resistant kernel modelling with UNICOR (Landguth et al., 2012) to the optimized resistance map in Figure 8. The resistant kernel modelling shows three important things about landscape connectivity in Central India. First, there are about 13 major “core areas,” indicated by dark red patches in the resistant kernel map. These are areas that are predicted to have high internal connectivity that allows for ready movement of individuals across these areas. These potential core population areas should receive high priority of conservation given the paramount importance of maintaining large source populations to metapopulation viability. Second, the areas in yellow indicate there is potentially substantial connectivity among these core populations, but the areas of relatively high connectivity between them (yellow) are often narrow and potentially vulnerable to being broken by development and habitat loss. The major linkages among the red core populations should be prioritized for conservation. Finally, the kernel model predicts a number of areas where tigers are predicted to be completely blocked from dispersal (gray areas) and areas where dispersal is expected to be very low (blue areas). These include several areas among important core areas and protected areas. This indicates there is a relative high degree of fragmentation in the system and potentially high vulnerability for some of the core populations to become isolated.
5 CONCLUSIONS
This is the first study to use a rigorous multivariate optimization approach to understand factors correlated to population abundance and those which limit gene flow of tigers. Being a solitary and long-ranging animal, factors impeding tiger movement will have long-term consequences on reproductive fitness and population survival. Tiger movement is highly affected by landscape features, and dispersing tigers likely move through rough terrain along forested ridges, avoiding non-forest areas with high human footprint, while tiger populations are largest in locations centred on large protected areas with extensive forest cover within and surrounding them. These results have important implications for tiger conservation and management and can be used to develop empirically supported prioritization of core areas and corridors. Specifically, applying such approaches as resistant kernel modelling to identify and prioritize core areas and corridors for conservation could improve the effectiveness and efficiency of tiger conservation efforts in the Central Indian landscape.
ACKNOWLEDGEMENTS
We gratefully acknowledge logistic support extended by all forest personnel in Central India. We especially thank all researchers and field assistants from CCMB who helped us in painstakingly build up our genetic data on tigers in India. This study was funded by the Department of Biotechnology, Govt. of India, and the Council of Scientific and Industrial Research, Govt. of India. The authors declare that they have no conflict of interest.
AUTHOR CONTRIBUTIONS
P.A.R. and S.A.C. designed the study, carried out analyses, interpreted the results and wrote the manuscript; A.S., M.S.S. and S.S. contributed to the analyses and writing. All authors read draft versions of the manuscript.
REFERENCES
BIOSKETCH
P. Anuradha Reddy studies conservation biology and population genetics of endangered mammals in India. Samuel A. Cushman is involved in developing statistics and software for landscape pattern analysis, vegetation distribution, growth, regeneration along biophysical gradients and effects of management, fire and climate regimes on vegetation pattern and process at landscape levels. His research interests include effective multiresource monitoring, multiscale wildlife habitat relationships modelling and new approaches to model habitat connectivity. Ankita Srivastava is presently studying bioinformatics. Mriganka Shekhar Sarkar studies ecology and conservation biology of large mammals. S. Shivaji did research in conservation biology and animal reproduction and continues to study microbial biodiversity.


